
Related Blogs
January 10, 2024 | Avalon Team
One of the easiest ways to stay on the “right side of the market” is to simply pay attention to the relative strength of the various asset categories.
My preferred method is to use “absolute momentum,” which always considers where an asset category is versus the return available from a risk-free investment such as a T-bill or money market.
As I have mentioned in previous issues, relative strength by itself just compares across the study set – they could all be falling, some less than others, but that does not mean they are attractive to invest in.
Adding the requirement for positive absolute return changes the ballgame to where you are only focused on asset categories performing positively.
With this in mind, here’s a look back at 2023 and where we are today.

Studying this, we can see that absolute momentum would have had investors in “risk assets” at the beginning of last year, but correctly holding cash during the brunt of the selling during September and October.
Even better, it correctly got back into stocks to capture the year-end rally.
Today we can see that the market remains firmly in a “risk-on” position with SPY and QQQ leading the way.
Just as important as what to own is what to avoid.
And now, this is saying to avoid U.S. Treasuries and Emerging Markets.
We can easily apply this same style of analysis to sectors as well.
In doing so, we can see that the Financials and the Industrials are the top-ranked U.S. sectors.

Similarly, this approach correctly had investors protected during the market weakness of September through October, only to capture the explosive move in the Financials at year-end.
Currently, this is informing investors to avoid Energy which is the lowest-ranked sector.
This correlates well too with our more advanced relative-strength matrix where energy and oil services are ranked #45 and #42 respectively.

Even though the above analysis can be considered constructive on the market, here are a couple of things I am attentively watching.
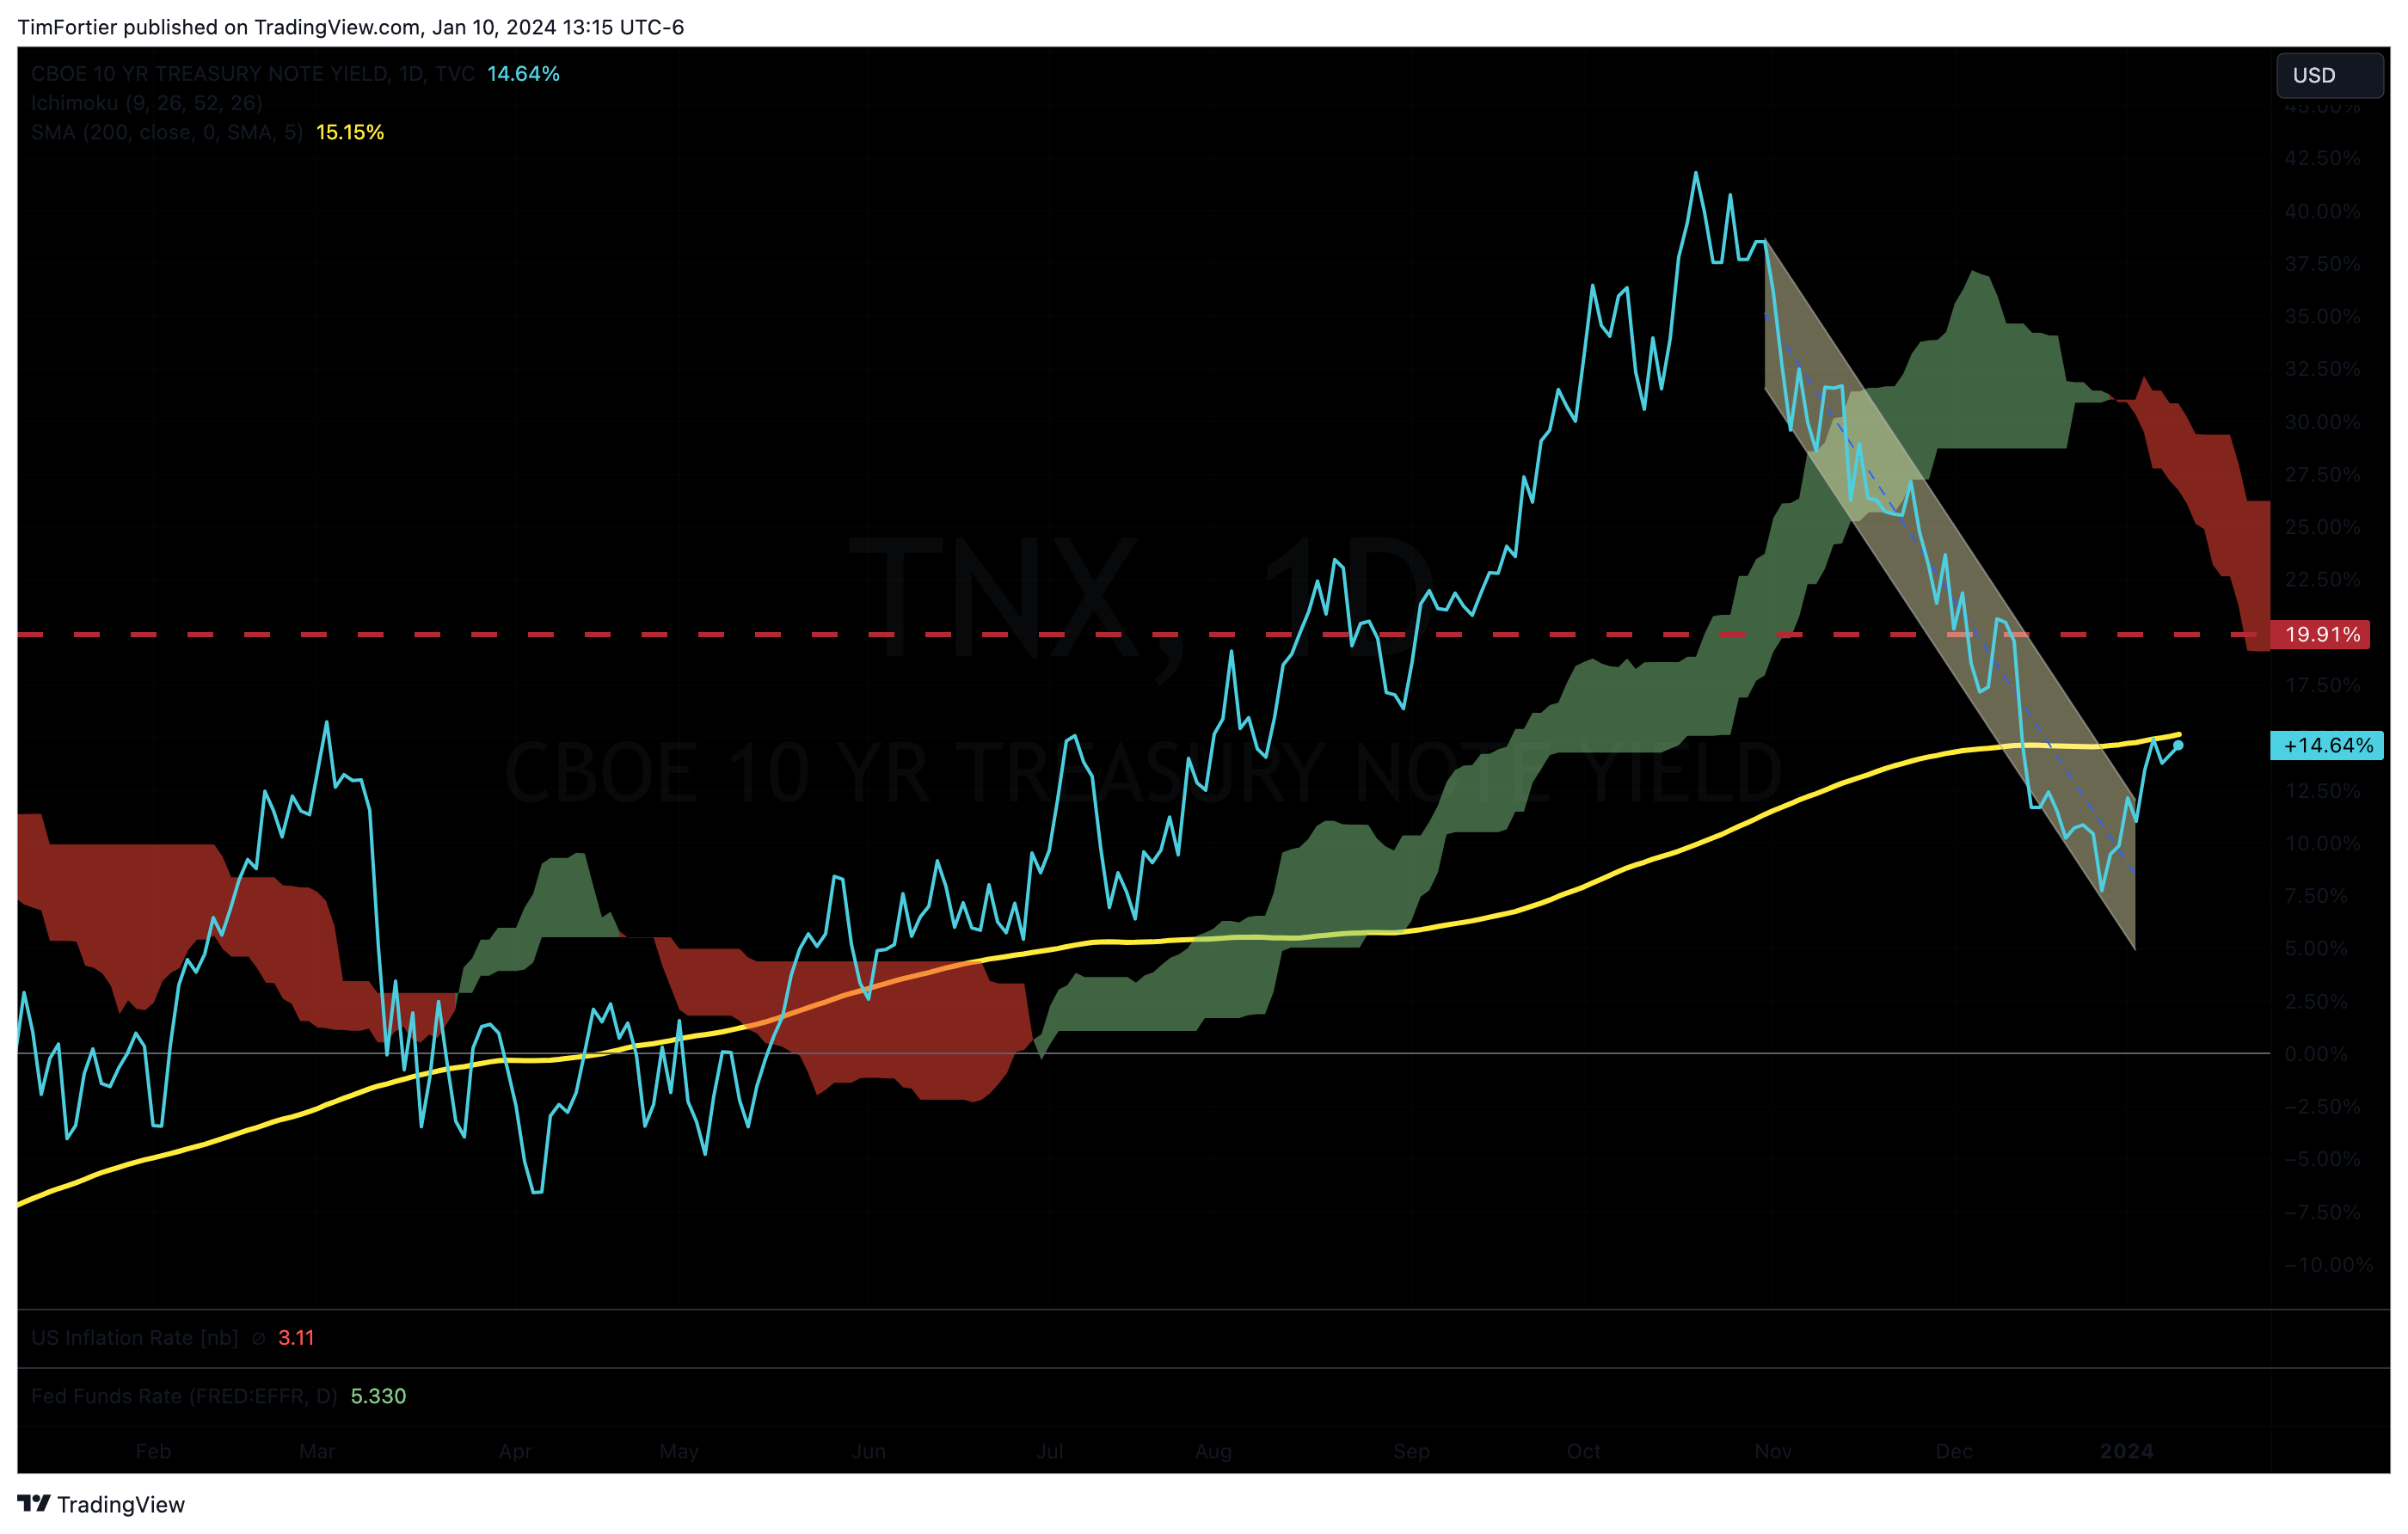
First, the yield on the Ten-Year U.S. Treasury is creeping up. This needs to be watched closely.
If yields settle back above the 200-day moving average then I think that the “higher for longer” narrative gains some strength, which will probably not be good for equities.
Second, yesterday, my timing tool built around the NYSE Bullish Percent gave a sell signal.
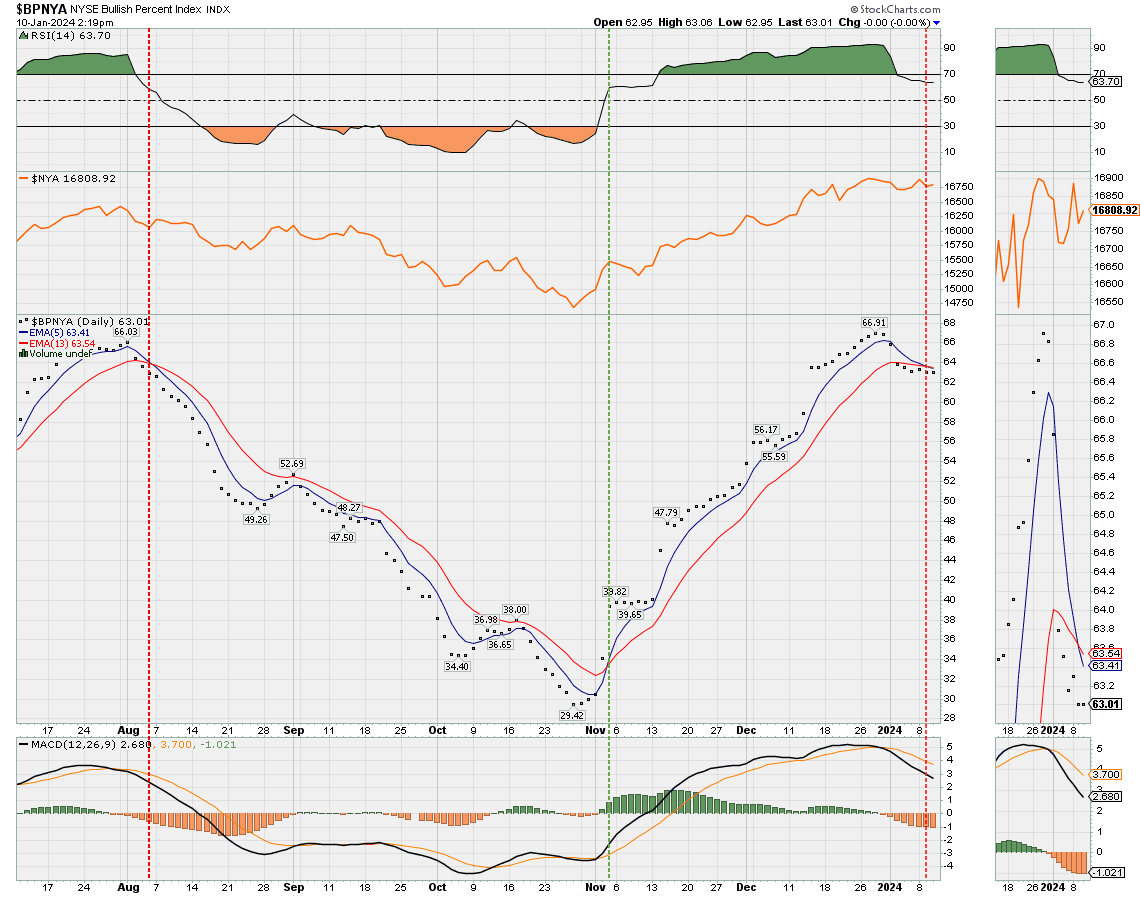
What I have observed this week is that despite the strong showing by the stock market on Monday, the market internals have indicated declining demand. So I am viewing this current move higher with some caution.
As I indicated in my issue last week, this could simply be the beginning of a badly needed correction that remains shallow.
We shall see.
If you have any questions or have been considering hiring an advisor, then schedule a free consultation with one of our advisors today. There’s no risk or obligation—let's just talk.
Tags

Free Guide: How to Find the Best Advisor for You
Get our absolutely free guide that covers different types of advisory services you'll encounter, differences between RIAs and broker-dealers, questions you’ll want to ask when interviewing advisors, and data any good financial advisor should know about you and your portfolio.
