
Related Blogs
January 5, 2024 | Tim Fortier
As we begin 2024, the market has pulled back and is currently -2.21% below the high set on the 28th of December.
On Thursday, the market closed below its 21-day moving average for the first time since the beginning of November.
In today’s issue, I’ll take a closer look at what some of my favorite indicators are telling me about what’s happening.
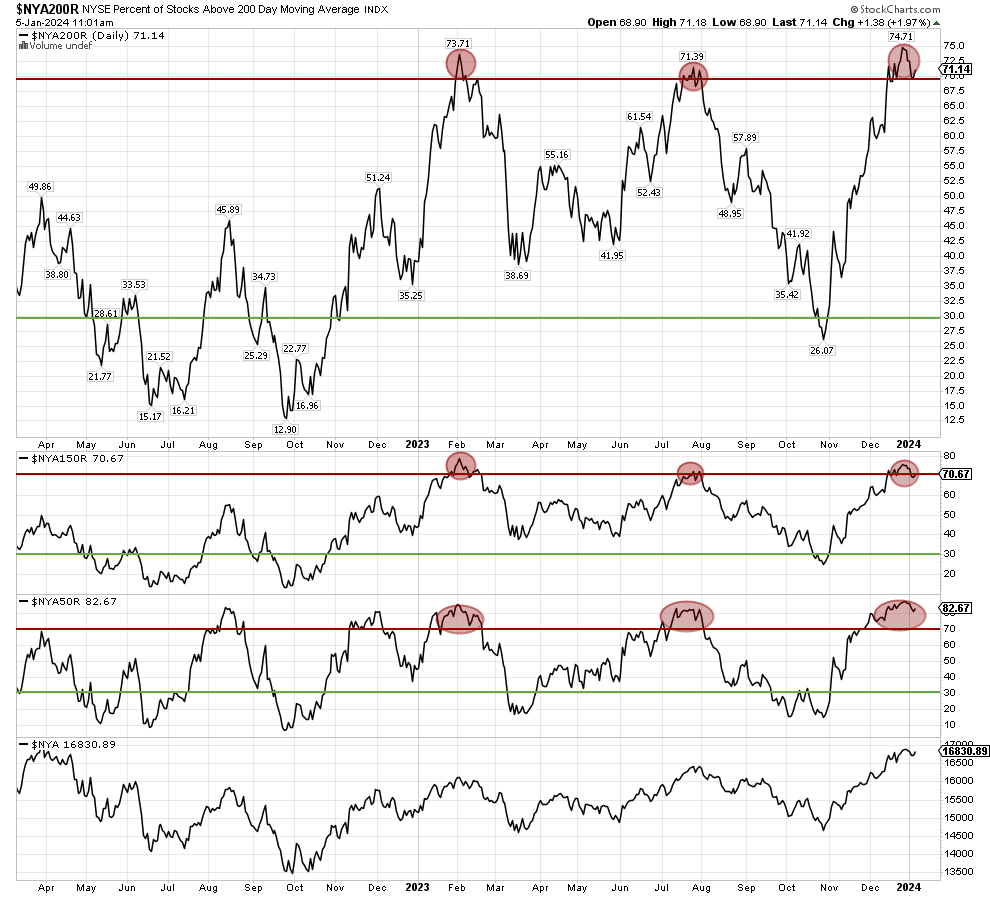
For the NYSE, let’s begin with the Percentage of Stocks Above the 200-day moving average.
The message is apparent – this indicator is at a level that has marked intermediate peaks with great accuracy.
This chart also shows data for the %150, and the %50, and in each instance, the message is the same: The market is at a level where a pullback should be expected.
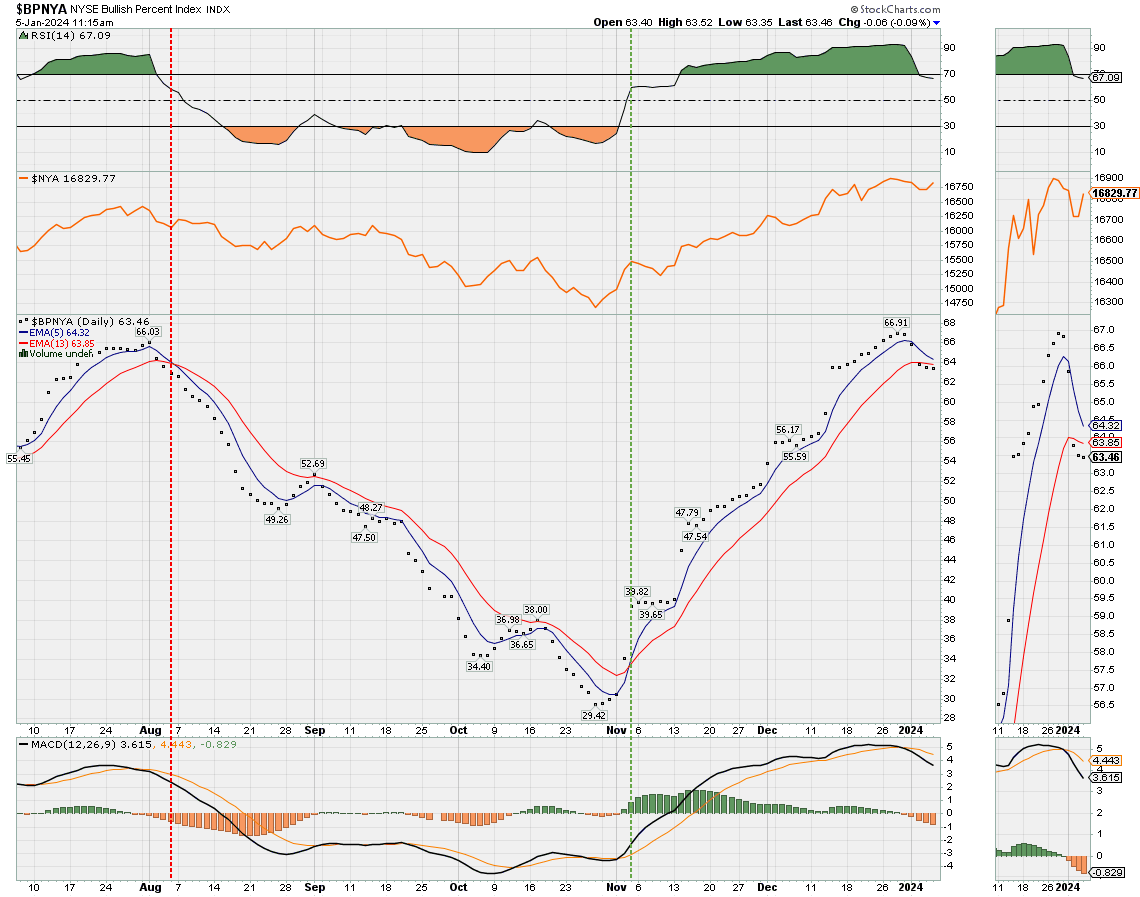
Now let’s look at my primary tool, the NYSE Bullish Percent, configured my way to generate actionable signals.
Not surprisingly, the recent selling is showing a weakening demand for equities.
While a signal is not yet official – it will only take a cross of the moving averages to do so – we are getting close.
However, when we look at the same indicator applied to the Nadaq 100, we can see that it is now on a sell signal as of January 2.
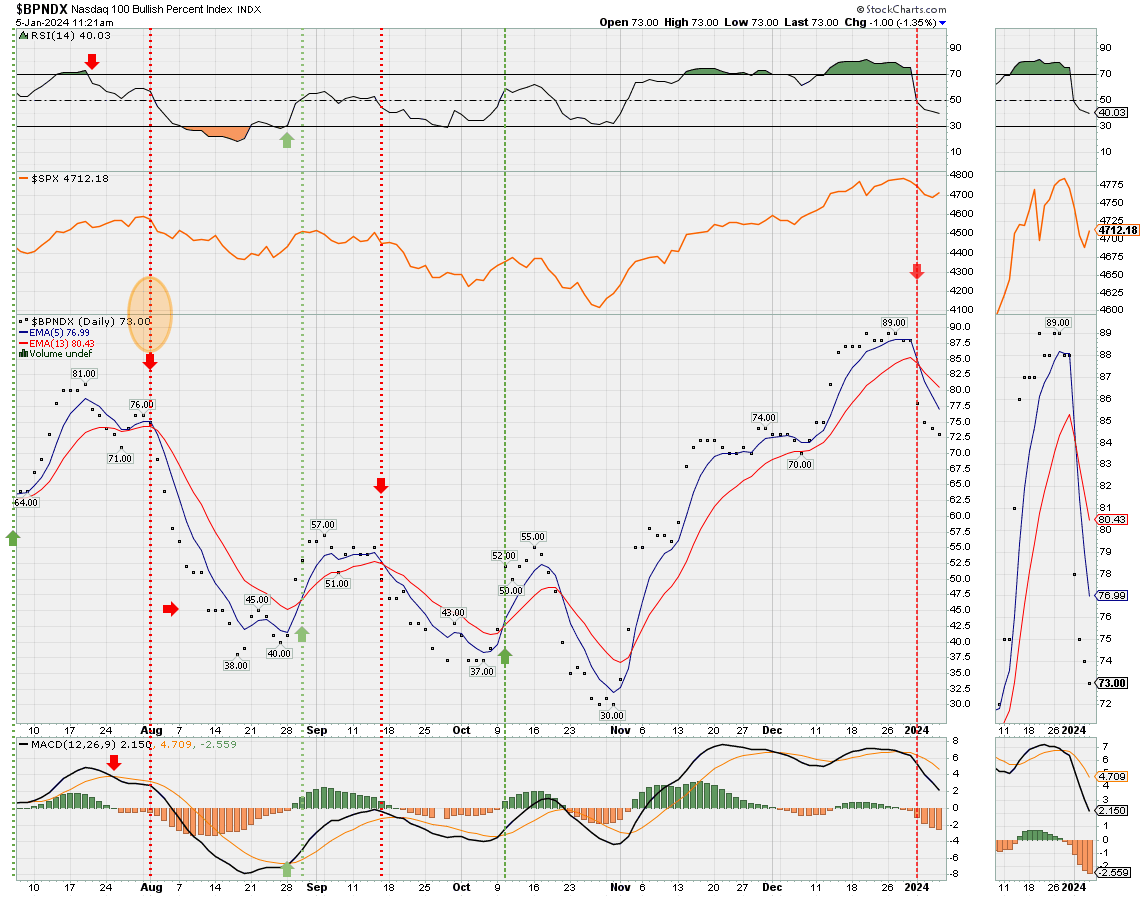
Given that the Nasdaq 100 advanced 20% from the October low with practically no interruption, and given the extreme levels of participation, it would be natural to see some selling take place at this time.
Further evidence for the extreme level of bullishness reached is displayed in this chart, which shows that U.S. equity futures positioning is currently as extreme as it was before the GFC and the volmageddon of early 2018.
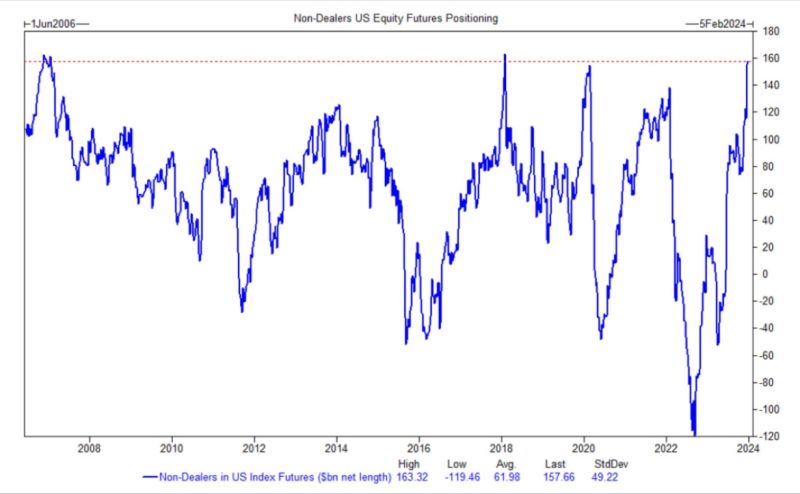
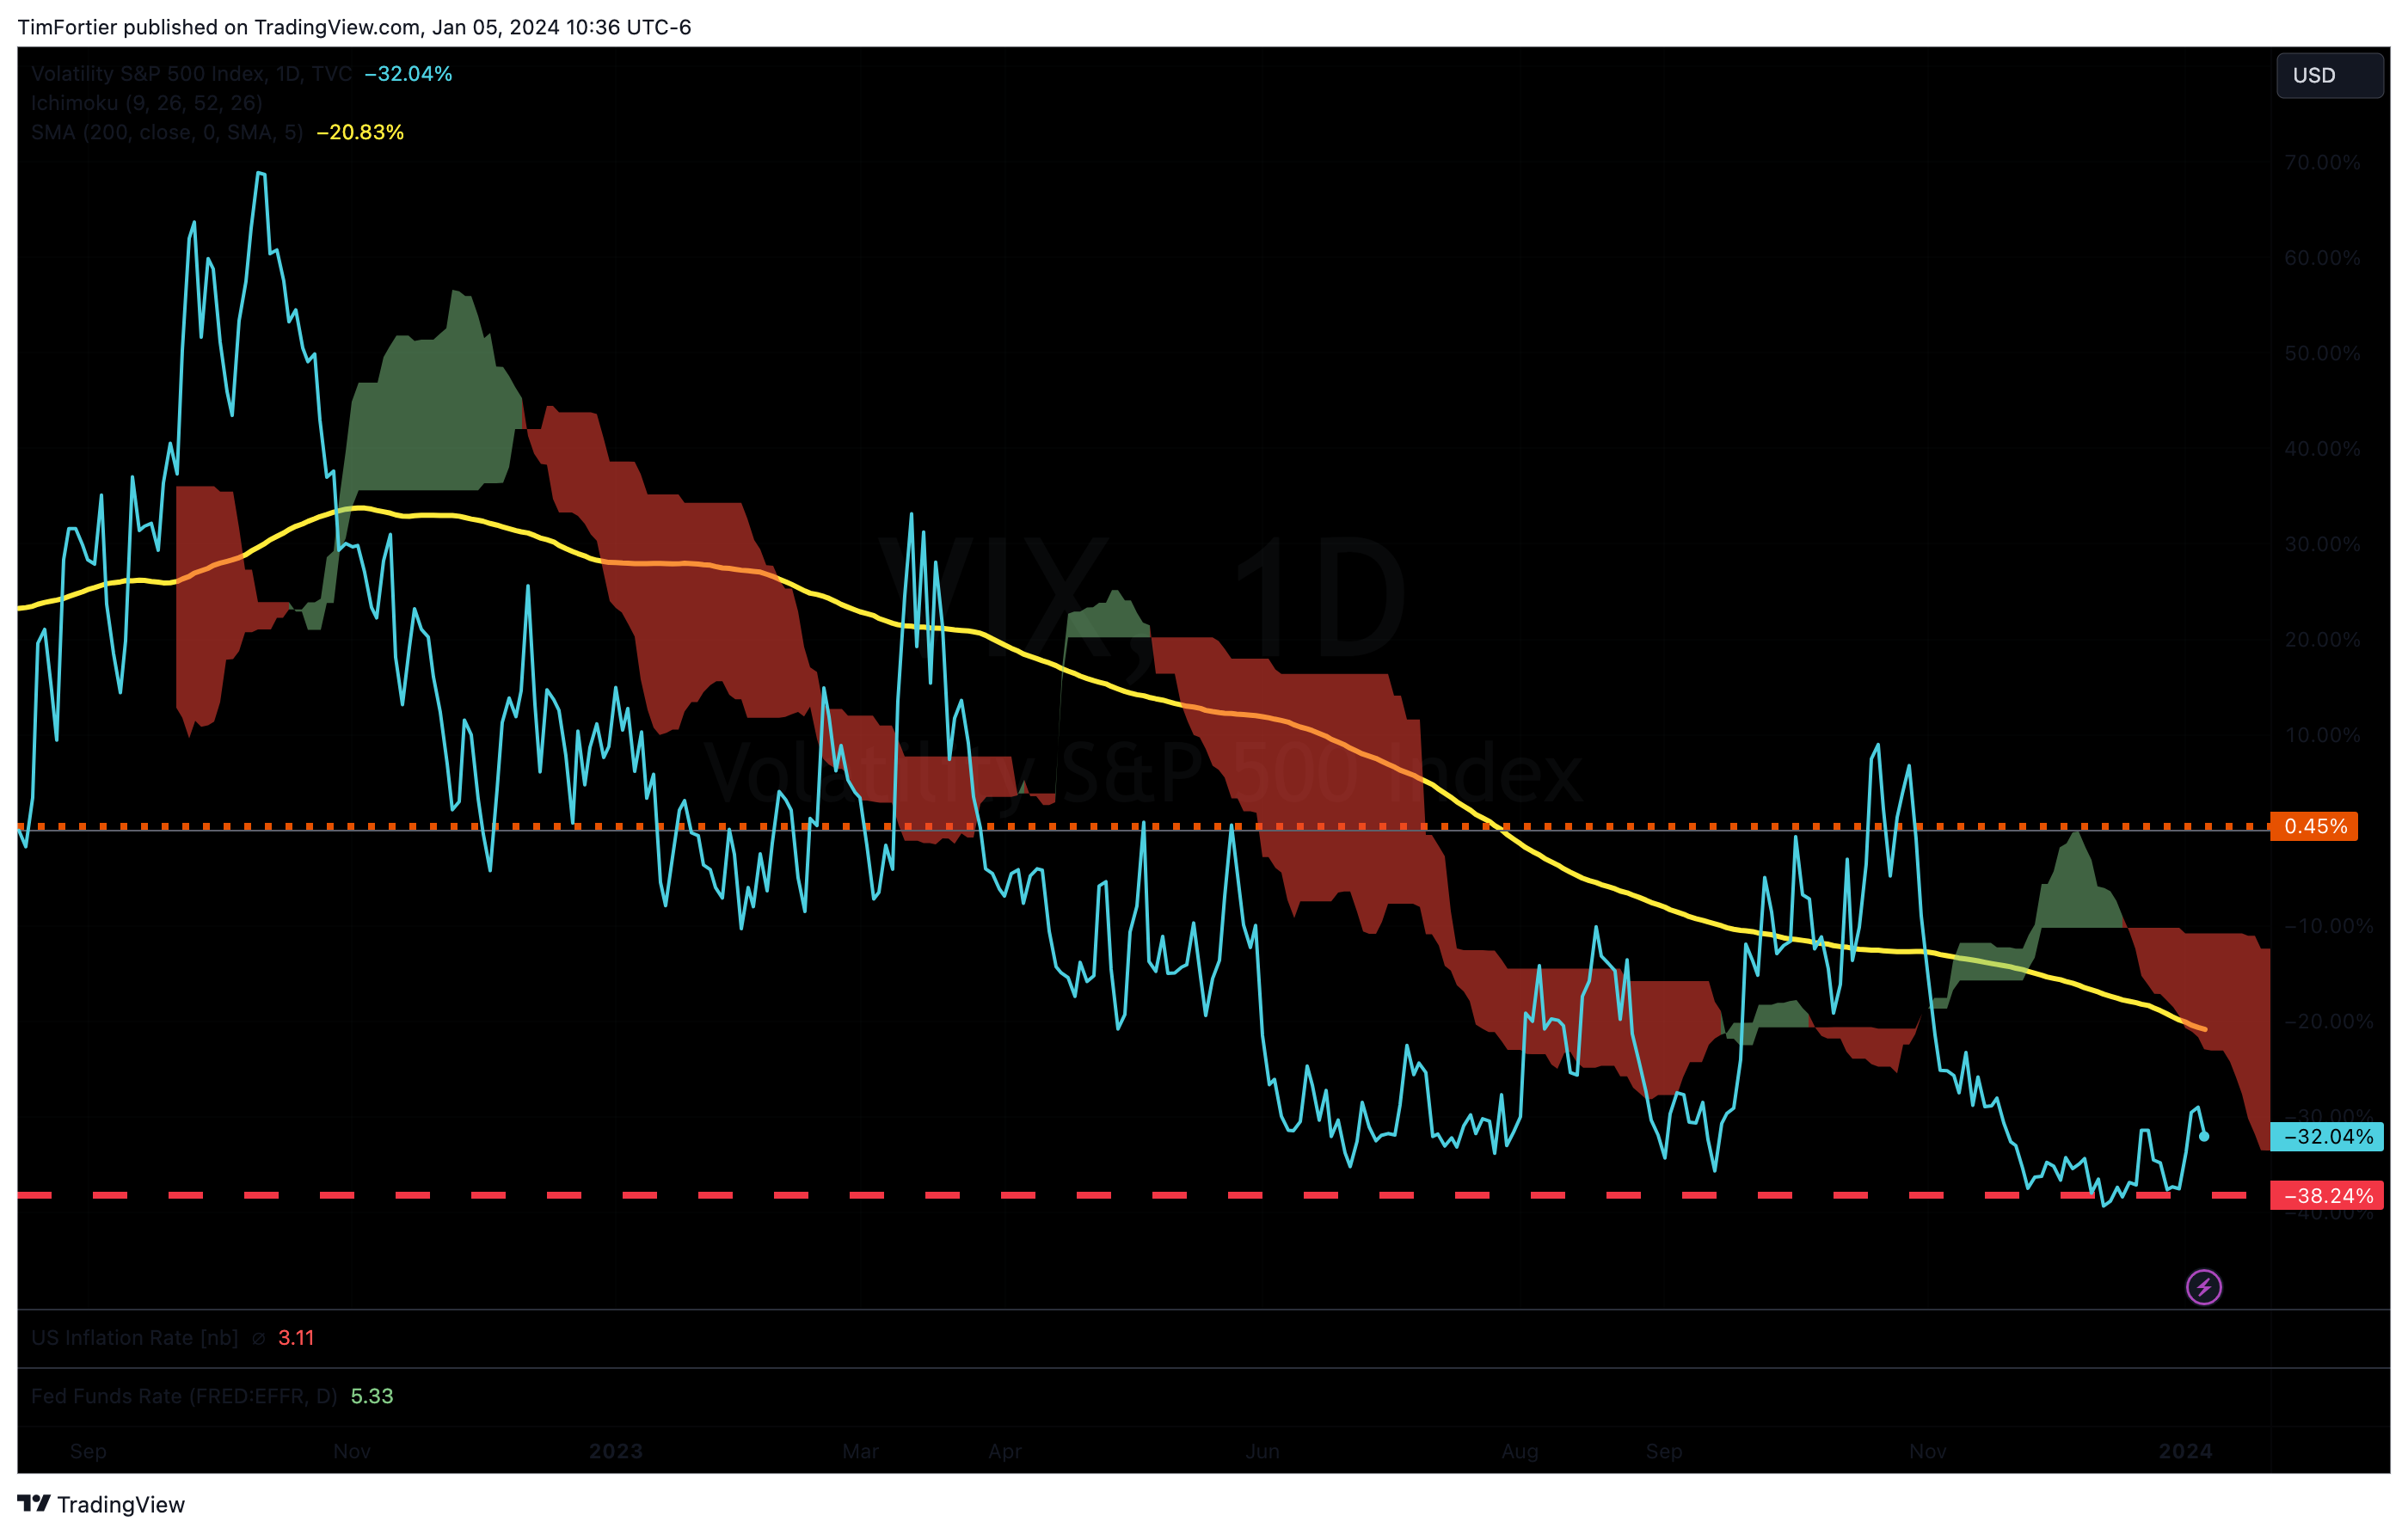
Couple this with the fact that short interest for the $SPY and $QQQ ETFs are near historical lows and that the VIX (see below) shows continued complacency, the setup is there for further selling.
So despite my cautious near-term view, my expectation at this time is that correction will be fairly shallow.
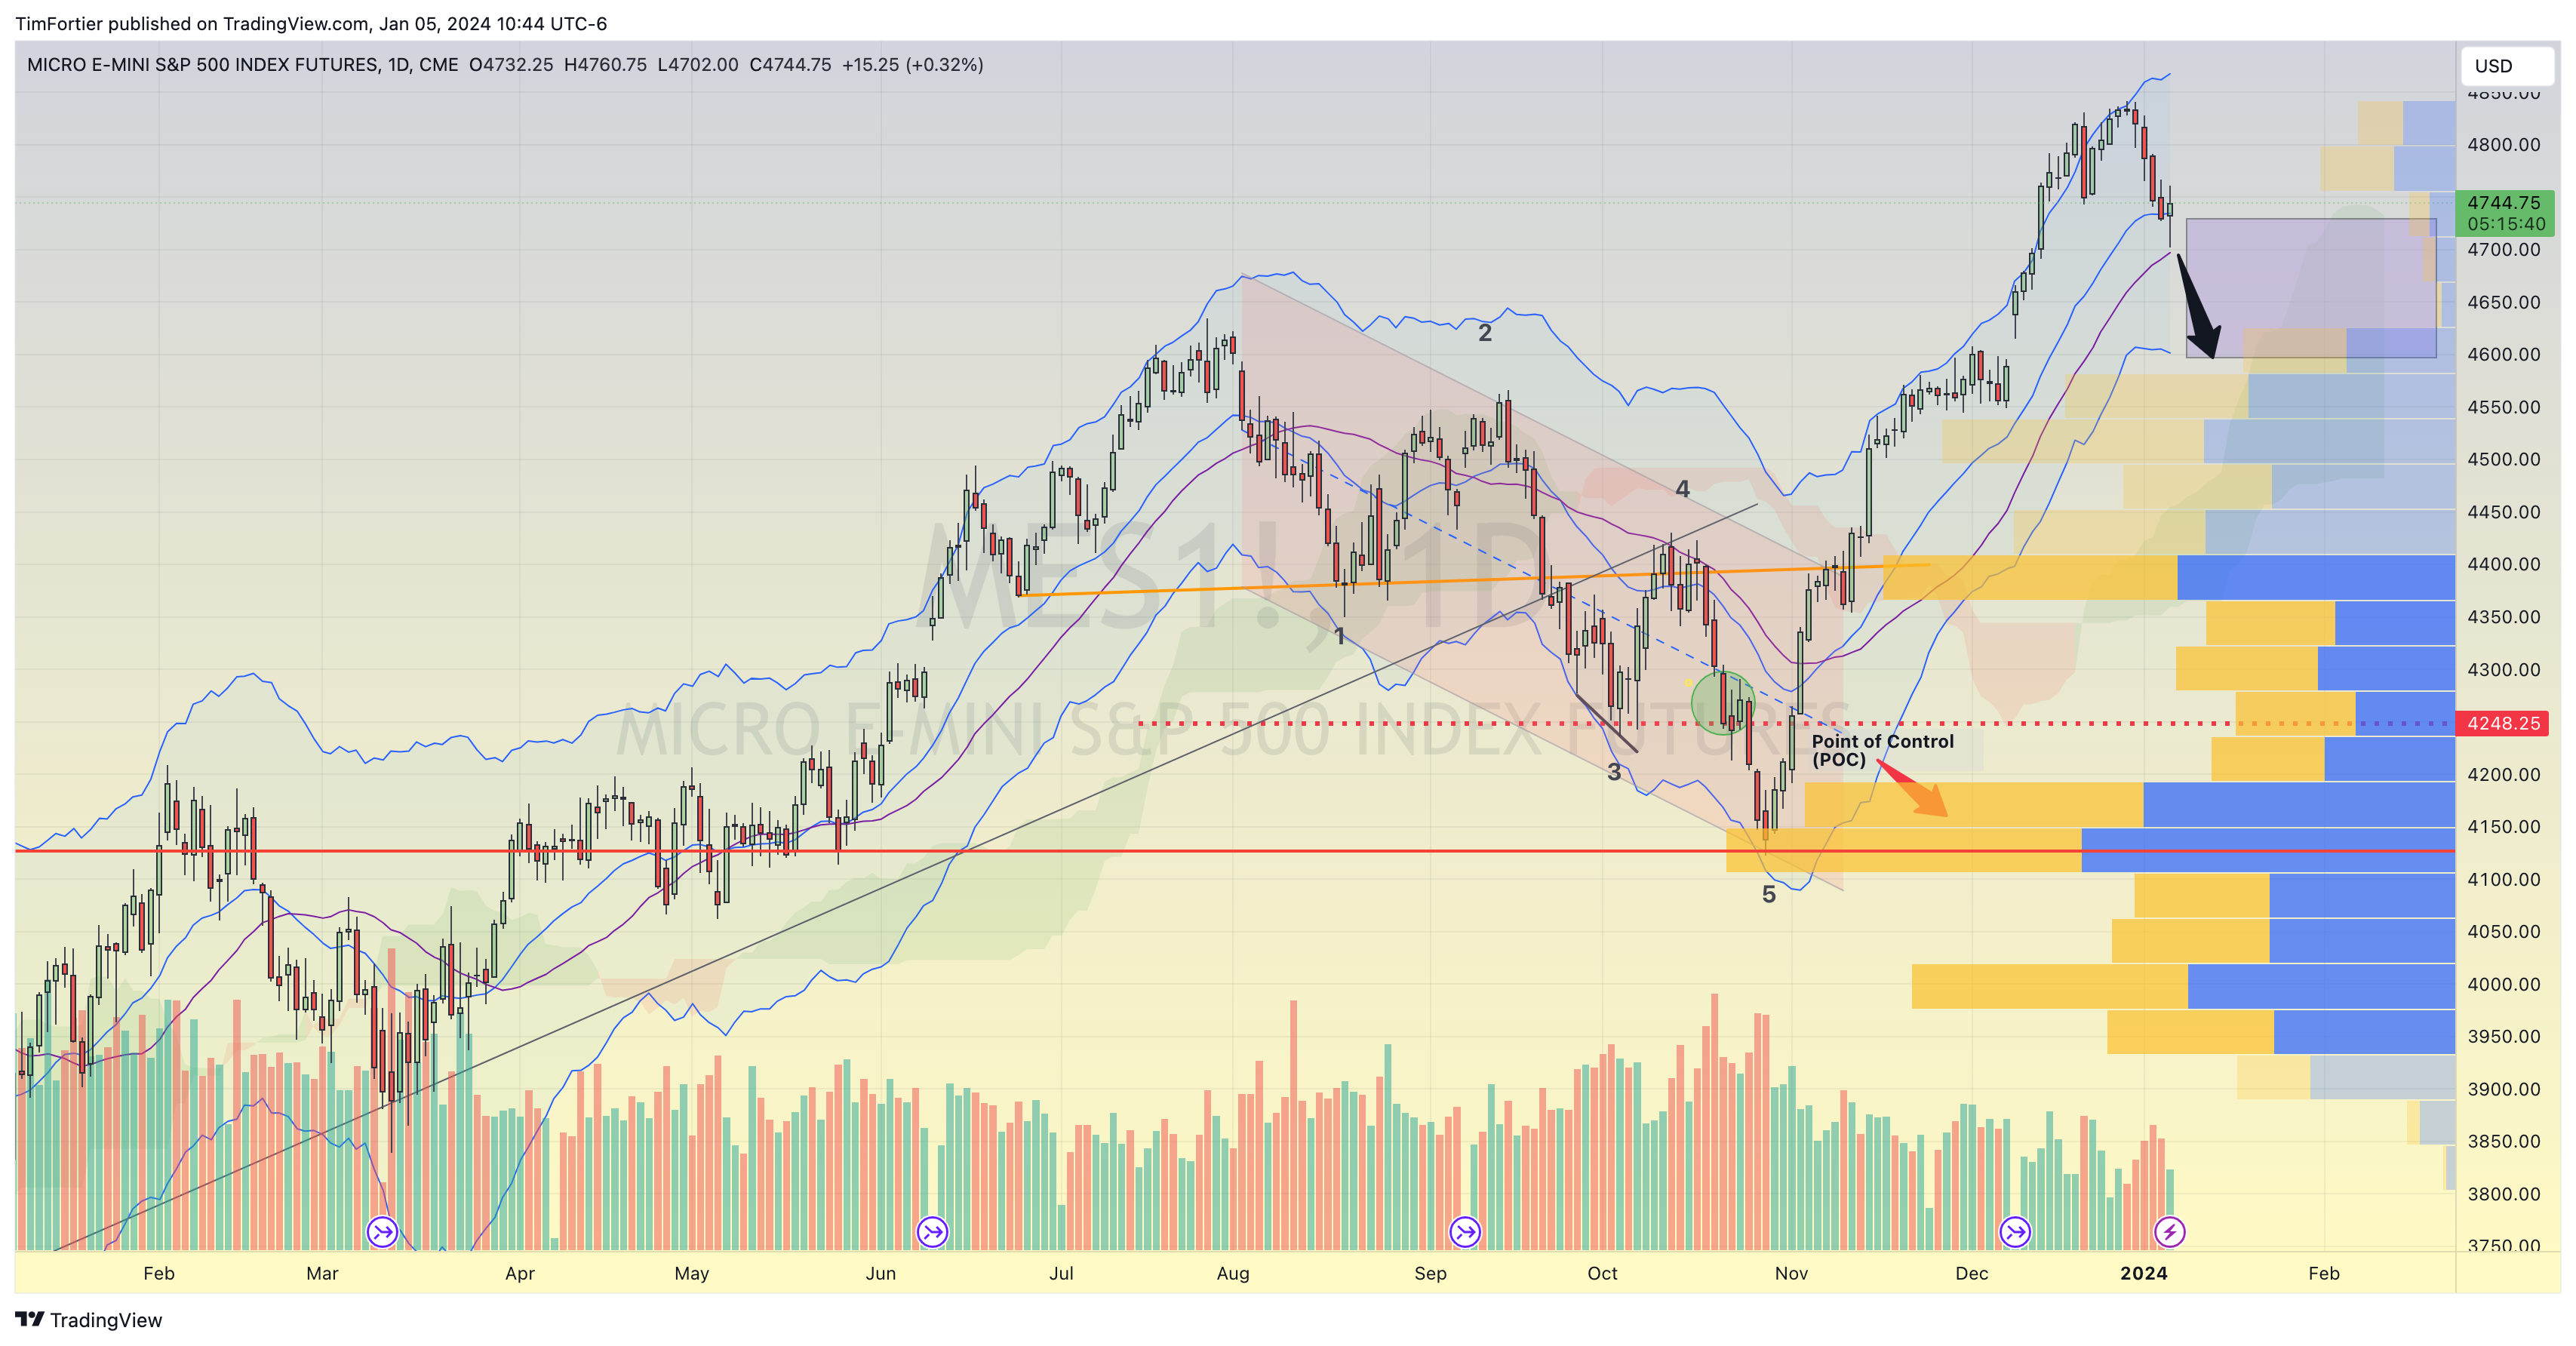
The chart below of the S&P 500 futures shows a big gap in the volume profile (the purple-shaded box) which is where the price is currently.
In my experience, price will not hold in these areas and will move to levels with significant volume (thus importance).
That level right now is in the 4550-4600 range.
Interest rates will of course continue to play a dominant role for stocks.
The recent Fed minutes suggest a “wait and watch” and “higher for longer” period than what many stock investors were hoping for.
Adding to this is today’s employment number which showed wage growth way above expectation.
Good news is now bad news as this could fuel the notion that the Fed will indeed stay with the “higher for longer” narrative.
Looking at the U.S. Ten-Year rate, it might be a little premature to call a reversal in the recent downtrend in rates, but this remains a very important chart that investors should be paying attention to.
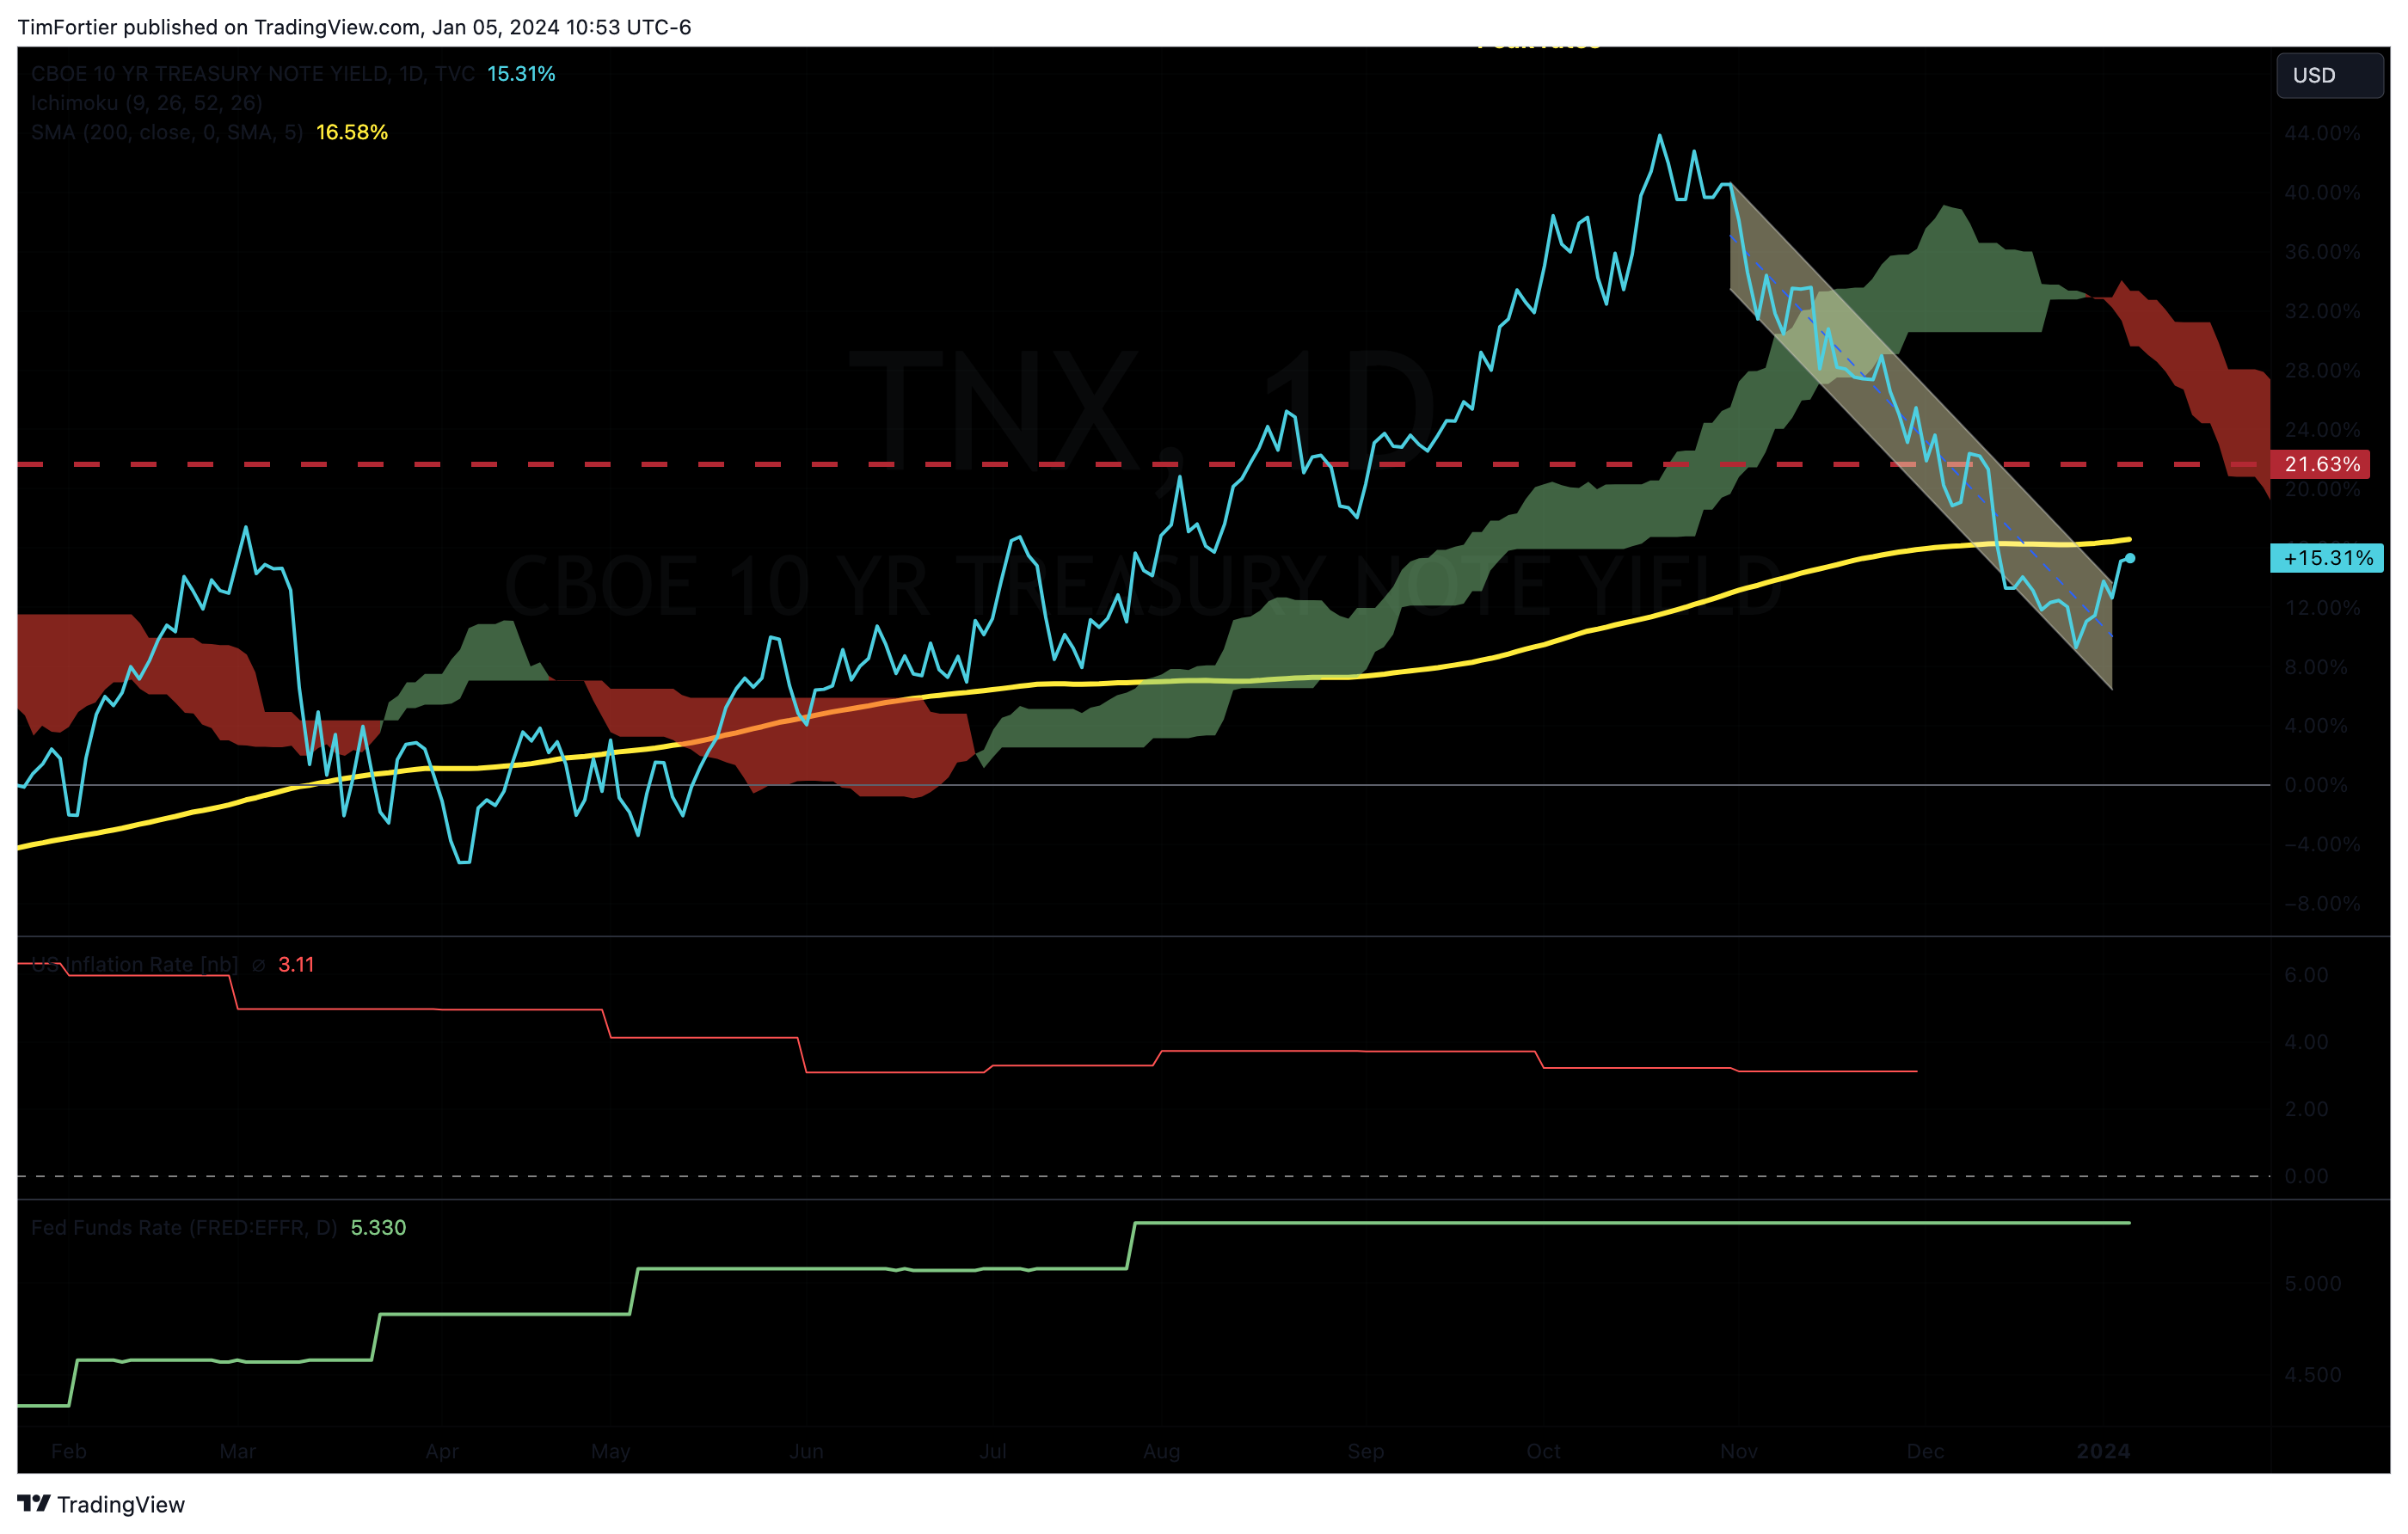
With the rapid increase in the U.S. debt, now $34 trillion, I remain concerned that supply and demand issues will play a factor in determining yields in the coming months.
Safe investing.
If you’re thinking about hiring a financial advisor to navigate the ever-changing markets, schedule a free consultation with one of our experienced team members. We’re currently accepting new clients with investment portfolios valued at $1,000,000 or more, or $200,000 or more if you already have an advisor. There’s no risk in exploring if we’re the right fit for your financial goals. Contact us today.

Tags

Get Our FREE Guide
How to Find the Best Advisor for You
Learn how to choose an advisor that has your best interests in mind. You'll also be subscribed to ADAPT, Avalon’s free newsletter with updates on our strongest performing investment models and market insights from a responsible money management perspective.
