
Related Blogs
January 21, 2022 | Avalon Team
 Welcome to week three of my series, The Death of 60/40.
The 60/40 Strategy is ubiquitous in the investment industry, but will likely fail to deliver future returns that are substantial enough to match most investor needs.
Last week I demonstrated how the historical returns for this strategy have been very dependent on the economic regime in play at the time.
Today, we’ll take a deeper look into the equity component of the 60/40 Portfolio and will discuss the current expectations for equity returns.
With 60% of the strategy allocated to stocks, stock market returns have been the strategy’s “muscle,” responsible for much of the overall return.
For purpose of analysis, I have constructed a portfolio composed of 60% Large Cap U.S. Stocks and 40% 10-Year Treasuries. My analysis period is from 1972 to 2021.
This period covers the inflationary 70s, the boom cycle of the 80s and 90s, and the various boom and bust cycles of the past 20 years.
From the beginning of 1972 to the end of 2021, $10,000 invested in this strategy produced a cumulative amount of $1,060,977 with a compound annual average return of 9.78%. Adjusted for inflation, the cumulative amount is only $156,405 or 5.65% CAGR.
Of this total cumulative amount, stocks produced $835,794 while bonds provided $215,183. In other words, stocks have provided nearly 79% of the overall return.
Additionally, in studying risk attributes to the portfolio, we discover that the 60% stock allocation is attributed to nearly 88% of the risk within the portfolio.
Because of the dominance of equities within this strategy, it’s vitally important to have a realistic expectancy for the future returns of stocks.
From last week’s discussions of historical returns, we know that the period 1982–2000 was the single best period only to be followed the single worst period of the “lost decade”.
My approach will be to examine stock market valuations at the beginning of each of those periods and then to compare them to the current market valuations.
NOTE: I am going to spend a little be of time providing some background information to help explain my main point. I will be breaking that into two segments to be continued next week.
Stock Market Valuations – Part 1
There are many different means to measure a stock’s valuation. Individual stocks can be measured on a Price/Earnings, Price/Cash Flow, Price/Sales, Dividend Yield, or a Price/Book Value.
P/E ratios are a cornerstone of fundamental stock valuation analysis and are most commonly looked at for individual firms. The P/E ratio is a ratio of a stock price divided by the firm’s yearly earnings per share.
The same analysis can be done on the entire stock market. By adding up the price of every share in the S&P 500, and comparing that to the sum of all earnings-per-share generated by those companies, you can easily calculate the P/E ratio of the US stock market.
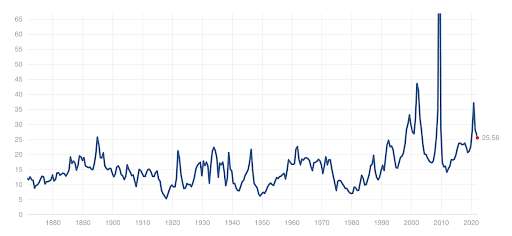
For instance, currently, the trailing 12 months of earnings for the S&P 500 is $178.24.
The current P/E is 25.56 (as of 1/19/2022)
If we take the current P/E x Earnings, we arrive at the current level of the S&P 500 Index ($178.24 X 25.56 = 4,555)
Historically, the P/E has averaged about 16, fluctuating between a low of 5.31 (December 1917) and a high of 123.71 (May 2009 – the P/E was so high because reported earnings declined significantly during the Great Financial Crisis).
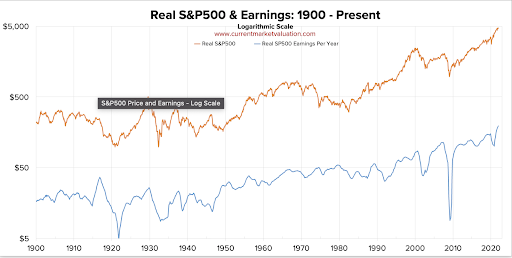
There has been a clear relationship between earnings and price as both have steadily risen over time.
If we were to apply the “average” P/E ratio to the current earnings of the S&P 500, the index level would be 1,979 or about 44% lower!
I am not suggesting that S&P Index is heading to 1,979. I am only demonstrating that the multiple applied is extremely important.
It would be easy to predict the level of the S&P IF the multiple remained constant. Then, if we had a reasonable estimate for earnings, we could easily multiply to arrive at our price target.
If it was only that easy. Unfortunately, it’s not.
The multiple applied is determined by prevailing interest rates, investor sentiment, the macro environment, and of course, earnings to name a few of the important factors.
An important point to take away from this discussion is that a stock’s price can move higher just on multiple expansions alone. A stock with $1/per share in earnings at 15 multiple is priced at $15/share. Take the exact same company and give it a 30 multiple and the stock is now priced at $30, even though it hasn’t sold any more goods or services than the $15 dollar stock.
It’s just the multiple that is different (hang in there, I promise this is all coming together).
On January 1, 1982, at the beginning of the best period ever, the earnings for the S&P 500 were $45.56.
On December 31, 2000, earnings stood at $80.12 representing a 76% increase in earnings.
In the same period, the S&P increased from 133 to 1335.63 representing a 9X increase!
It wasn’t entirely earnings that drove prices higher.
When we examine more closely, the starting P/E on January 1, 1982, was 7.73.
One has to remember that interest rates at that time were 14.59% and investors’ confidence was quite low having had the recent experience of the 1970s stagflation.
As interest rates steadily fell and investor confidence increased, so too did the multiple that investors were willing to pay for earnings.
By the end of 2000, the P/E ratio stood near 30, up almost 4X from where it began nearly two decades earlier.
While earnings had risen during this period, so too did the P/E multiple and this accounted for the majority of stock market gains!
Read that last sentence again.
On December 31, 2010, earnings for the S&P 500 had increased to $98.39 yet investors who had bought and held the index for the prior 10 years had nothing to show for it.
This was because the P/E had contracted to 20.70 as investors had just been battered with the dot.com crash and the financial crisis of 2008–2009. It would take two more years for the P/E to bottom out and begin to cycle higher.
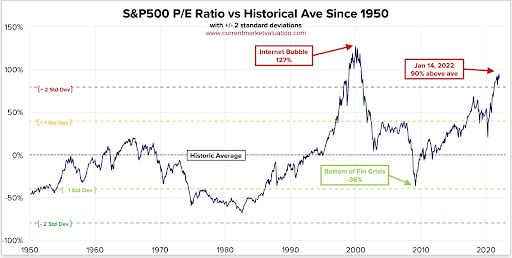
The chart below smooths earnings and adds overlays showing the modern-era average (arithmetic mean) P/E value of 19.8 (baselined as 0%), as well as horizontal bands showing +/- standard deviation bands. As of January 14, 2022, the S&P 500 P/E ratio is 90% higher than its modern era average.
What we can glean from this information is that the single best era began with a historically low P/E ratio which allowed for both earnings growth and P/E expansion.
The “Lost Decade” began with a P/E ratio that was historically high – over two standard deviations above the historical average. This led to a period where the market went nowhere for nearly 12 years. Even though earnings did manage to grow some, it wasn’t enough to compensate for the contraction in the P/E multiple.
Which brings us to today, where we find ourselves facing a similar extreme high valuation reading.
I will conclude my outlook for stocks next week in Part 2 of “Starting Valuations Matter… A Lot,” where I will examine a variety of other valuation metrics that all bode similar warnings to investors.
If you have any questions or have been considering hiring an advisor, then schedule a free consultation with one of our advisors today. There’s no risk or obligation—let's just talk.
Tags

Free Guide: How to Find the Best Advisor for You
Get our absolutely free guide that covers different types of advisory services you'll encounter, differences between RIAs and broker-dealers, questions you’ll want to ask when interviewing advisors, and data any good financial advisor should know about you and your portfolio.
