
Related Blogs
September 14, 2023 | Avalon Team
At the beginning of 2022, I wrote a series, “The Death of 60/40.” The thesis was pretty simple. Real yields on bonds were negative, stocks were richly valued by historical measure, and the Fed had unleashed a monetary storm resulting in rising inflation.
My conclusion that traditional stock and bond portfolios, especially passive index portfolios, would suffer was an easy one.
In today’s article, I will examine what has happened since publishing the series and, more importantly, what we can expect today.
First, a quick review.
We will begin with interest rates.
Real rates (the return minus inflation) turned negative in early 2020, where they remained until late April 2022.
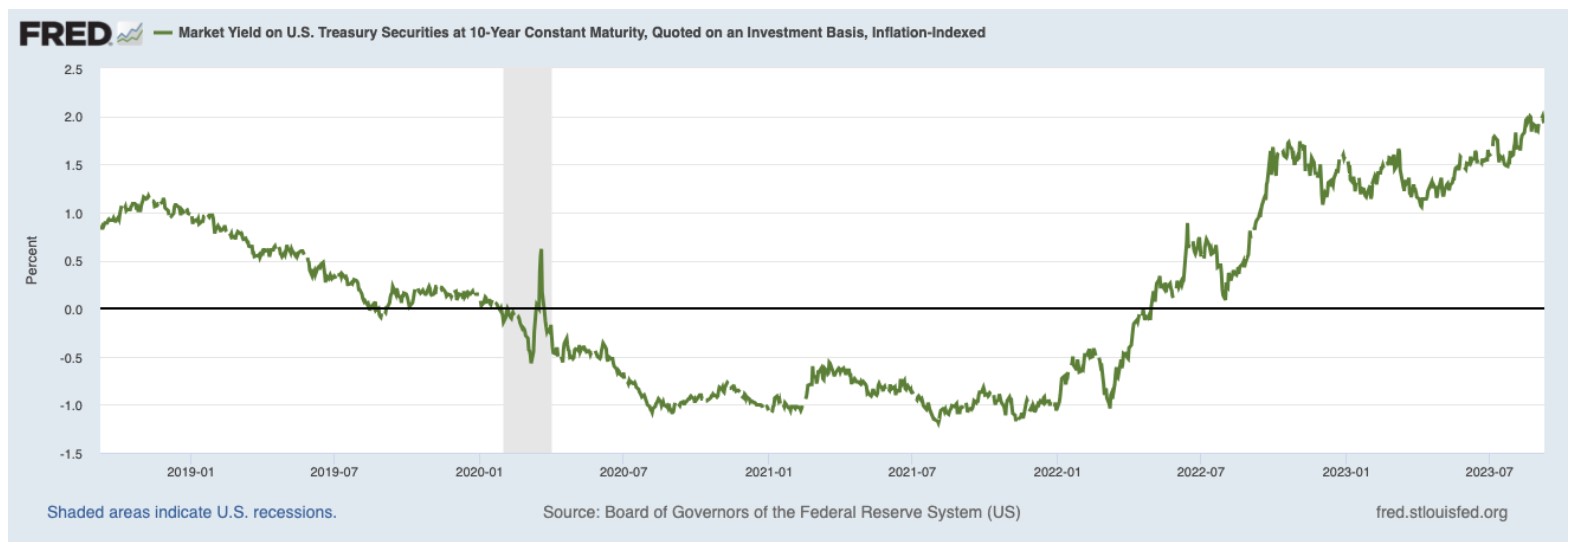
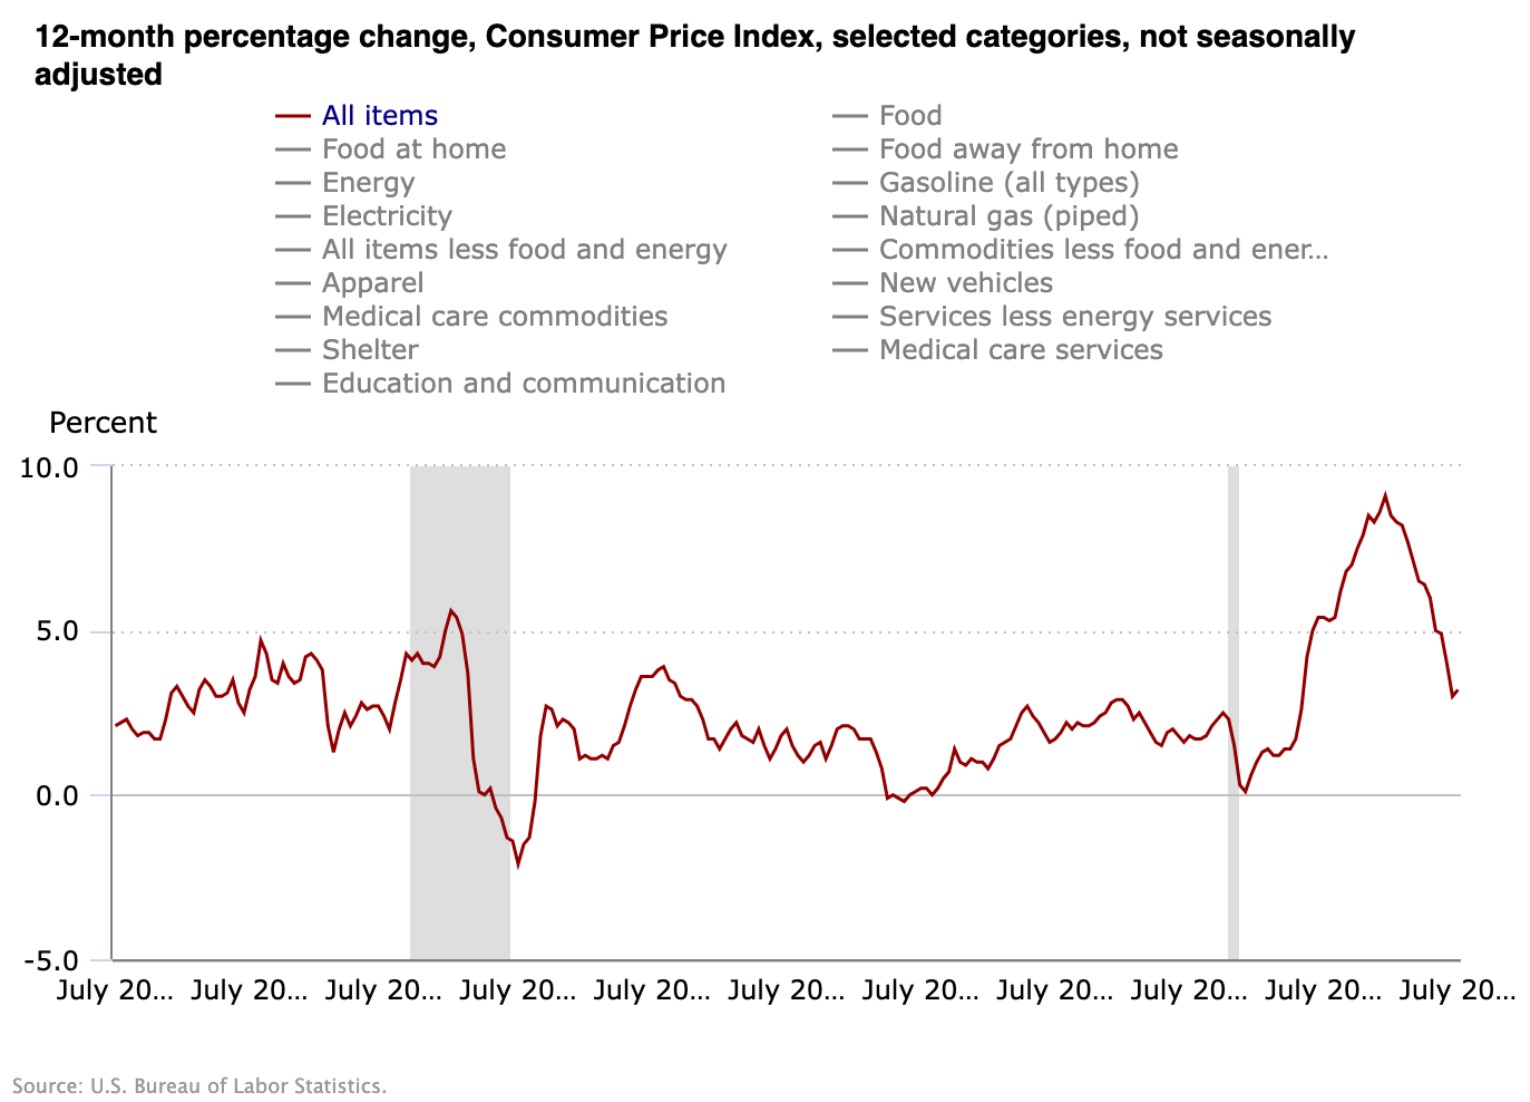
This coincided with a surge in inflation that began in 2020 and would eventually see the annual increase in inflation surge to over 9% by June of 2022.
With the Federal Reserve in near panic mode, they pushed rates up faster than at any time in history, sending bond prices lower.
Last year was one of the worst ever for a diversified portfolio of stocks and bonds.
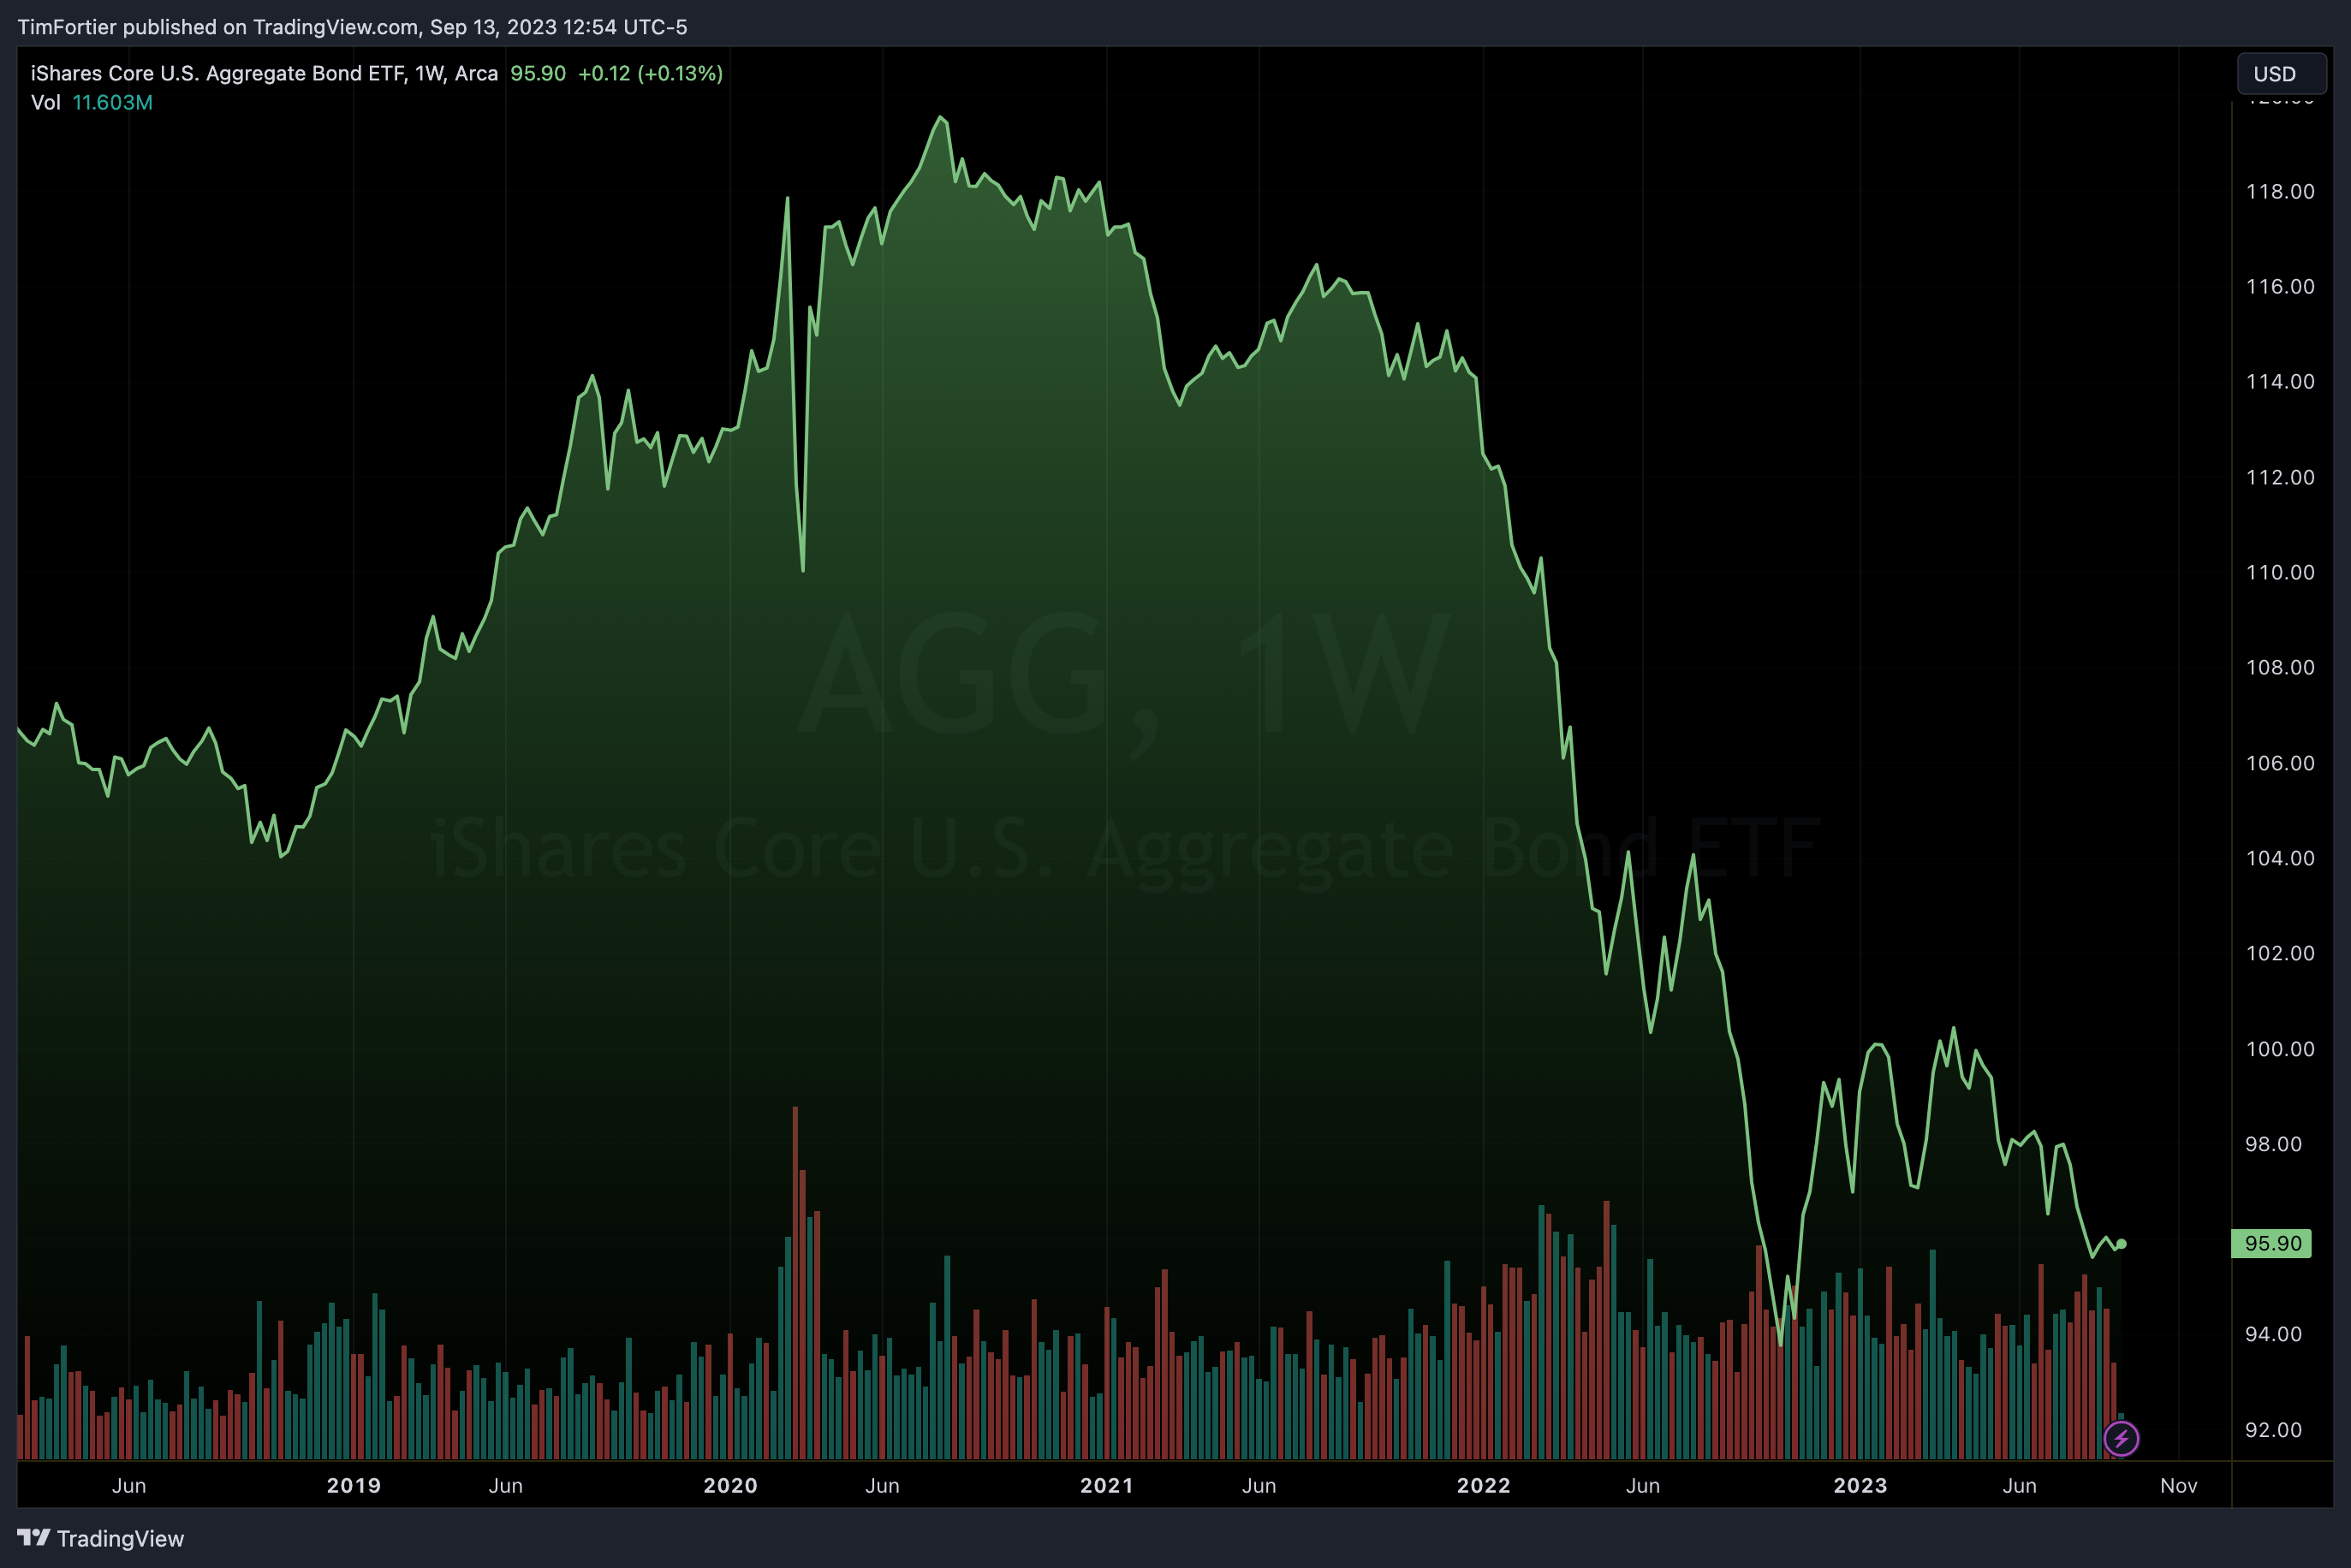
Bonds got massacred and caused the stock market to sell off as well.
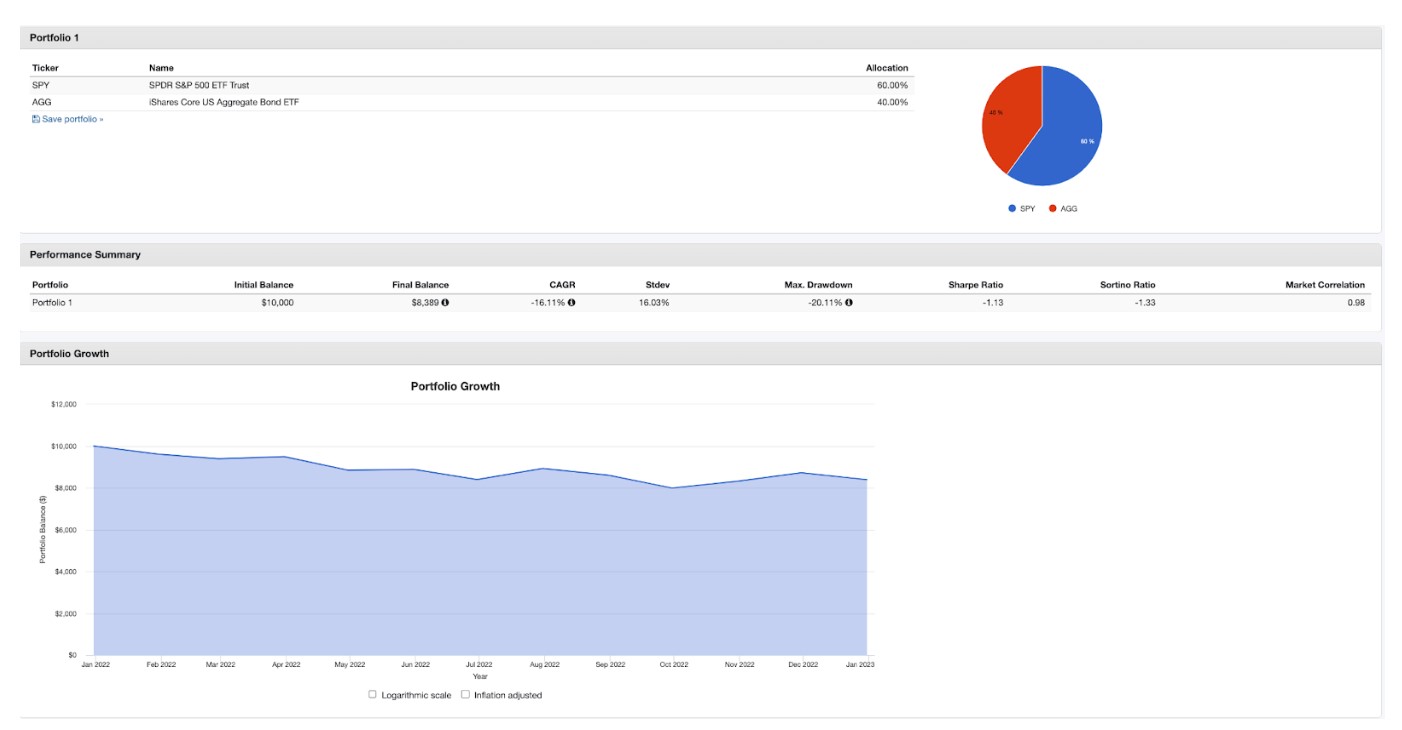
The following chart of the Aggregate Bond Index (AGG), a common fixed income benchmark, tells the story… price declined by -21.5% from the peak to the low.
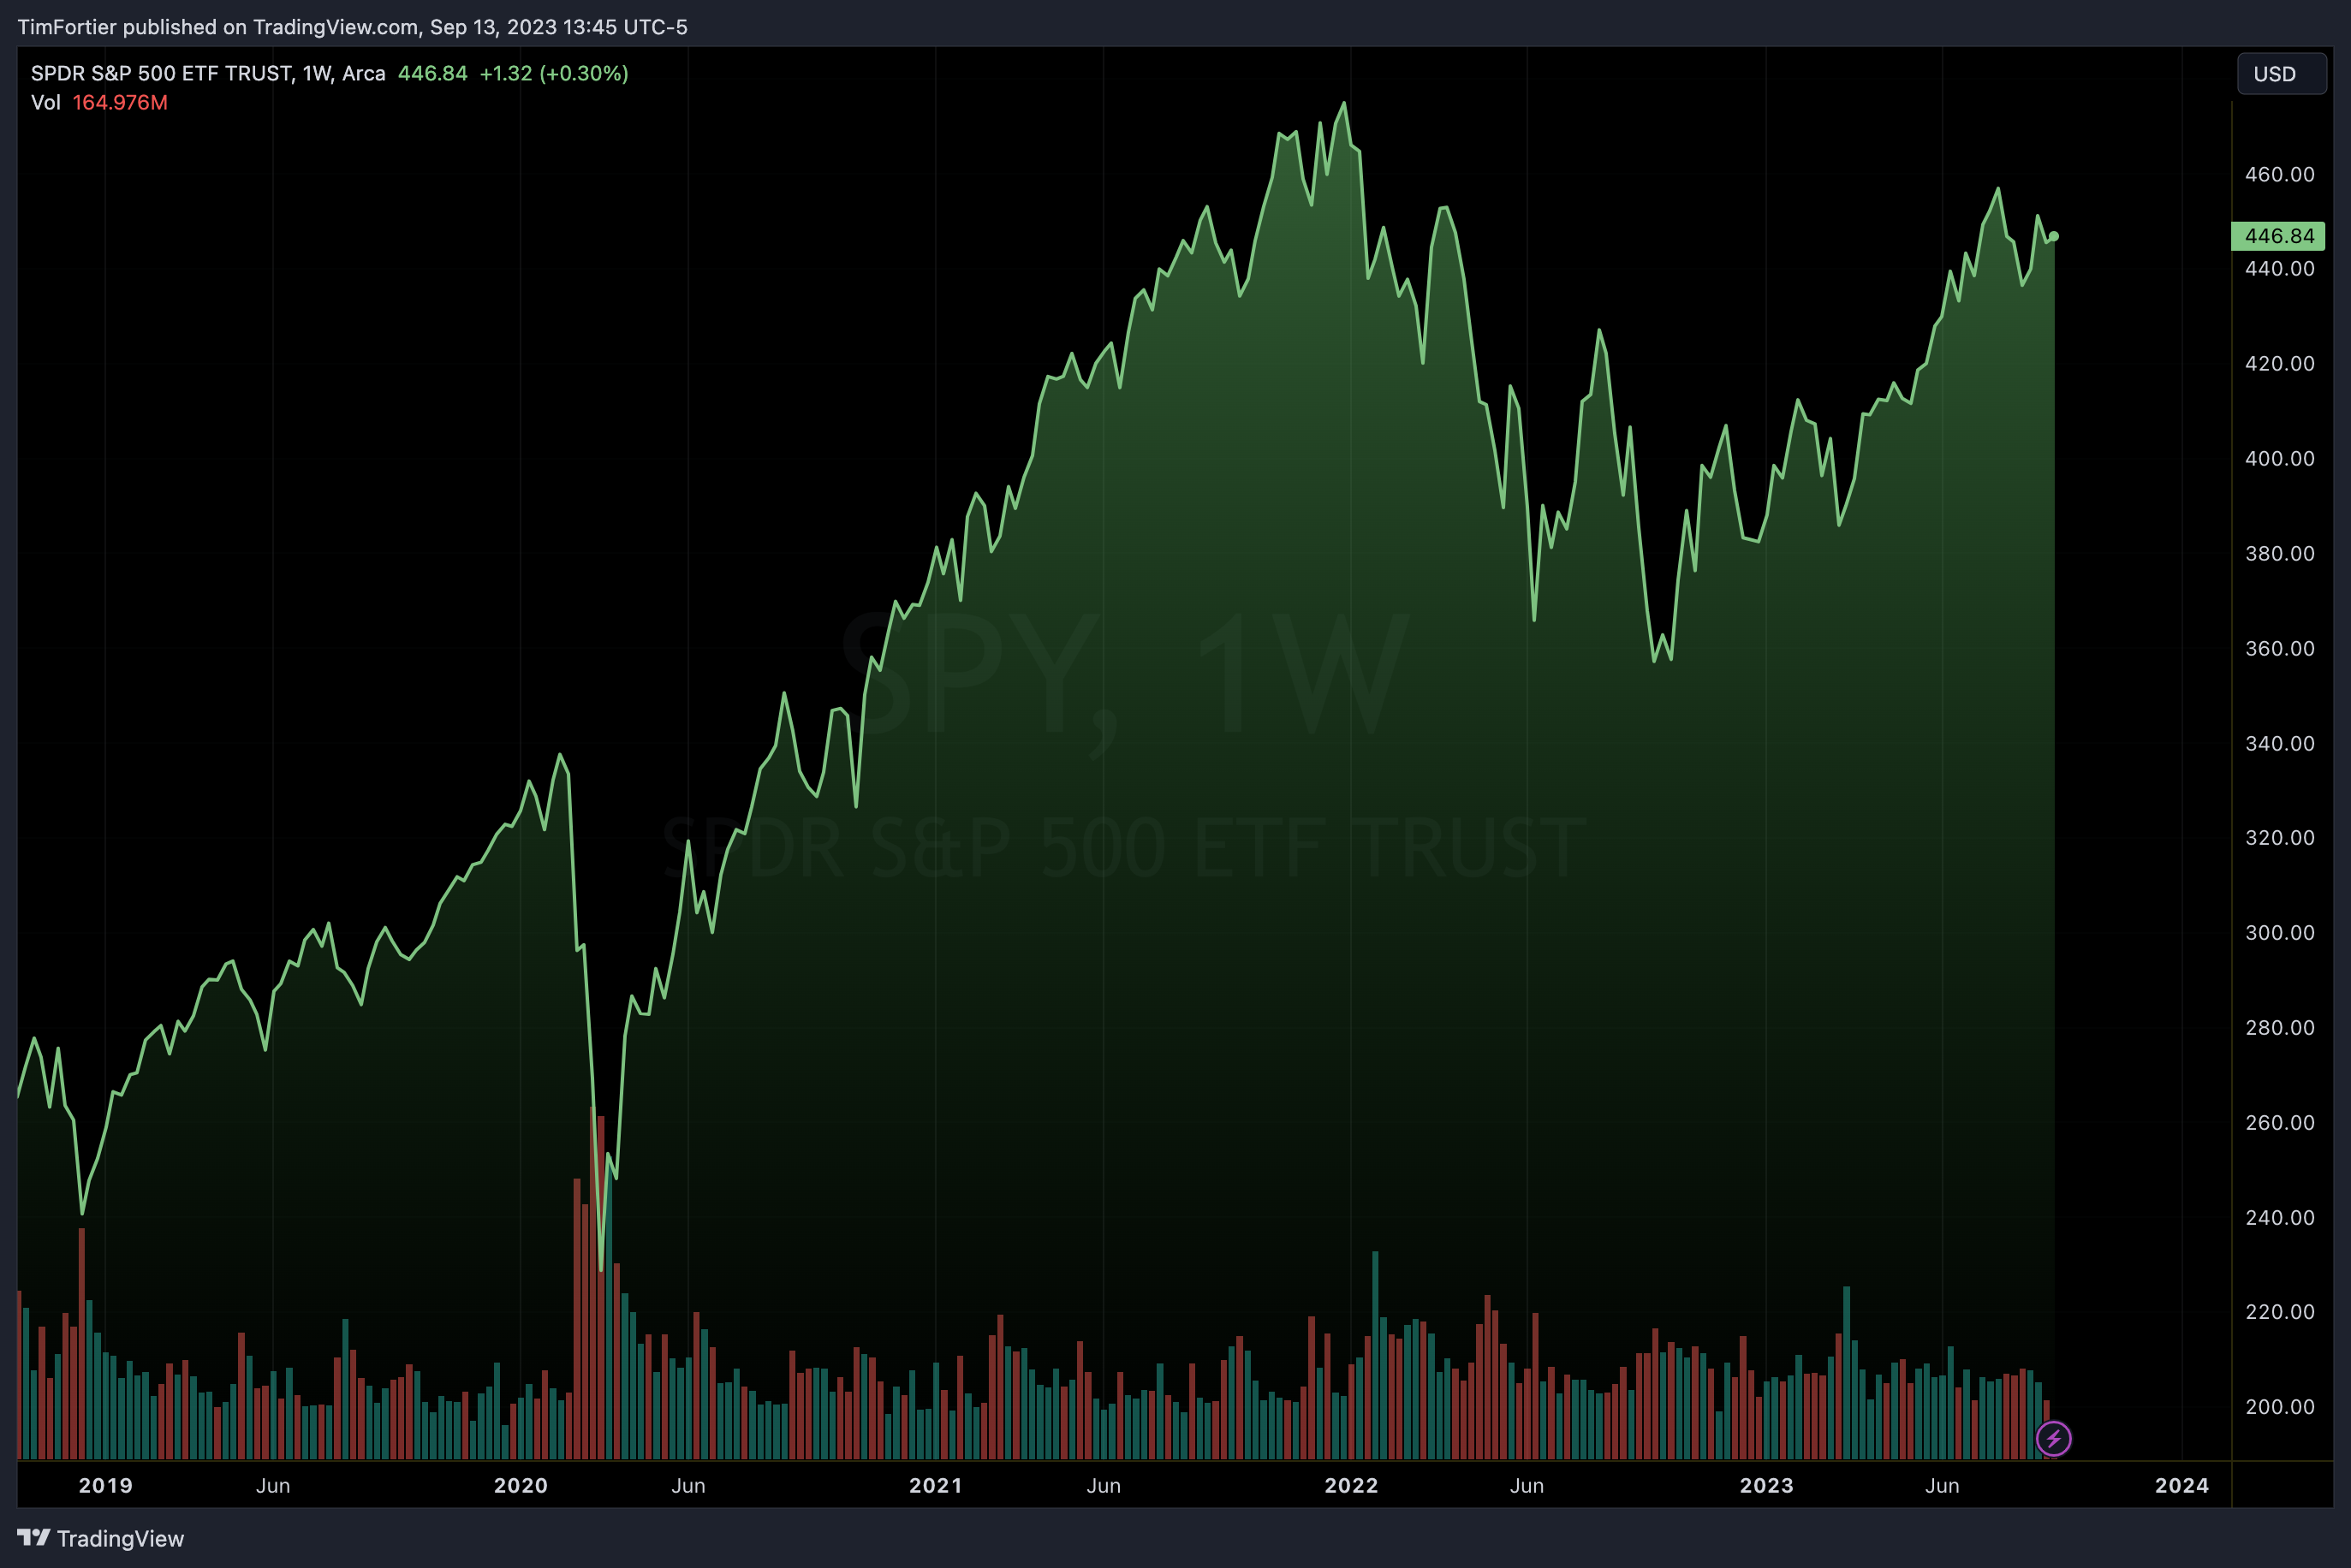
Stocks, sensitive to the rising interest rates, also declined as this chart of the S&P 500 SPDR (SPY) shows and as investors know all too well. From peak to low, SPY lost about -24%.
The combined 60/40 portfolio suffered one of its worst years with a loss of nearly -17% for the 2022 calendar year.
Hold on.
Haven’t investors been told that stocks and bonds are uncorrelated and that bonds are supposed to provide safety when stocks go down?
One of the most important lessons for investors of 2022 is that correlations among asset classes can and do change. What investors witnessed in 2022 was a regime change.
The prior 40 years had been disinflationary with falling interest rates.
That all changed in 2022 when both rates began to rise along with inflation.
Below you’ll see the effect of different stock-bond correlations to a 60/40 portfolio:
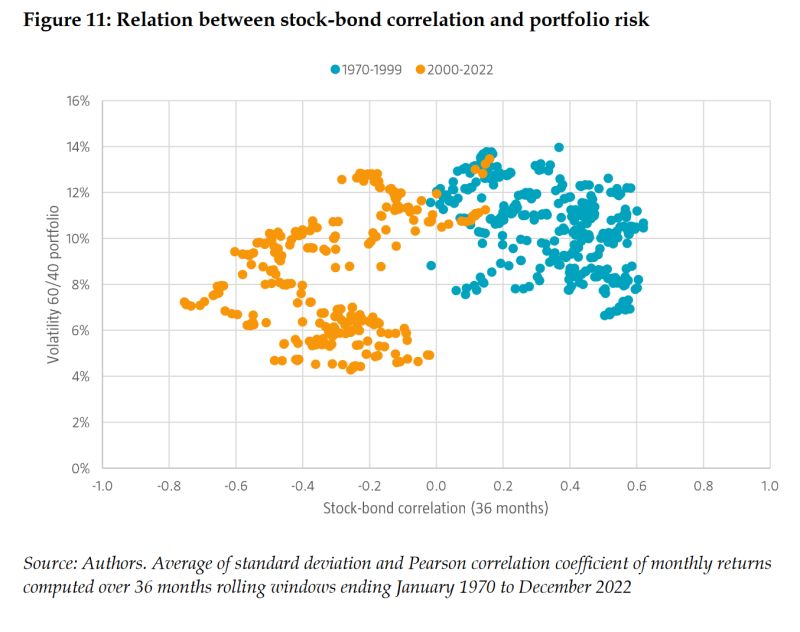
The orange dots (2000-2022: -0.31) represent the negative correlation regime we all got used to.
The blue dots represent the positive correlation regime (1970-1999: +0.35) that we forgot about… One that could dominate markets in the coming decade(s).
Also notice that positive correlation regimes also show higher, overall portfolio volatility (the left axis).
So what now?
Inflation is currently 82% of the way back to the Fed’s target. The bump in the August headline CPI was caused by one thing – gasoline.
While the annualized inflation rate has shown improvement, rates have remained near their recent highs as this chart of the Ten-Year Treasury Note yield demonstrates.
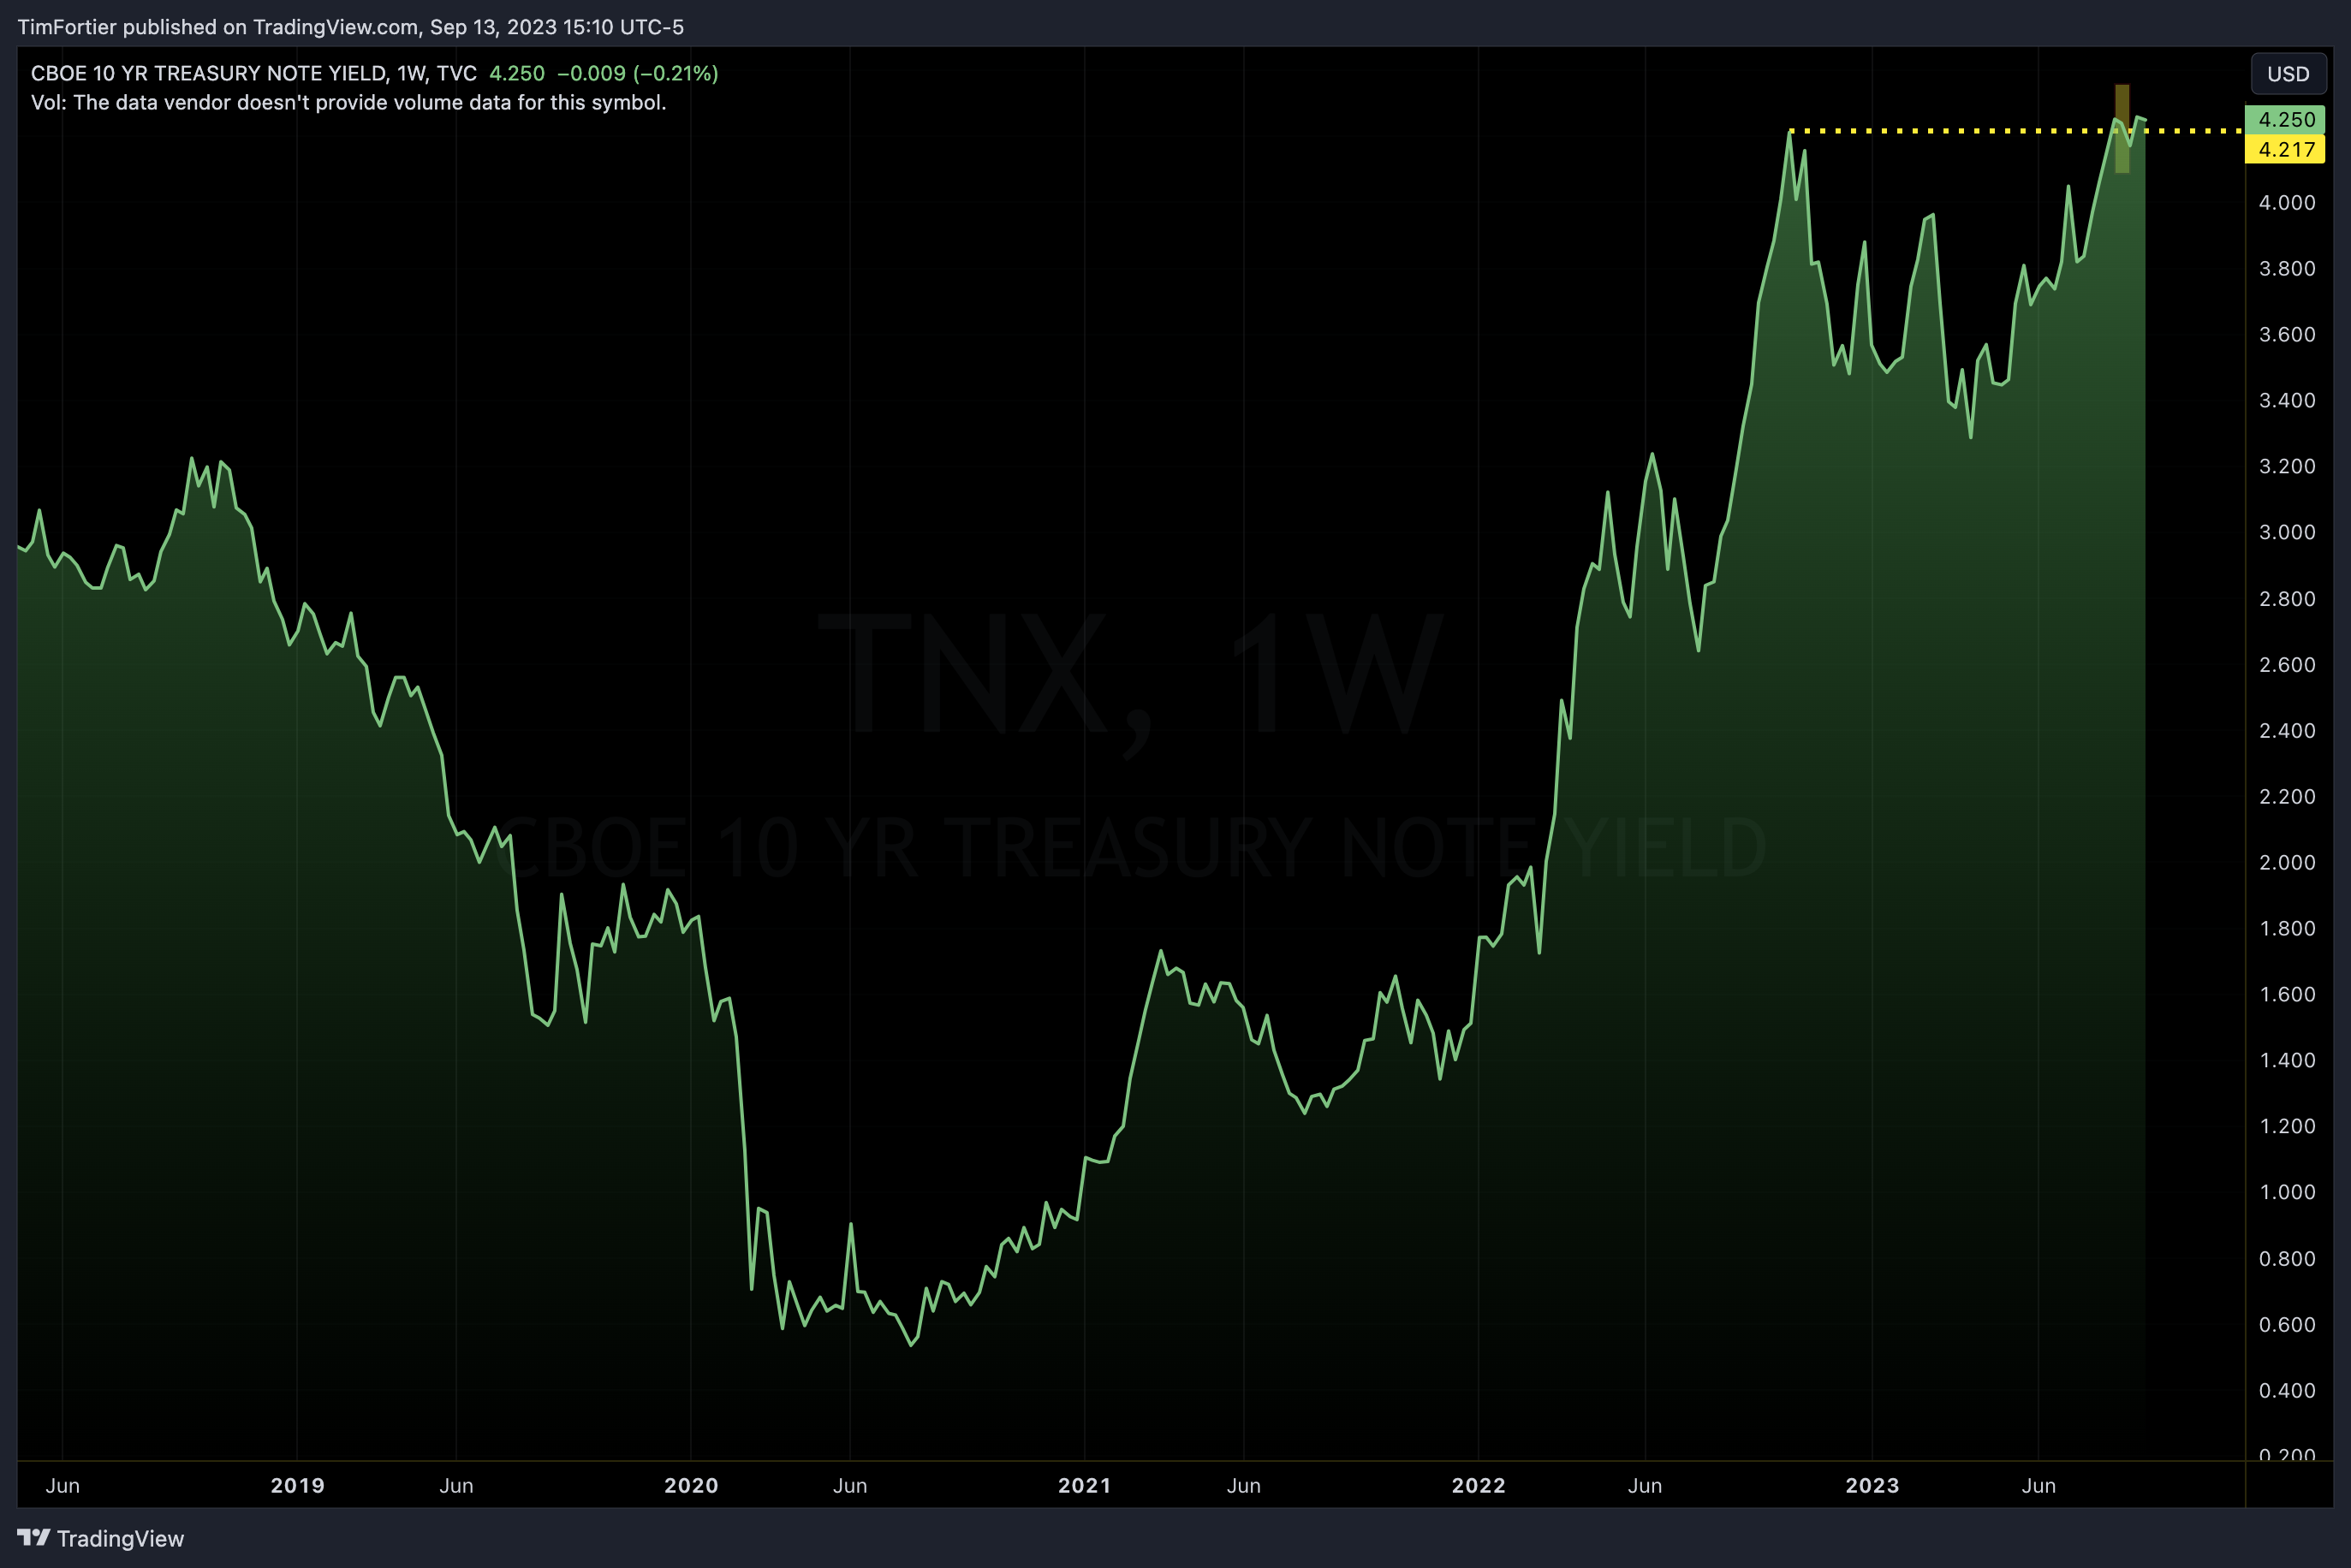
If inflation was the root cause of higher rates, then shouldn’t rates also be declining?
The answer is, all things being equal, then yes… but all things are not equal.
First, inflation may be in a retreat, but that does not mean that the beast has been slayed.
In the 1970s, inflation came in cycles mainly due to persistent oil shocks. Today, we face some similarities.
Since 2014, the world population has increased by 800 million. We now have a shocking 8 billion people needing far fewer natural resources that are ready for consumption relative to population growth.
We have created a whole new emerging class of up-and-coming carbon consumers in China, India, Bangladesh, Vietnam, Malaysia, etc.
At the same time, investments in metals, uranium, oil, and gas, are close to $3T off of the 2014 trajectory.
Despite a slowing global economy, oil demand is at a record high.
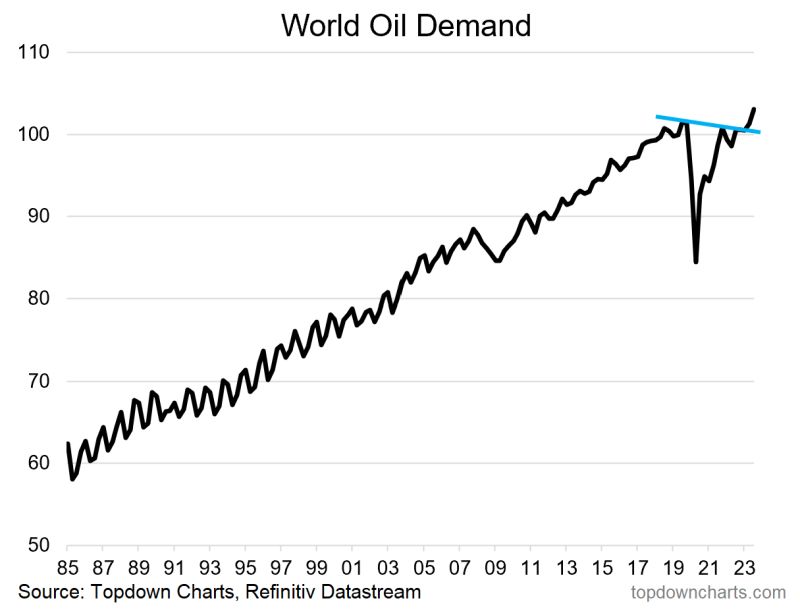
Bloomberg notes global oil markets are looking at a supply deficit of close to 3.5m bpd in Q4, the biggest shortfall since at least 2007.
So, while inflation may be temporarily tamed, it by no means implies that the threat of inflation has been eliminated.
Where the most recent inflation was caused by the Federal Reserve’s helicopter money policy, the next inflation crisis may come in the way of rising prices for natural resources due to increasing demand and structural impediments.
The next issue that is sure to play an important role in the credit markets is the colossal amount of debt that needs to be financed.
Borrowing costs have been rising across the U.S. economy as the Federal Reserve has been raising interest rates in an effort to curb inflation.
The government’s bill for its interest payments on debt reflects the size of the debt and the interest rates on the debt.
Unfortunately, due to out-of-control spending, the U.S. Treasury is faced with the need to issue a record amount of debt in the coming weeks to months.
This comes at a time when foreign central banks own the lowest amount of U.S. debt in years.
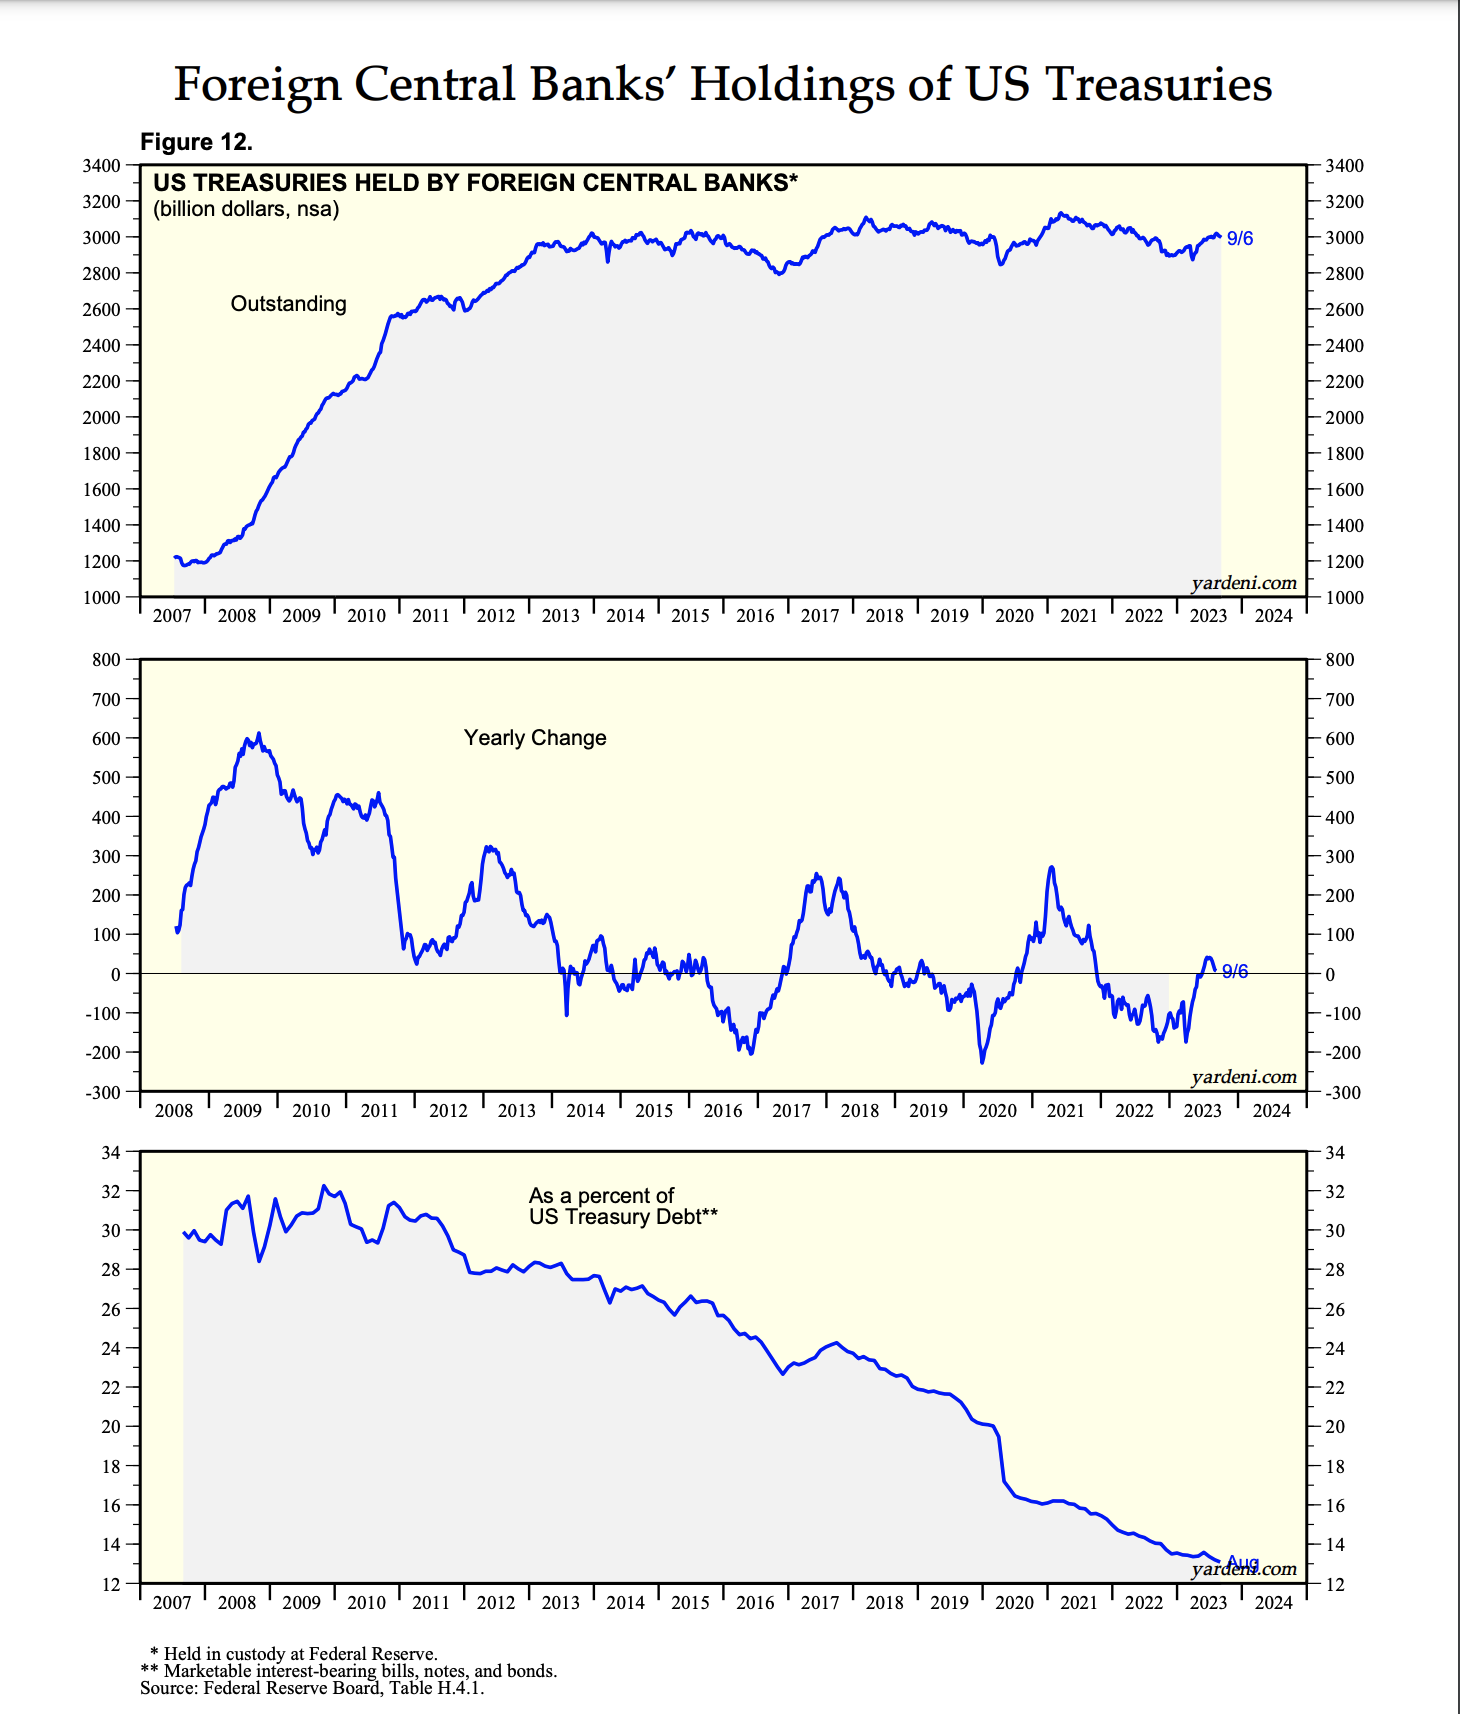
While the size of the deficit is going to require the U.S. to sell a lot of bonds to investors around the world, it’s difficult to keep interest rates at a level that’s attractive for creditors to hold, but not too high to harm the issuer.
If investors begin to sell, pushing up yields, the central bank will need to decide whether to print money to buy bonds, which will drive up inflation pressures.
A final reason that bond yields may remain higher has to do with credit risks.
Corporate defaults are at their HIGHEST level since the global financial crisis.
Credit rating agency S&P Global has released new data that shows that corporate defaults in August were the worst since 2009.
The global corporate default tally jumped to 107 as of August 31, 2023, with 16 defaults in August.
They now expect the U.S. and European 12-month trailing speculative-grade default rates to continue to rise from current levels to 4.5% and 3.75% respectively, by June 2024.
$800 billion of investment-grade, high-yield, and leveraged loans are maturing in 2024 which will need to be refinanced at higher interest rates according to Goldman Sachs.
At the same time, interest coverage ratios are falling for both investment grade and high-yield debt as higher interest rates begin to take a bite.
As a result of this, long-term interest rates are rising for non-economic reasons.
So, the outlook for fixed-income securities still remains challenging.
But the one improvement is that with the yield curve inverted, investors can obtain over 5% on U.S. TBills and money markets have become attractive.
Where does this put stocks?
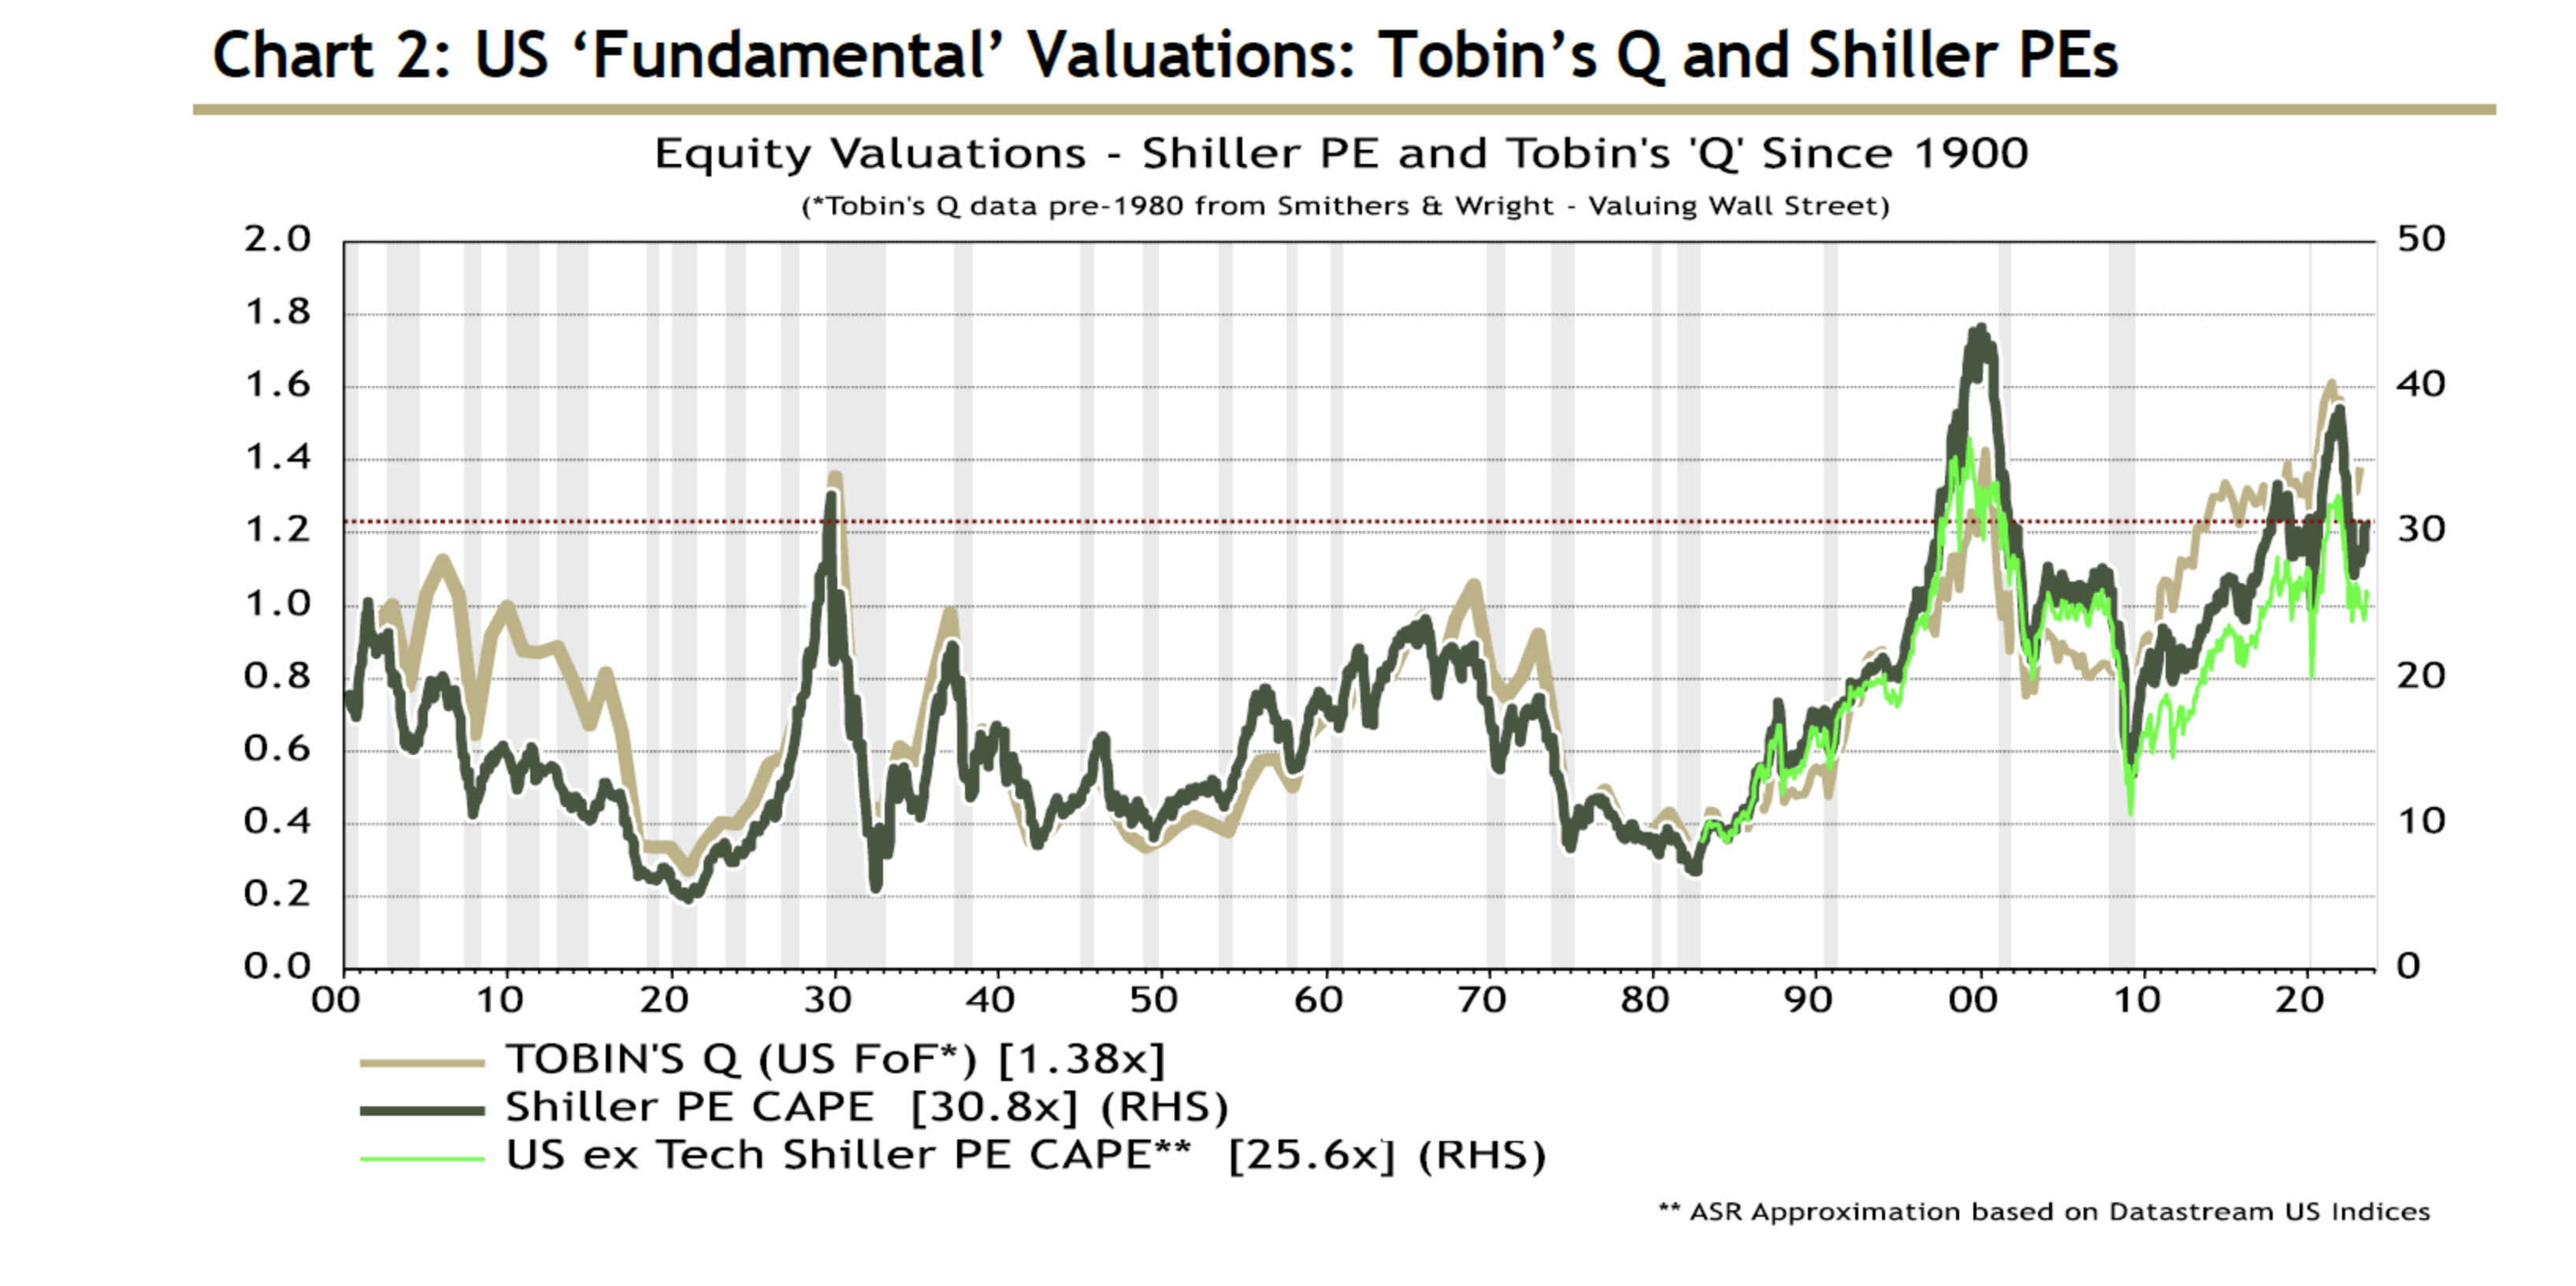
Stocks are historically expensive, at valuations comparable to the eve of the Great Crash in 1929 and of the Global Financial Crisis in 2007.
In addition to “expensive” fundamental valuations, performance in the stock market has become very concentrated.
The surge in 2023 by the “Magnificent 7” AI-associated stocks has led the 10 largest stocks in the S&P 500 to represent the highest aggregate index weighting (31.7%) in history.
The current economic and geopolitical climate is rich in potential catalysts for market volatility, with the historic weighting of the 10 leading stocks amplifying the potential severity of the eventual market pullback.
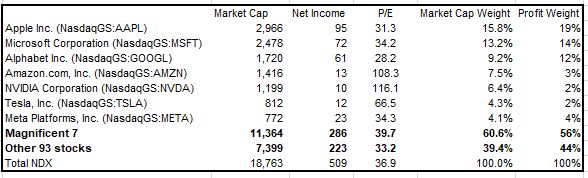
Nasdaq 100 (NDX) is trading at 36.9 LTM earnings (which is not cheap). The Magnificent 7 represent 60% of the market cap (huge concentration) and 56% of profit weight (they trade at magnificent 40 p/e).
The other 93 companies in the index represent 40% of the market cap and 44% of all profits. With a P/E of 33, the other 93 companies are cheaper relative to the Magnificent 7, but definitely not cheap compared to the historical P/E of 15-16.
Investors who are passively investing in U.S. index funds have enormous risk exposure due to market concentration.
The market is buying good companies BUT at any price. This logic when used in the past (dot.com bubble, Nifty Fifty) produced disastrous results.
In summary, the cost of debt is on the rise, and justifying today’s fundamental multiples is becoming increasingly challenging.
Conclusion
From the time of my original series, the thesis for vast underperformance by traditional asset mixes unfolded in a nearly breathtaking fashion.
While bond prices have remained generally weak, stocks have enjoyed a significant rally since October 2022, but only within a narrow basket of stocks.
The underperformance of the equal-weight S&P 500 vs. the cap-weighted S&P 500 is striking.
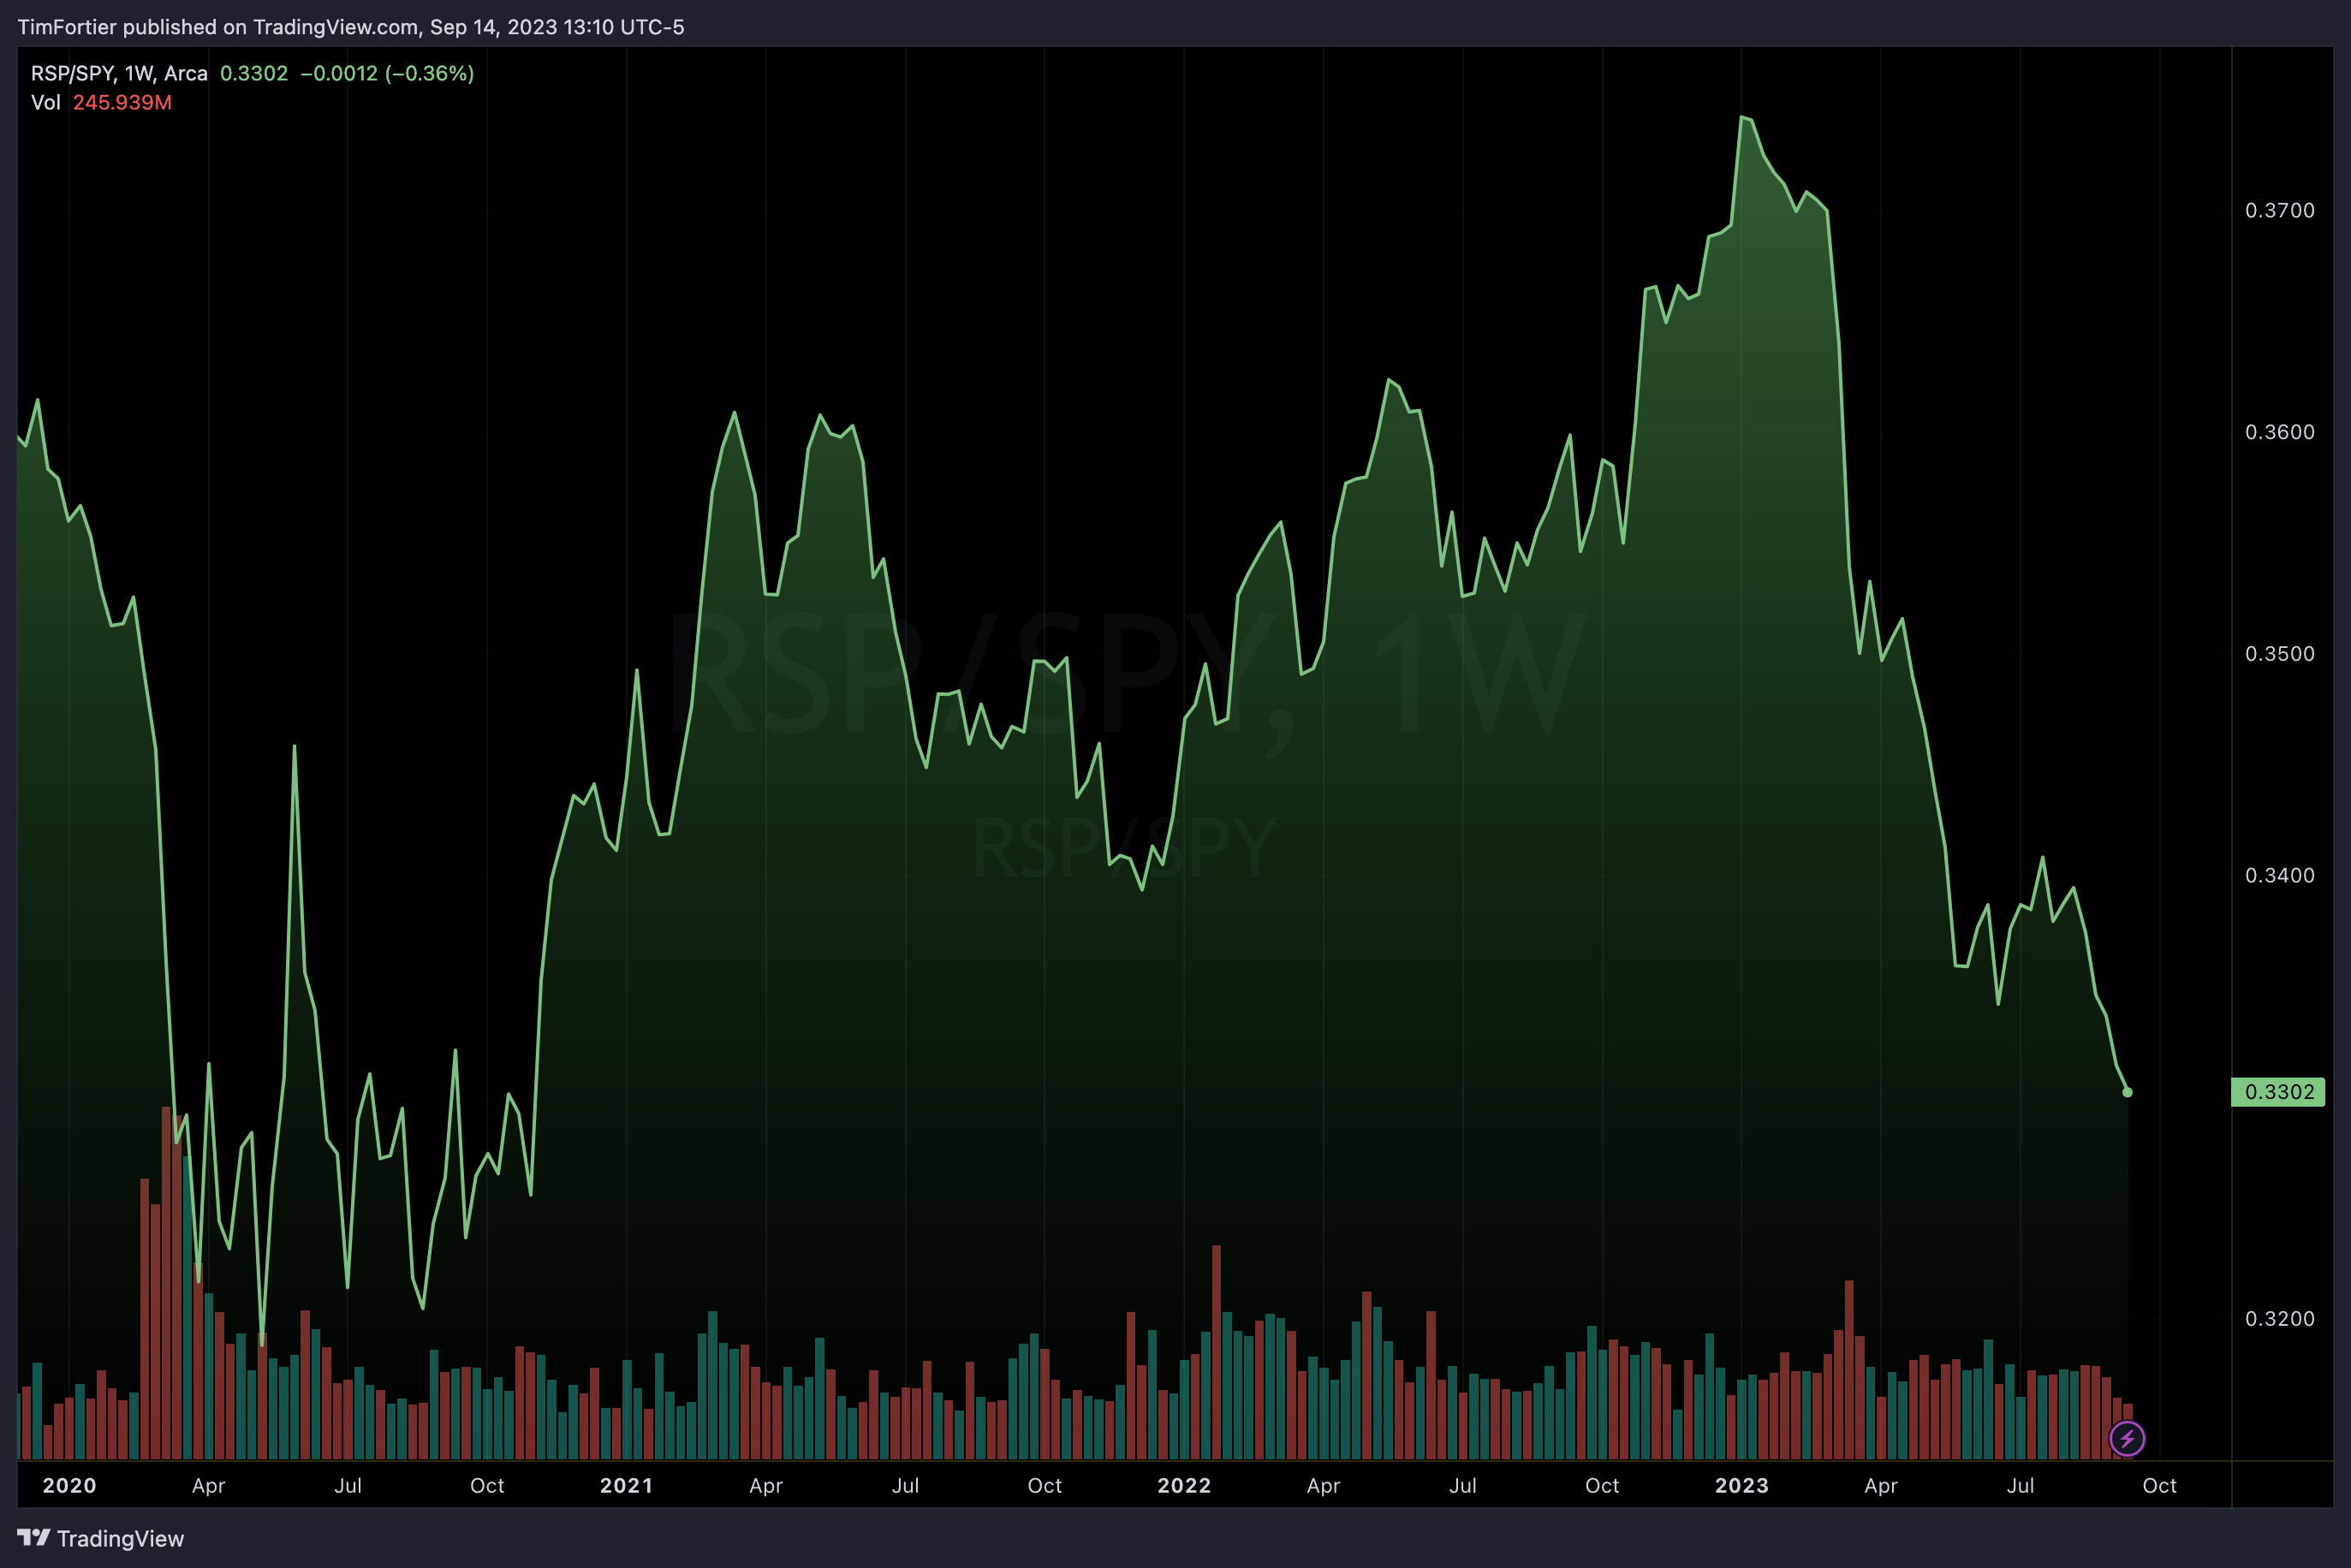
The vast number of stocks have not performed well.
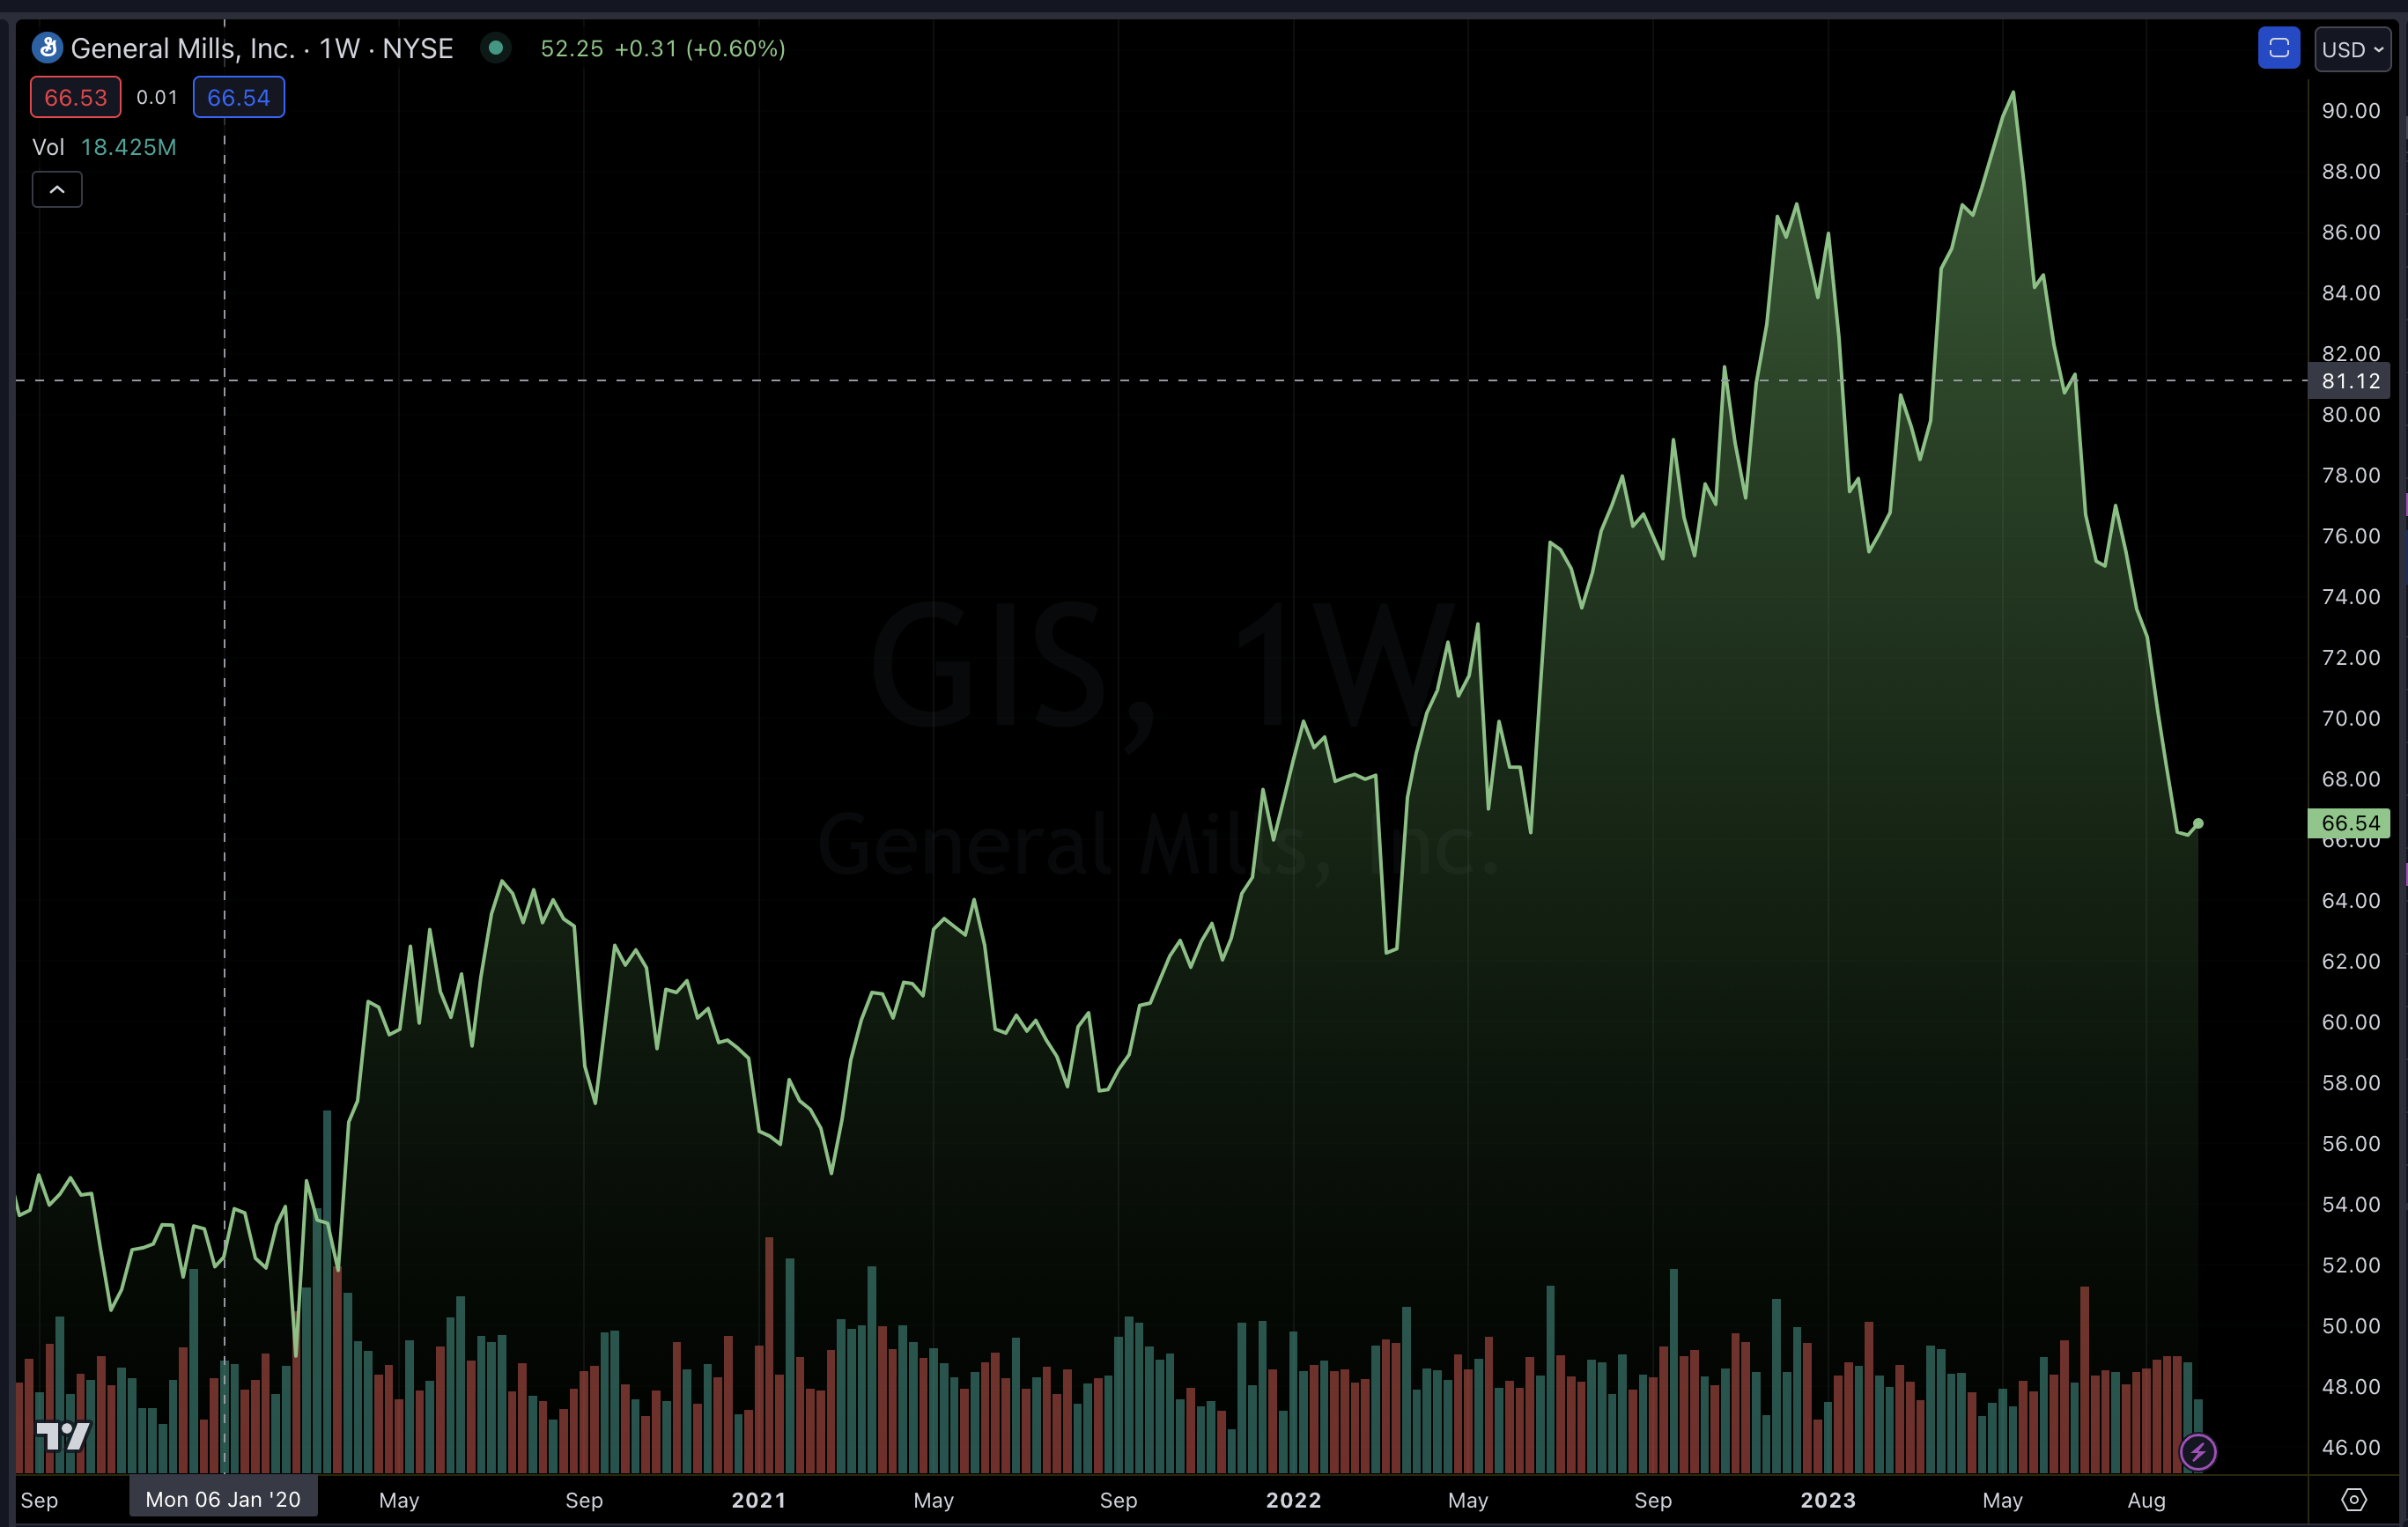
Even traditional consumer staples companies are no longer safe havens.
As an example, General Mills (GIS) has reported that wage inflation has cut into margins at the same time that consumer demand is declining.
Consumers appear to be under increasing pressure as savings have fallen sharply at the same time credit card usage is at an all-time high.
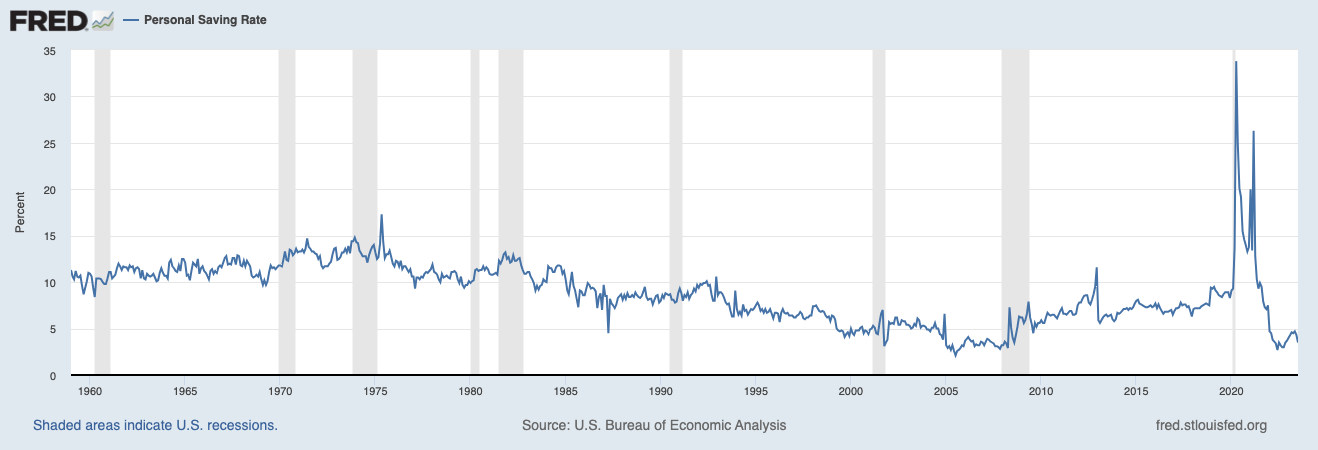
With the consumer representing two-thirds of the U.S. GDP, the importance of the health of the consumer cannot be overstated.
The current challenge is that it is hard for equity owners to generate profits at these levels. If that’s true, people will sell and prices will fall.
So, with developed economies currently facing a chronic debt crisis, with entrenched inflationary pressures, reckless fiscal spending, and a consumer under pressure, the backdrop of high stock valuations does not bode well for the buy-and-hold investor.
Going forward, I remain steadfast in my belief that strategies that can protect downside risks, diversified commodity trend following, and liquid alternatives should play a greater role in investor portfolios.
If you have any questions or have been considering hiring an advisor, then schedule a free consultation with one of our advisors today. There’s no risk or obligation—let's just talk.
Tags

Free Guide: How to Find the Best Advisor for You
Get our absolutely free guide that covers different types of advisory services you'll encounter, differences between RIAs and broker-dealers, questions you’ll want to ask when interviewing advisors, and data any good financial advisor should know about you and your portfolio.
