
Related Blogs
July 27, 2023 | Avalon Team
Trying to assemble economic puzzle pieces can be like the number puzzle Suduko. 
Just like a good numbers puzzle, figuring out the economy is more challenging than it looks.
Solving the big picture requires solving smaller components.
And when it comes to the economy, investors are fed smaller pieces of data in sequence rather than being given all the data at once.
The recent decline in CPI initially gave stock traders the belief that the worst is in the past and that the Fed may finally take its foot off the interest rate pedal.
The report also marked a significant milestone as it is the first time in 102 years that we have witnessed twelve consecutive months of declining CPI on a YoY basis.
It should be noted that CPI remains above the Fed’s target rates despite the falling decline sequence.
And don’t look now, but it doesn’t look like inflation is ready to go away anytime soon.
First, agricultural commodities are surging again, impacting food prices at the grocery store.
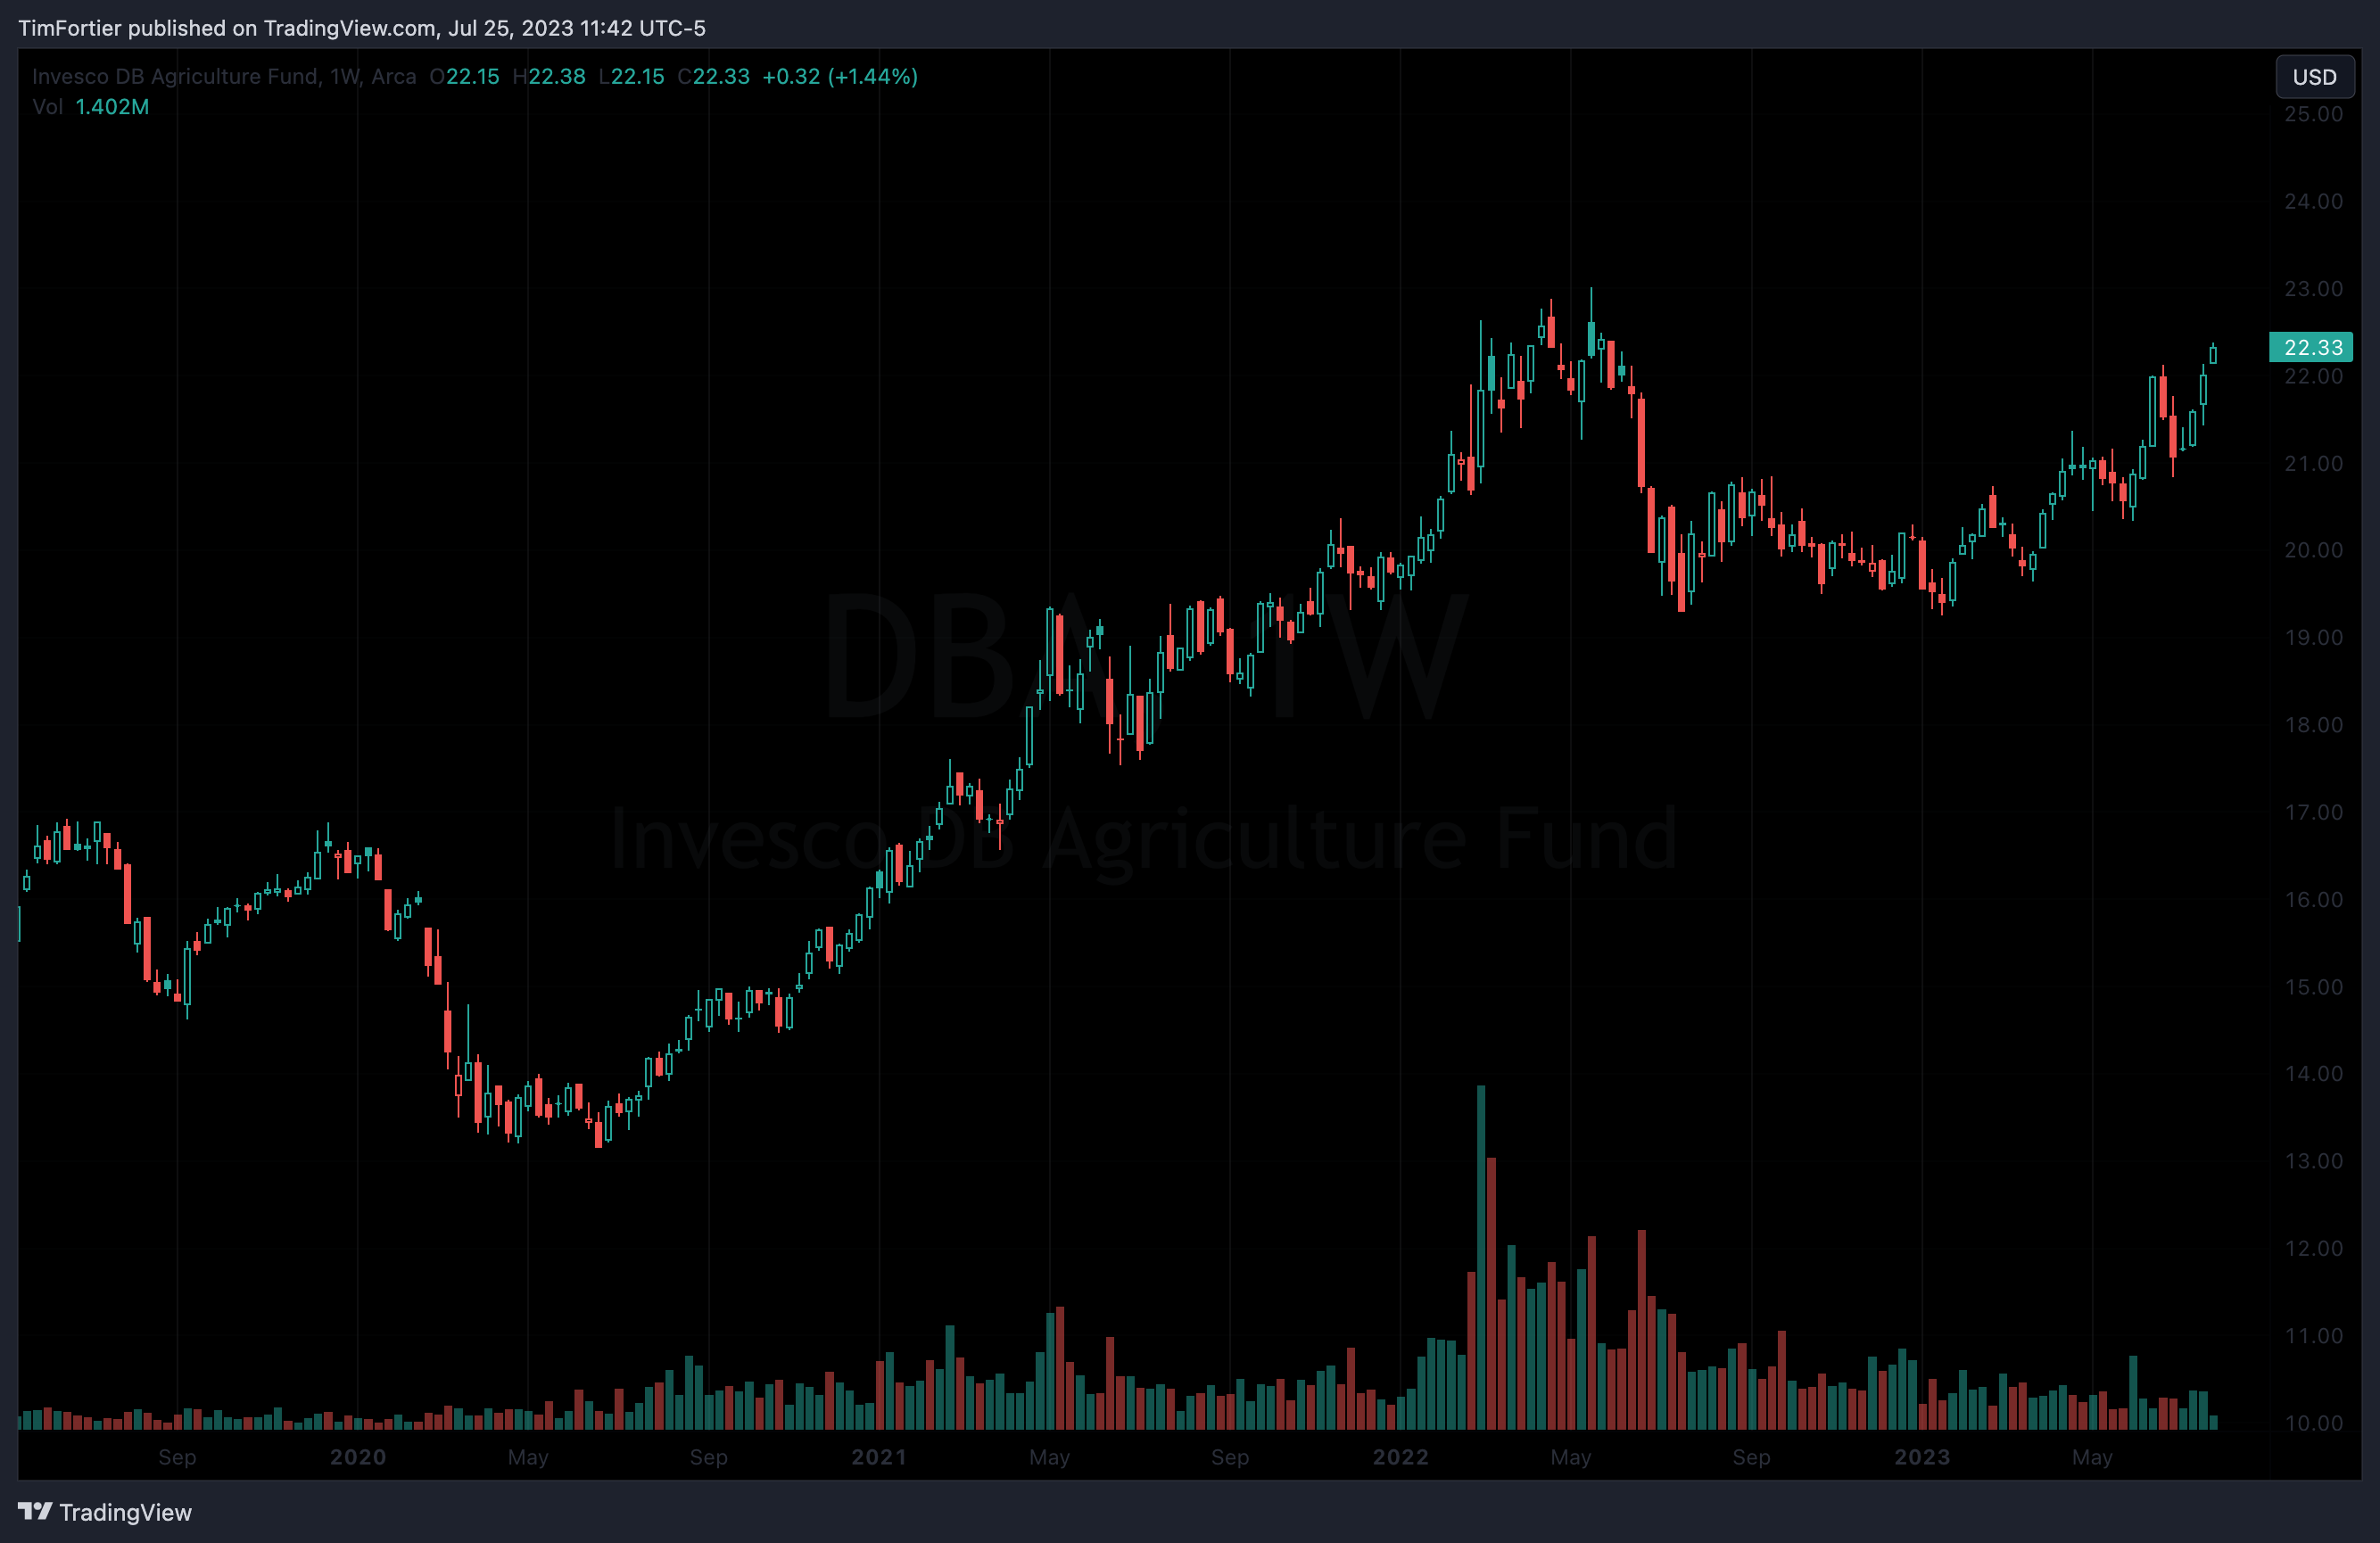
This chart of Invesco DB Agriculture Fund (DBA) shows that agricultural commodities are less than 3% away from reaching the highs seen during the “Russian Invasion.”
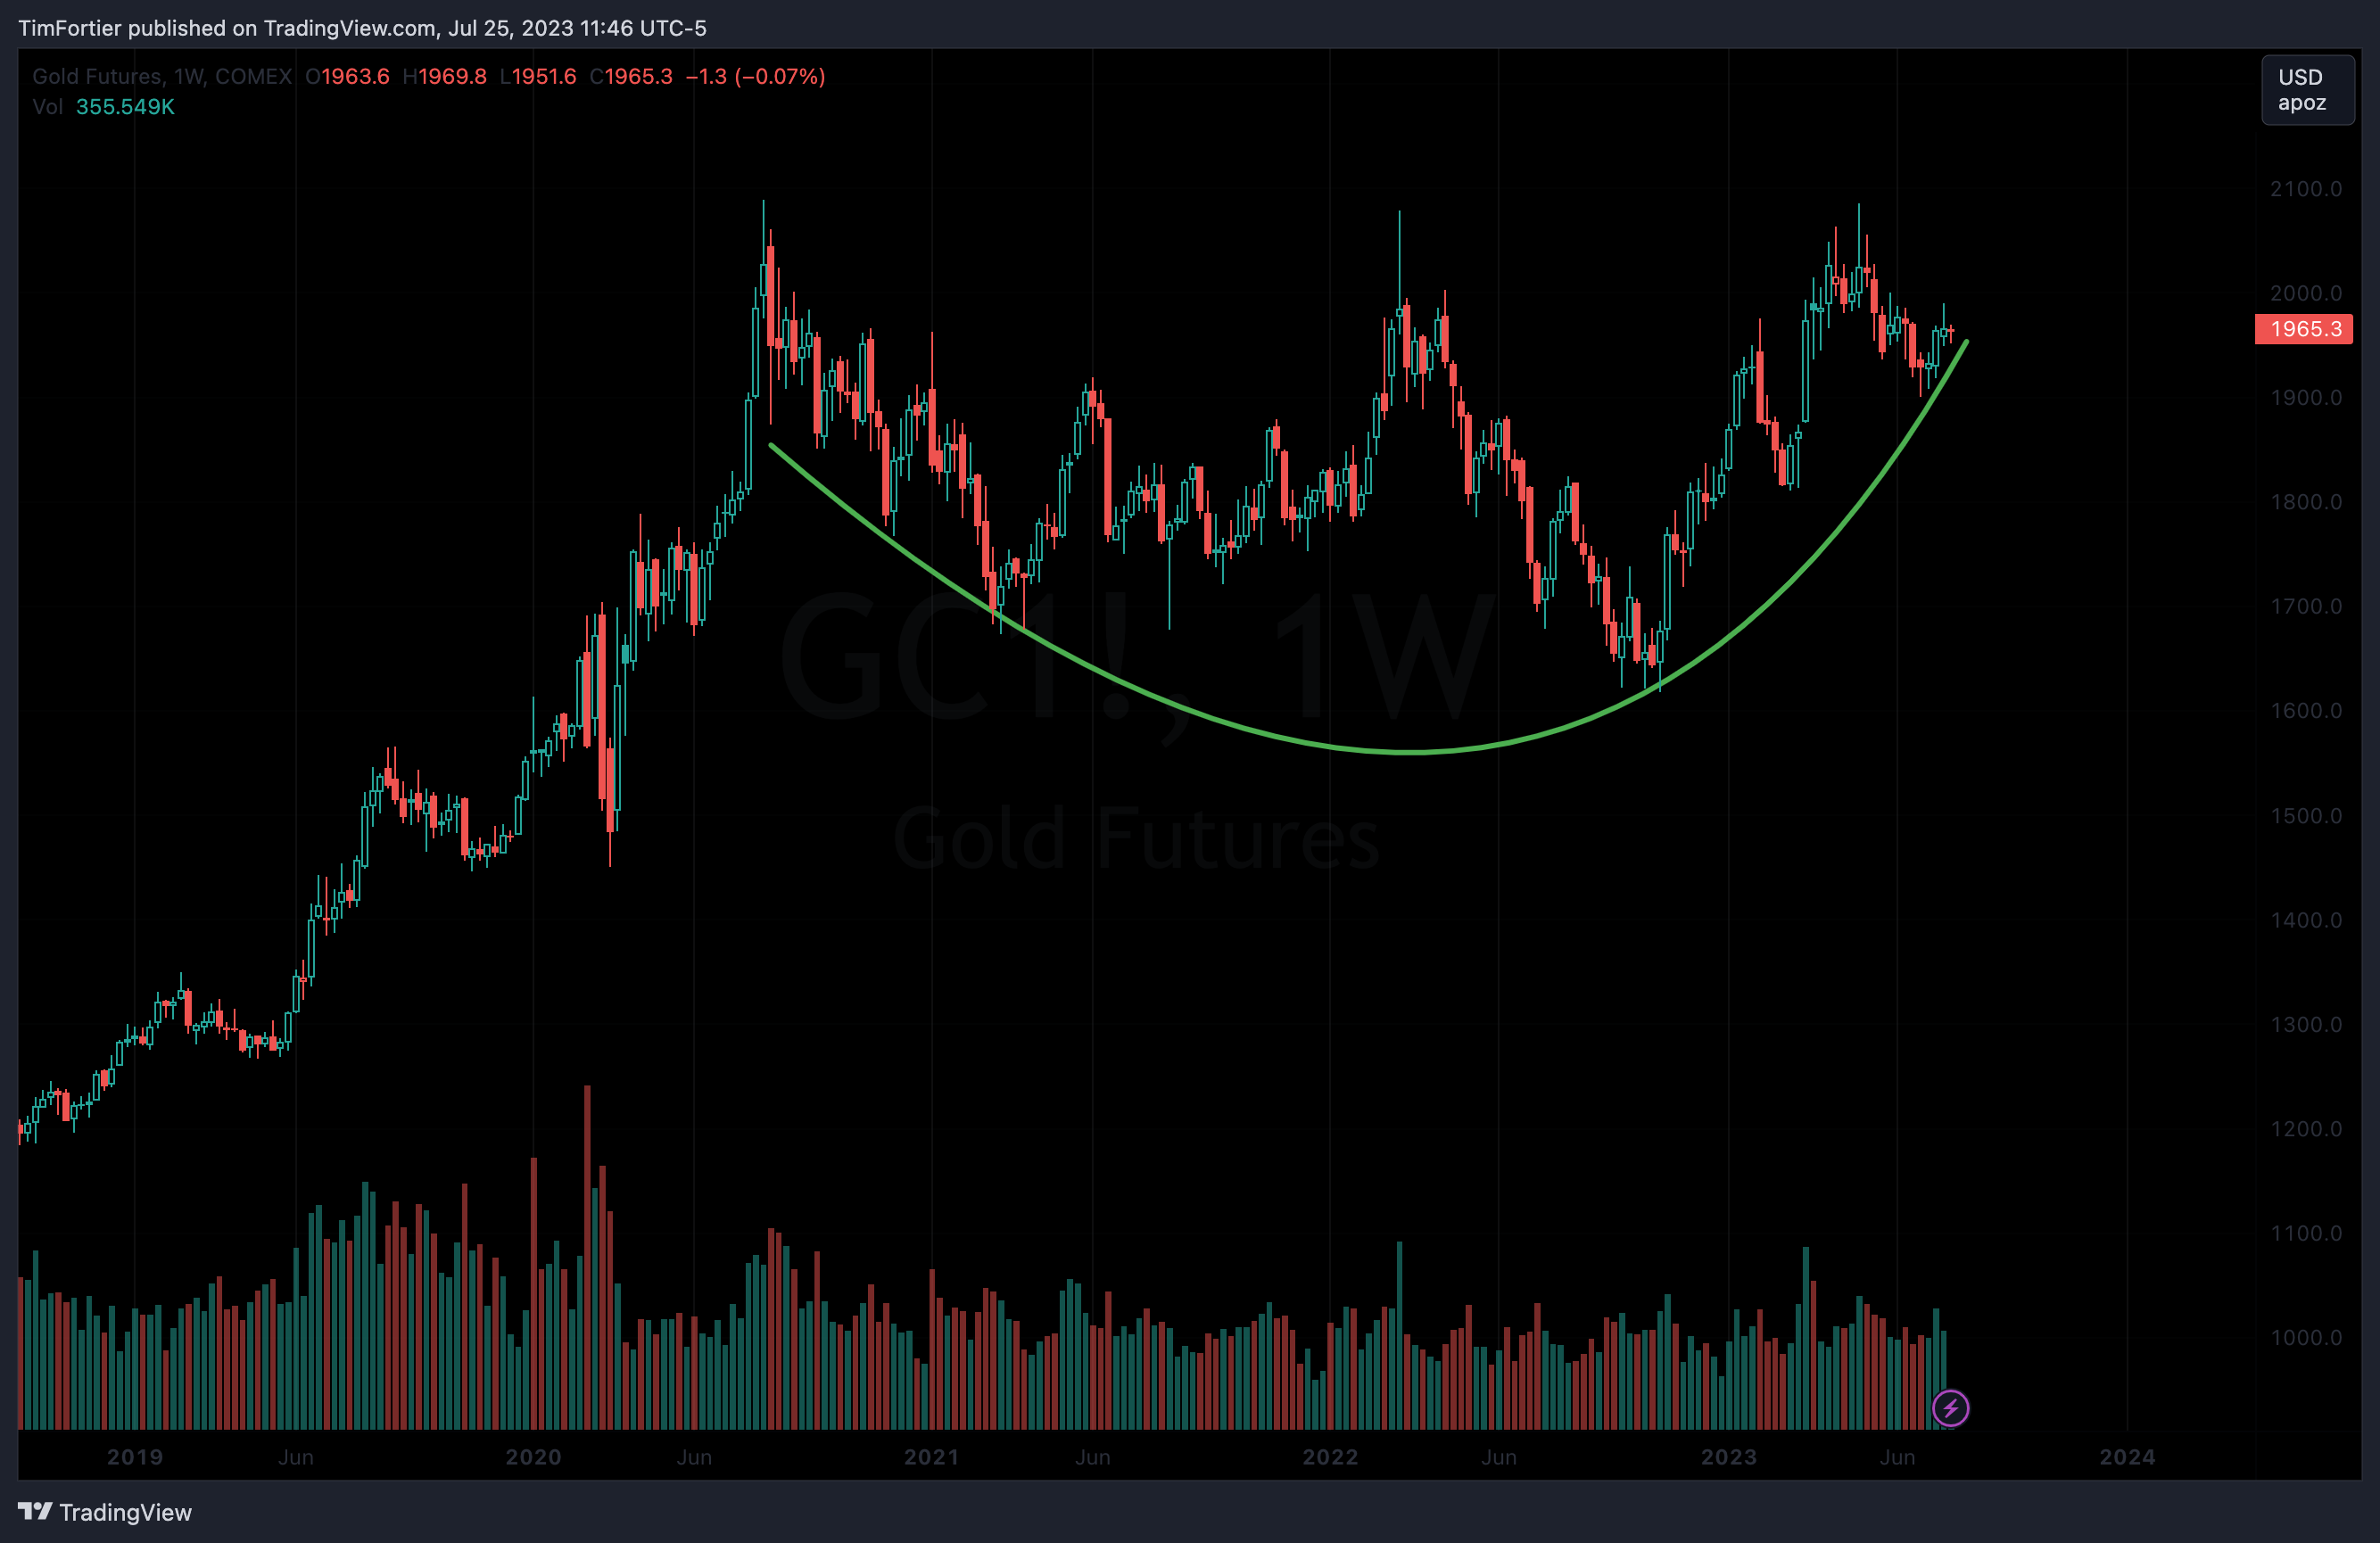
And gold continues to flirt with $2,000. Below is the SPDR Gold Trust (GLD) chart.
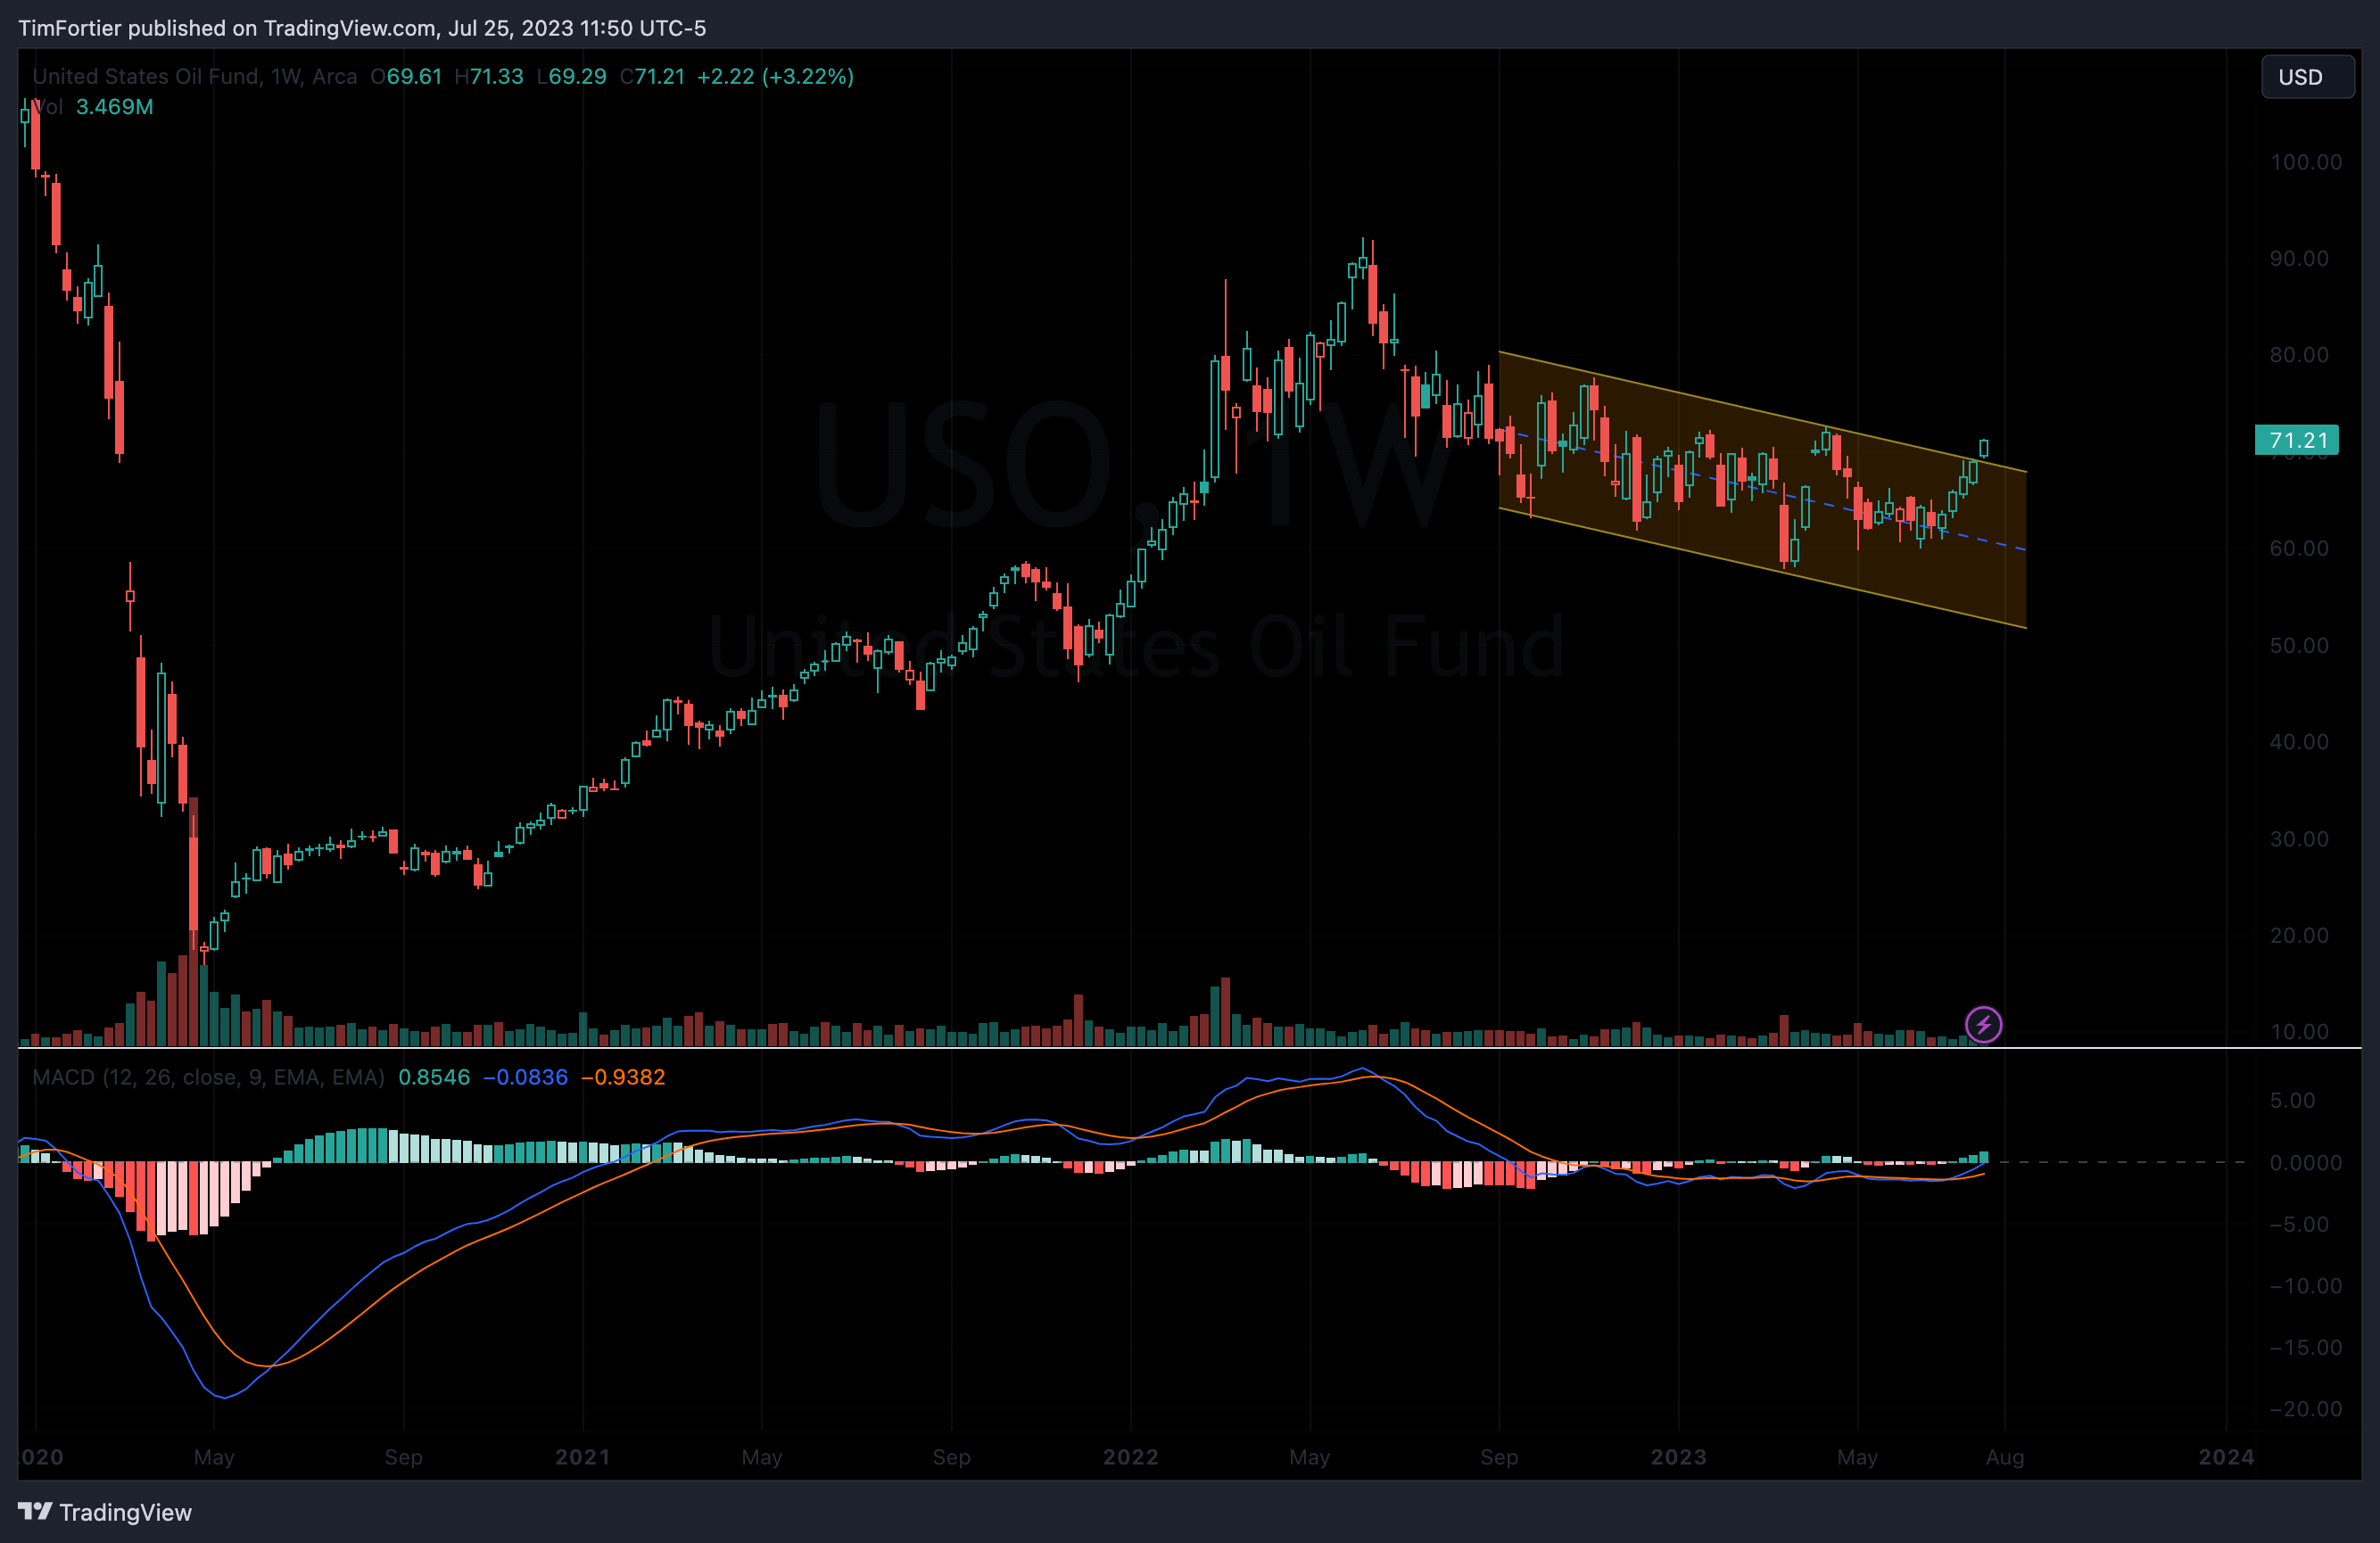
And energy is again advancing, as this weekly chart of the United States Oil Fund (USO) shows.
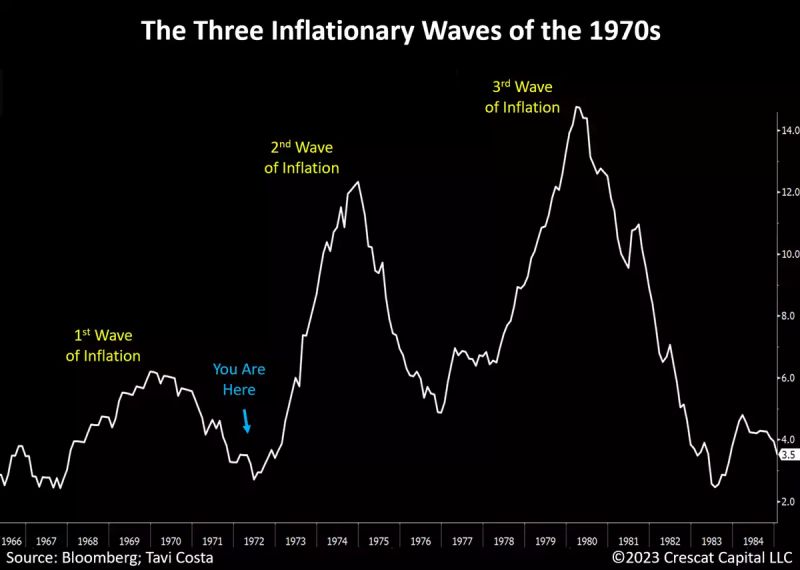
While the macro environment today differs from the 70s and 40s, a lesson from history remains: Inflation tends to develop through waves.
We have recently witnessed the conclusion of the first wave and are likely in the process of reaching a bottom in the recent deceleration period, with a new upward trajectory underway.
The primary reason for this is the persistence of underlying issues that continue to drive inflation rates higher:
- Irresponsible levels of government spending.
- Escalating deglobalization trends, which necessitate the revitalization of manufacturing capabilities in economies.
- Wage-price spiral, mainly driven by low-income segments of the society.
- Ongoing supply constraints due to chronic underinvestment in natural resource industries.
The chart below shows how inflation unfolded in the 70s and where we may be relative to the cycle.
What does the credit market have to say about this?
This is a chart of the 30-year expectation for inflation by the market.
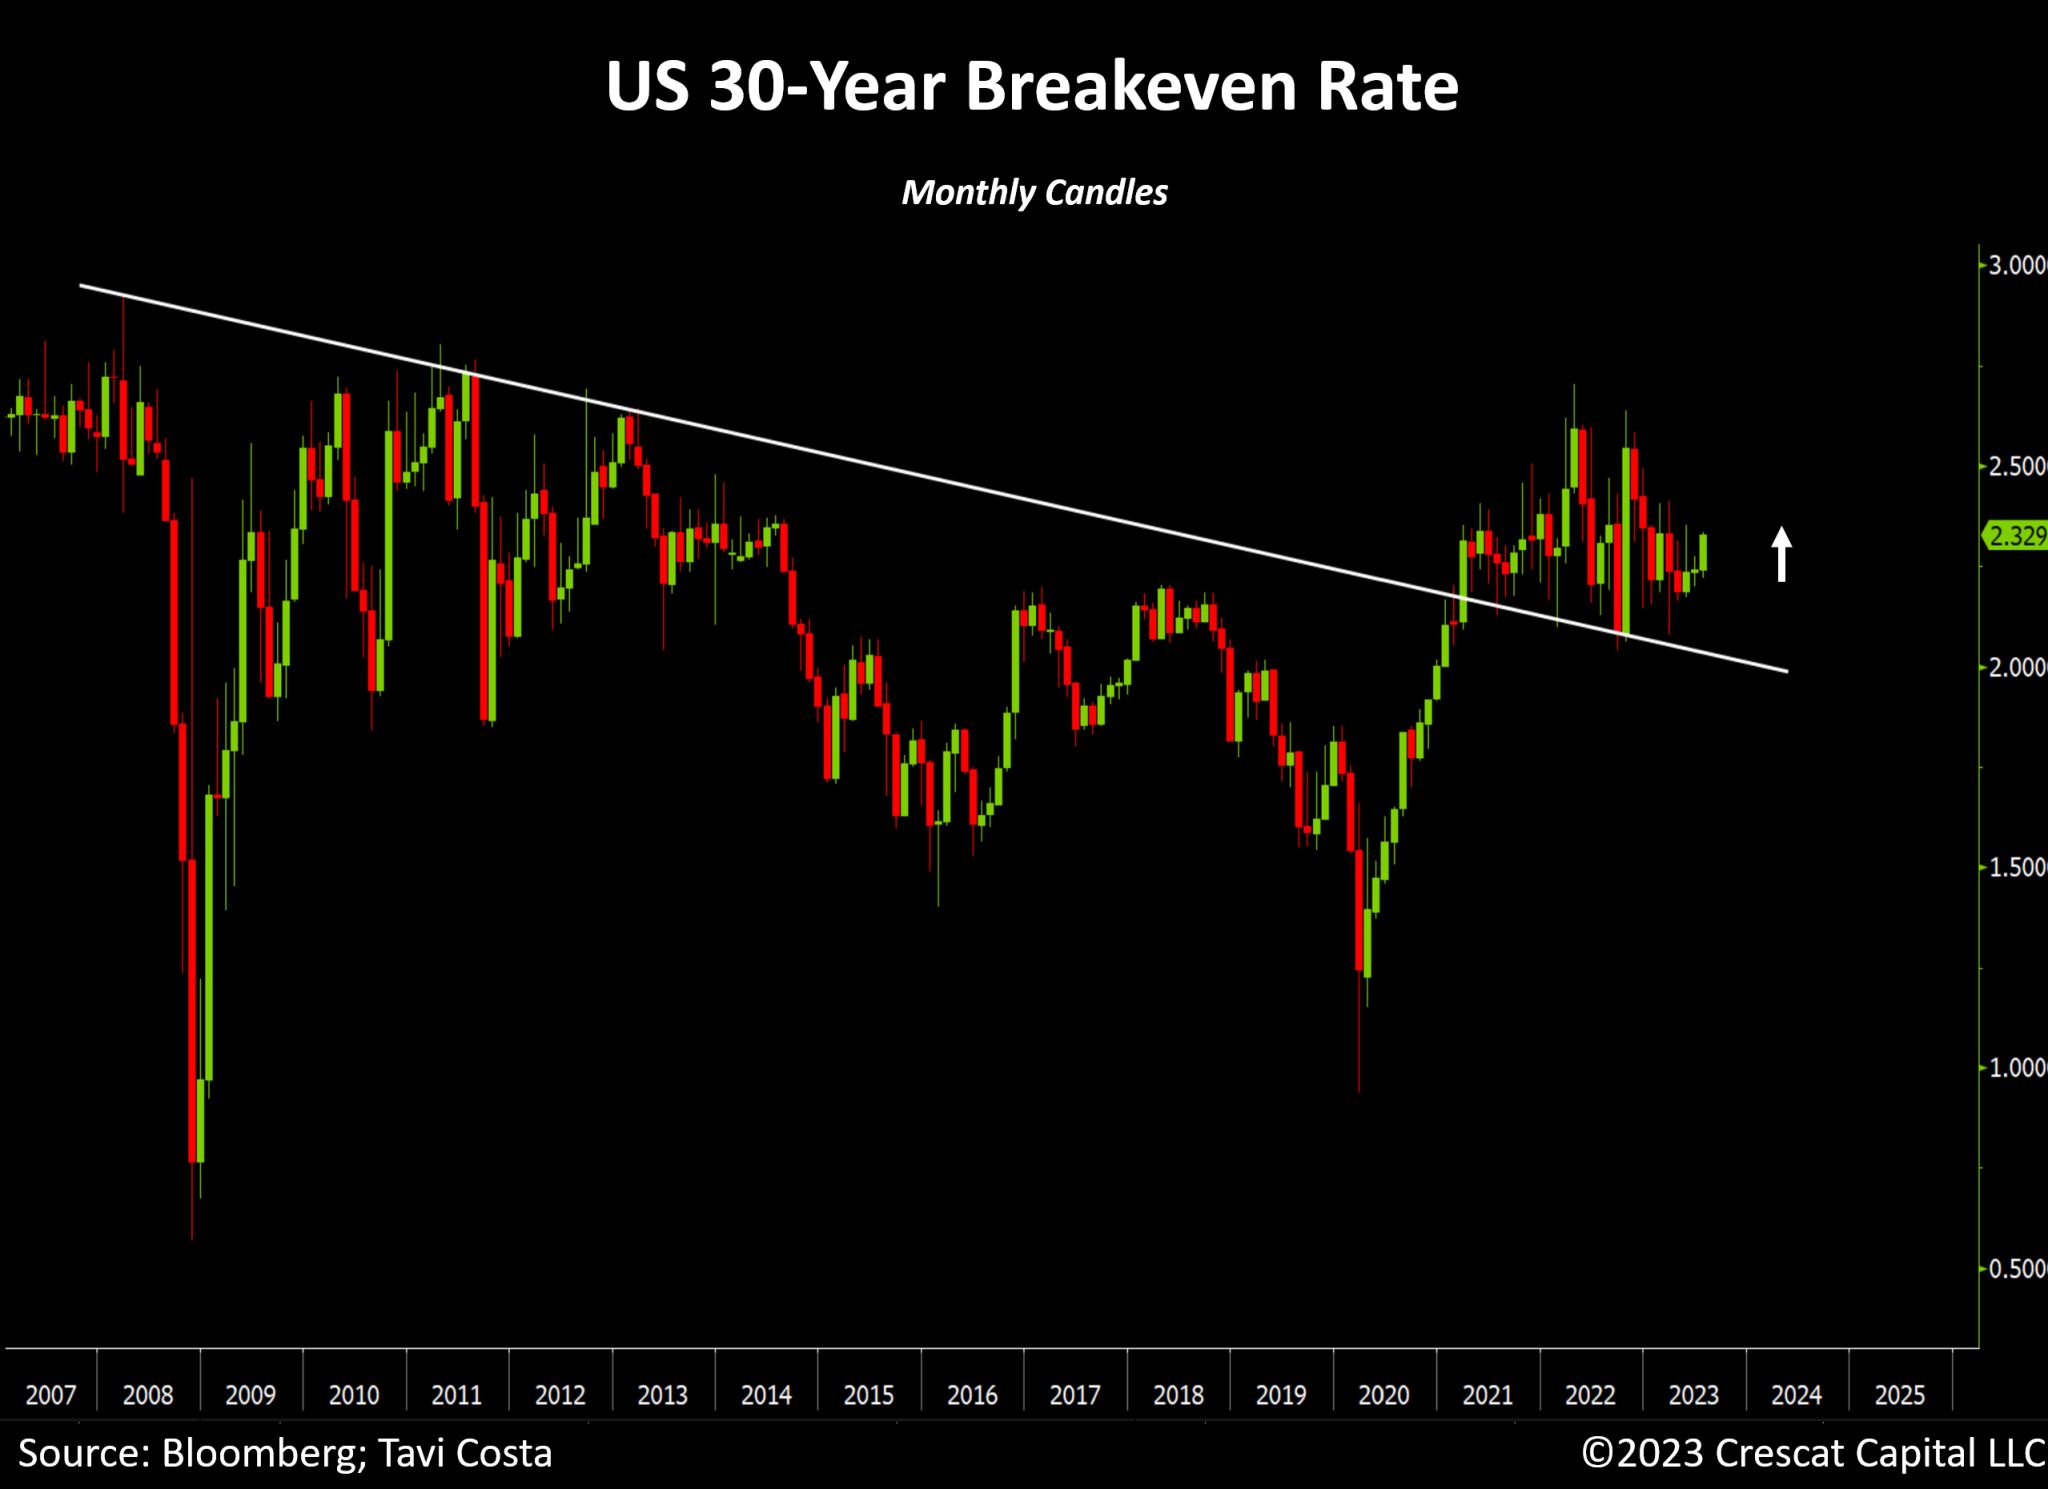
This shows a major breakout followed by two years of consolidation. And just when investors thought inflation might be in the rearview mirror, it is showing its teeth again.
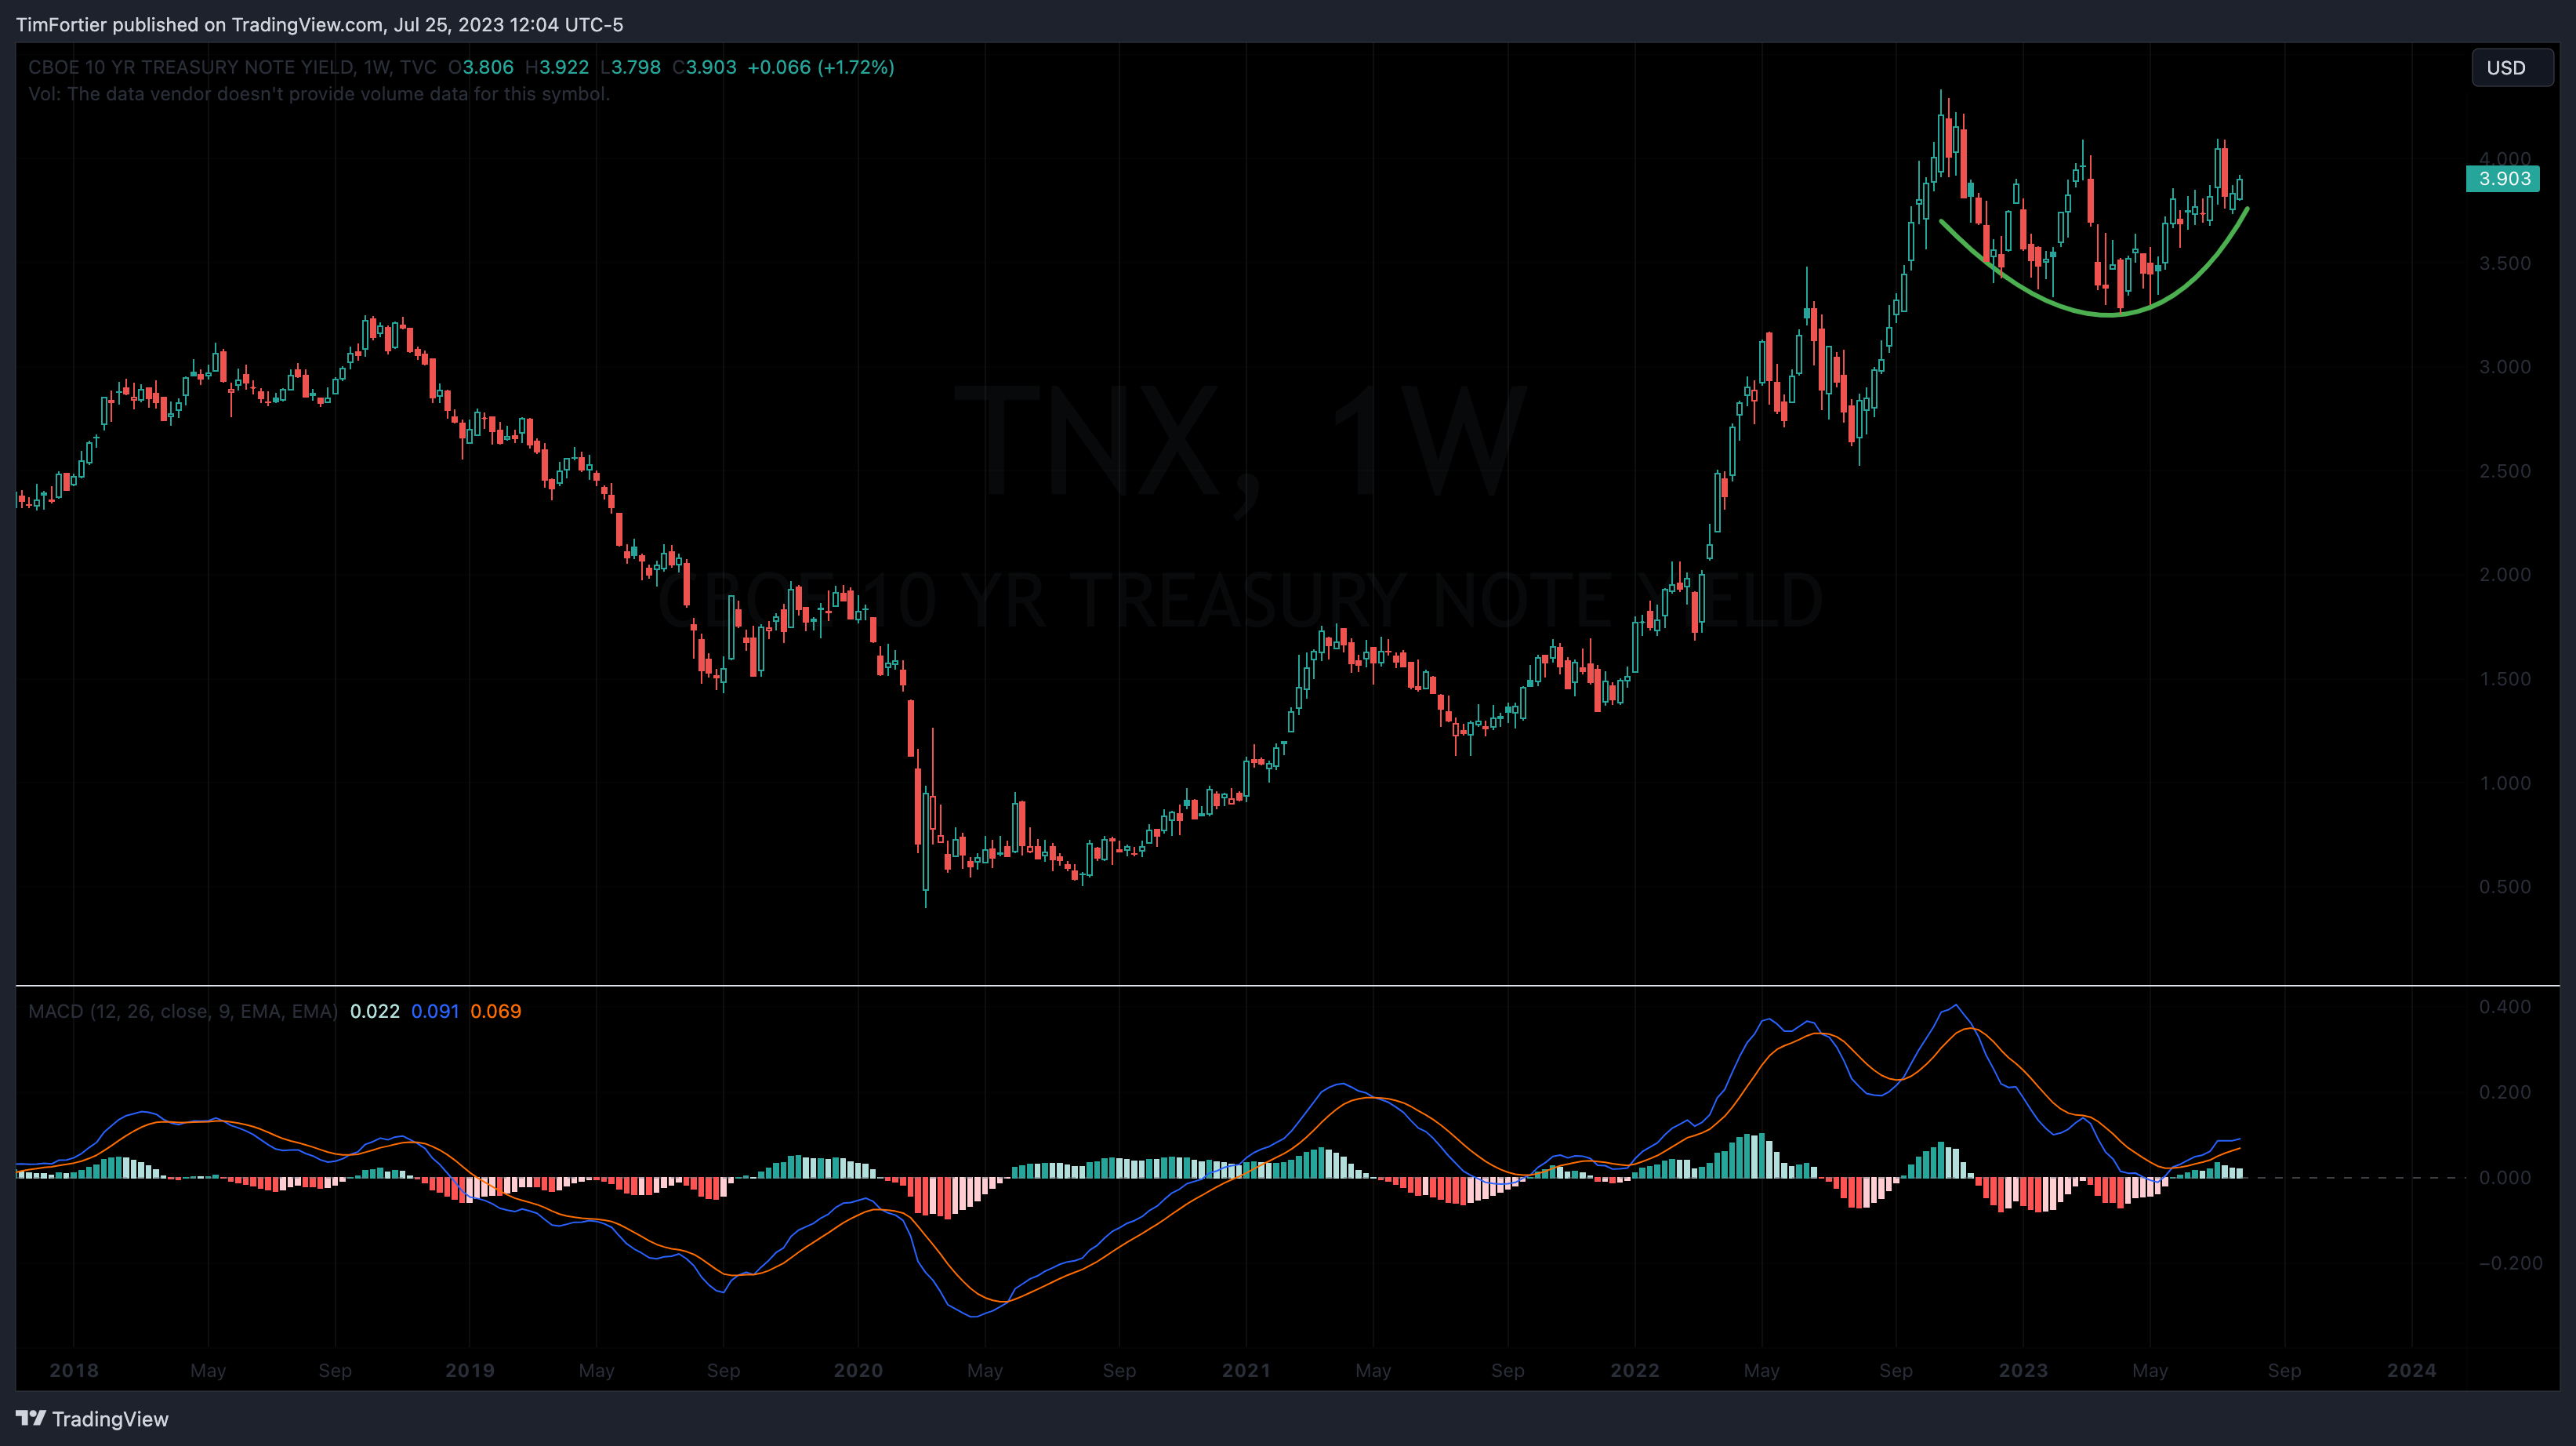
And the benchmark 10-year rate remains very close to the breakout levels it was challenging before the CPI report.
Now, like a good Soduko puzzle, there are always a few more combinations of numbers that must be applied.
First, there has been a marked deterioration in the performance of international markets.
The following table shows how few asset classes are performing well on an absolute relative-momentum basis.
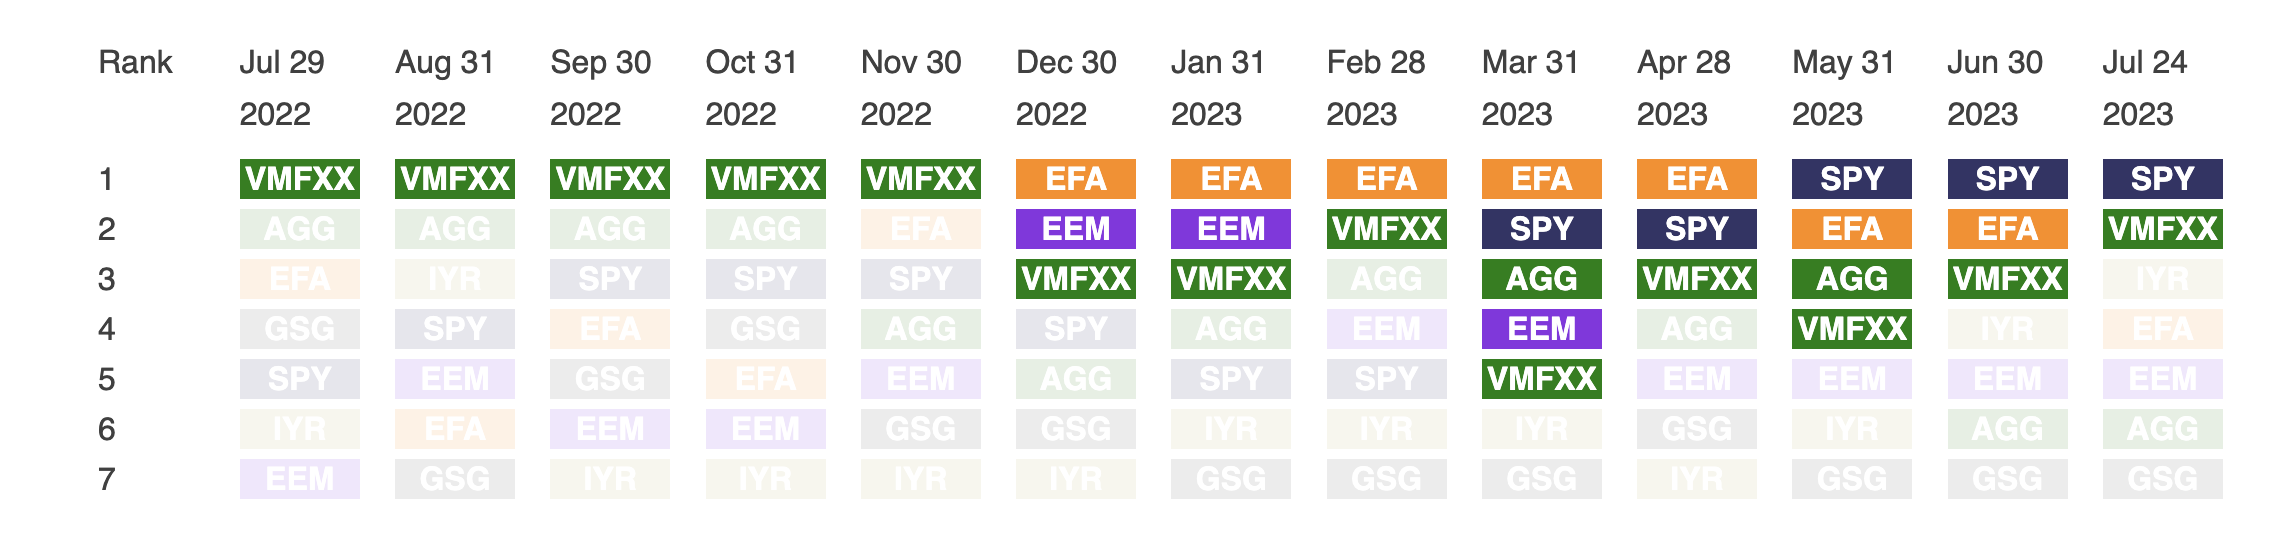
International equities (EFA), after leading at the first of the year, have dropped below the risk-free money market (VMFXX), indicating recent poor performance.
Fitting to our economic puzzle are a couple of important data points.
The first is this chart of loan demand… or rather the lack thereof.
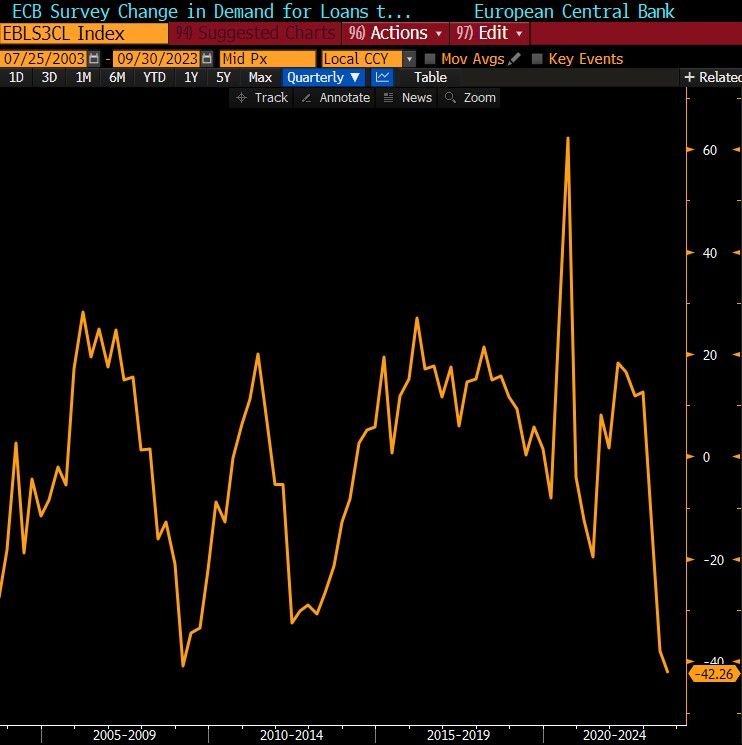
Demand for corporate loans in Europe has slumped to the lowest level since 2003!
The Euro Area Bank Lending Survey showed that credit conditions continue to tighten in Europe. Remember, European credit creation is much more bank dependent than in the US, so this matters.
Next, we see that European manufacturing is in a severe contraction.
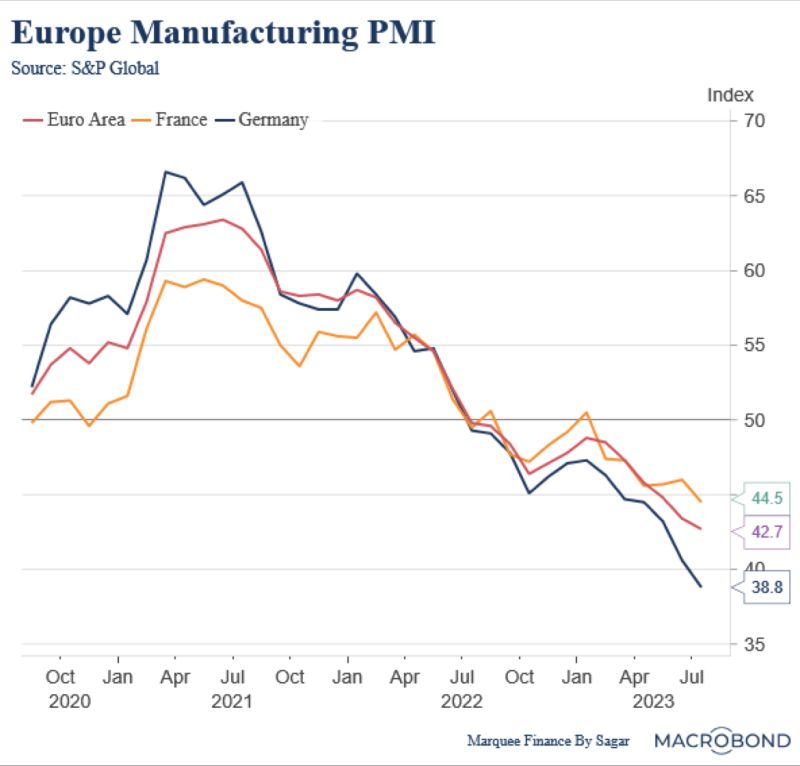
The “lagged” effects of the monetary policy are visible, and the global slowdown is accelerating.
Which brings me back to the United States.
Notice on the table above that the S&P 500 SPDR (SPY), is the only asset class above the risk-free VMFXX.
Now consider that the recent rise in market cap concentration has been the steepest on record based on over 60 years of history, with even narrower leadership than seen during the TMT Bubble.
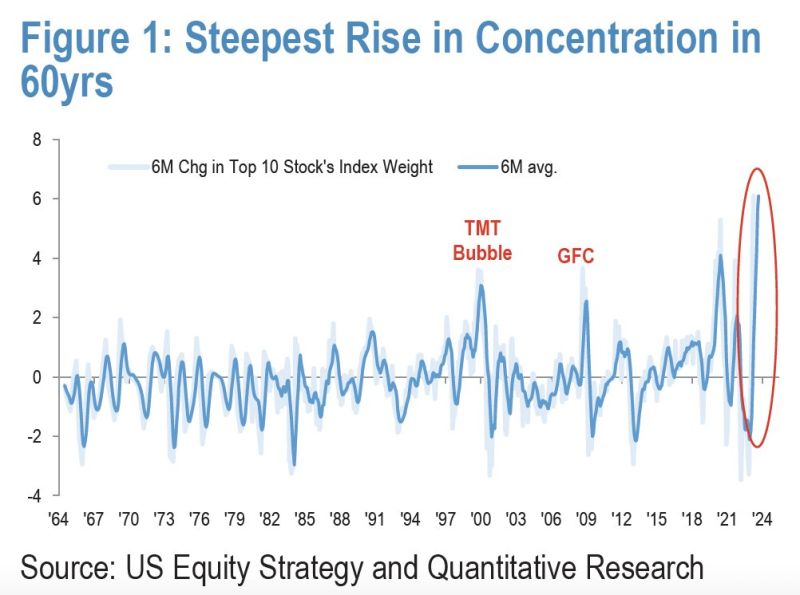
The fact that the majority of this year’s stock returns are within a small number of mega-caps is a point discussed several times in past articles.
Which brings up my final two pieces of the puzzle.
The first shows forces at work against the market being supported by the consumer, who has so far held up much better than expected.
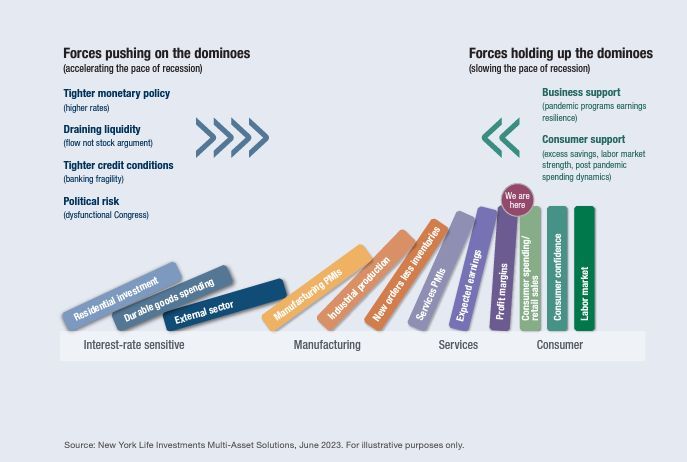
But, other data suggests that soon this may be no longer the case.
With over $1T in credit card debt and depleted savings, the consumer appears to be succumbing to the economic pressures.
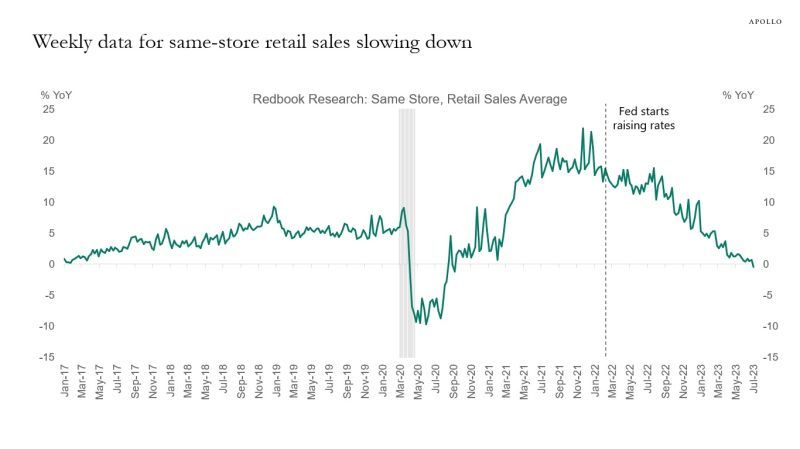
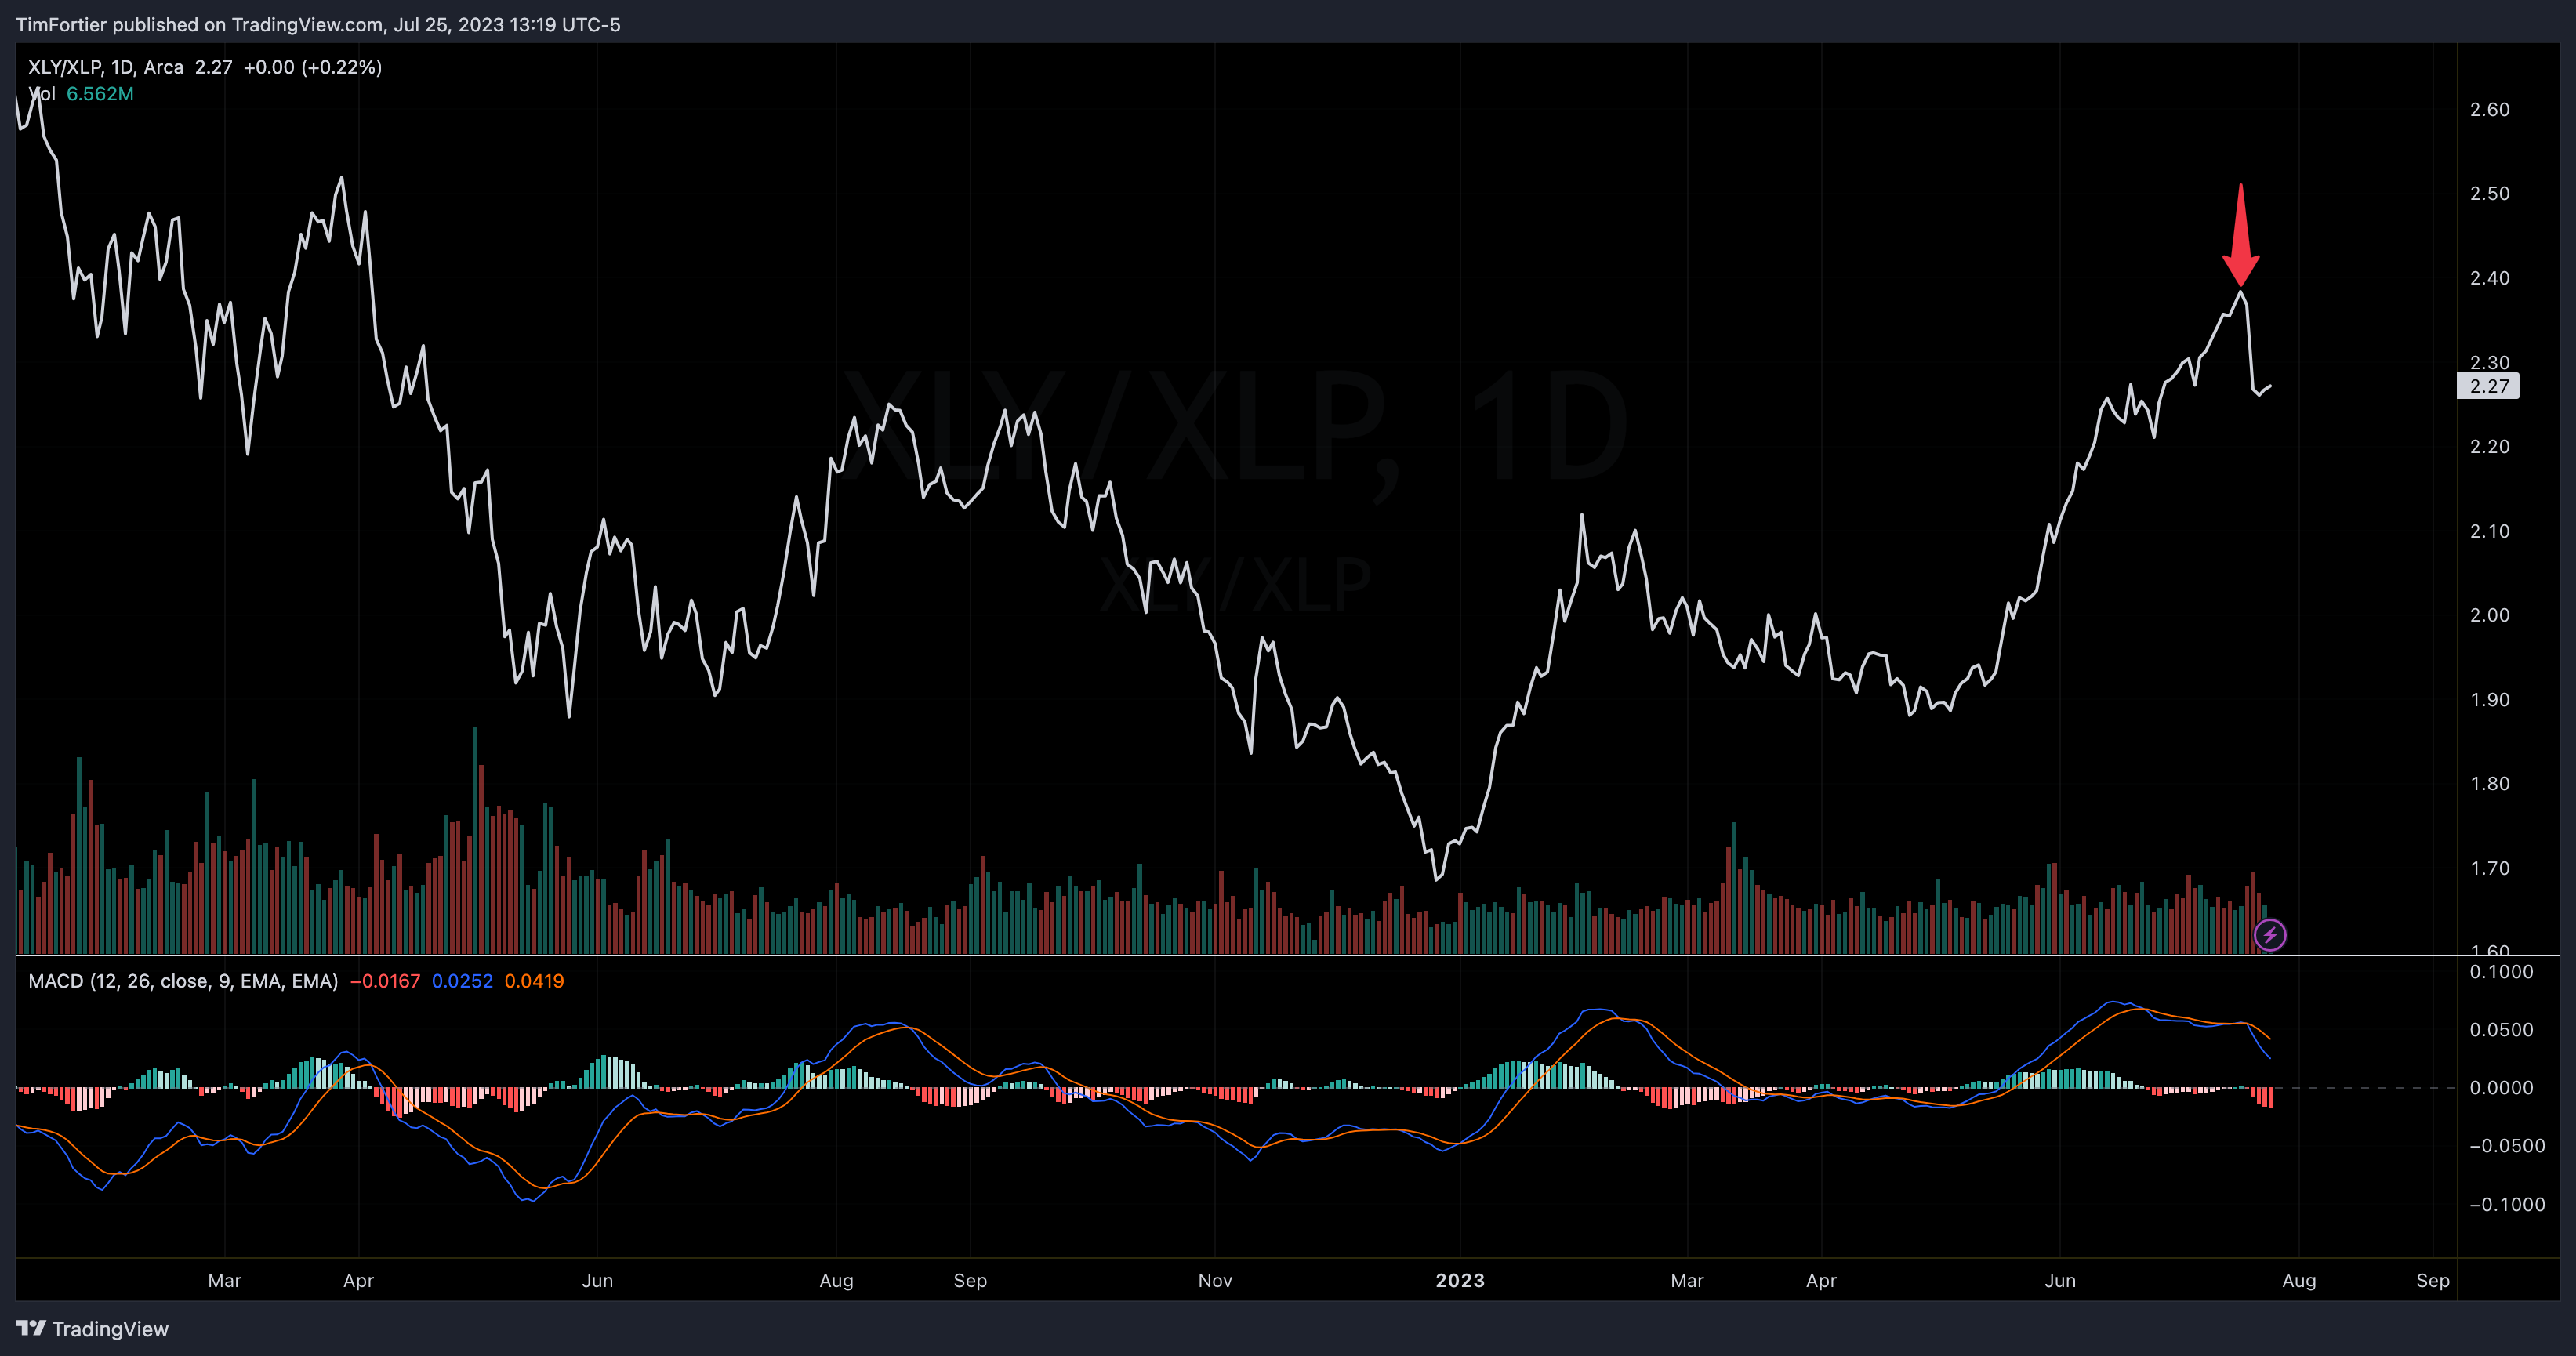
Weekly retail sales are showing a steady decline, and consumer discretionary stocks have suddenly halted their ascent.
Like any good puzzle, the economy presents investors with clues and suggested outcomes.
The current picture of concentrated stock market performance, weakening US consumer demand, weakening European manufacturing, and strengthening inflationary forces indicates investors should be prepared for a period of stagflation.
If you have any questions or have been considering hiring an advisor, then schedule a free consultation with one of our advisors today. There’s no risk or obligation—let's just talk.
Tags

Free Guide: How to Find the Best Advisor for You
Get our absolutely free guide that covers different types of advisory services you'll encounter, differences between RIAs and broker-dealers, questions you’ll want to ask when interviewing advisors, and data any good financial advisor should know about you and your portfolio.
