
Related Blogs
August 1, 2023 | Avalon Team
Another month is in the books for investors.
Across the market, stock averages were up for the month of July with the Nasdaq edging out the other indices.
The big winner for July though was not stocks, but commodities.
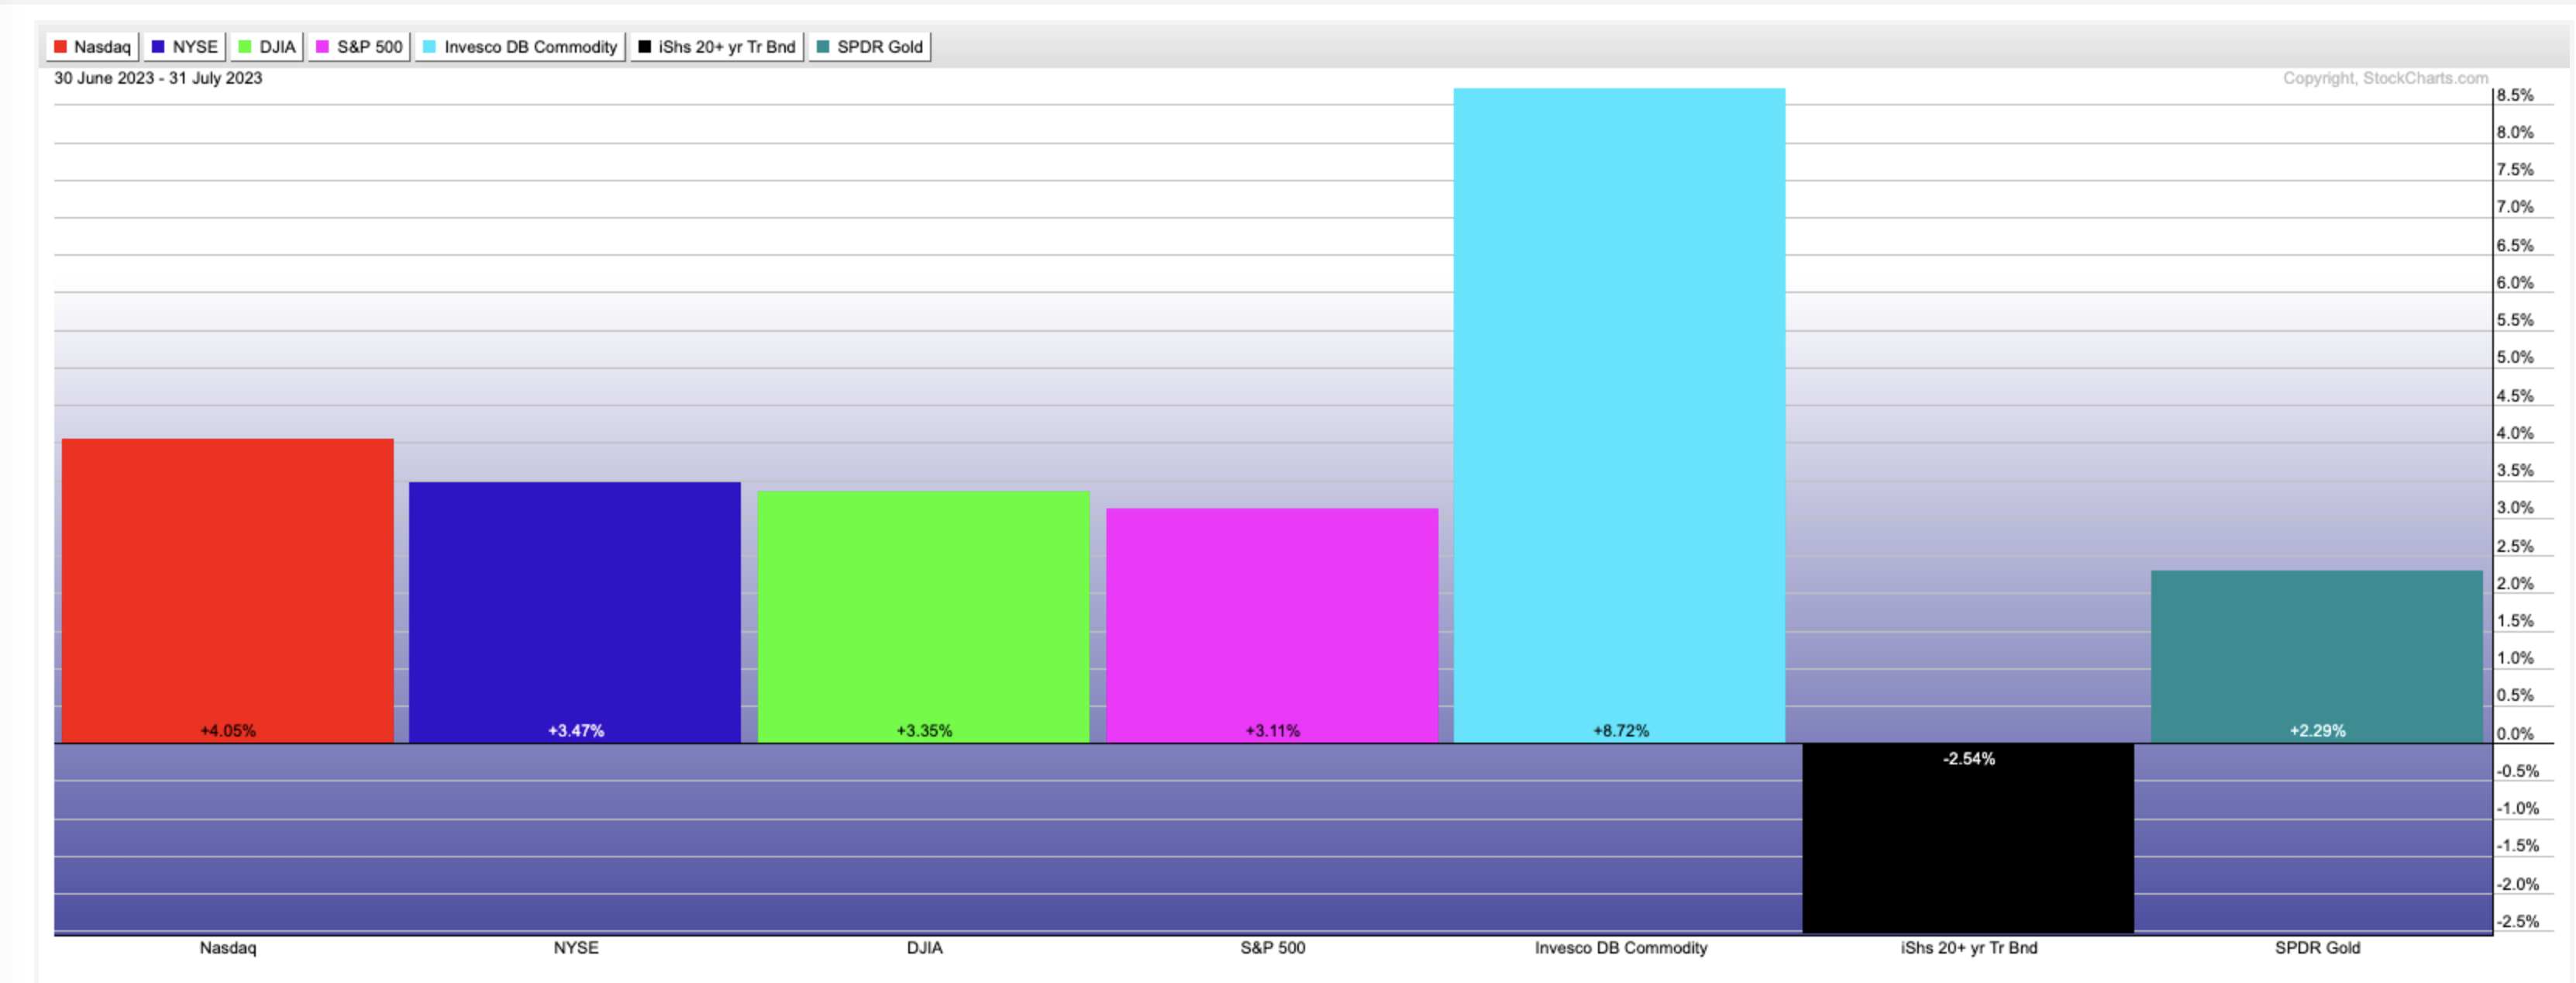
Invesco DB Commodity (DBC) returned 8.721% during the month of July, over twice as good as the best-performing equity index.
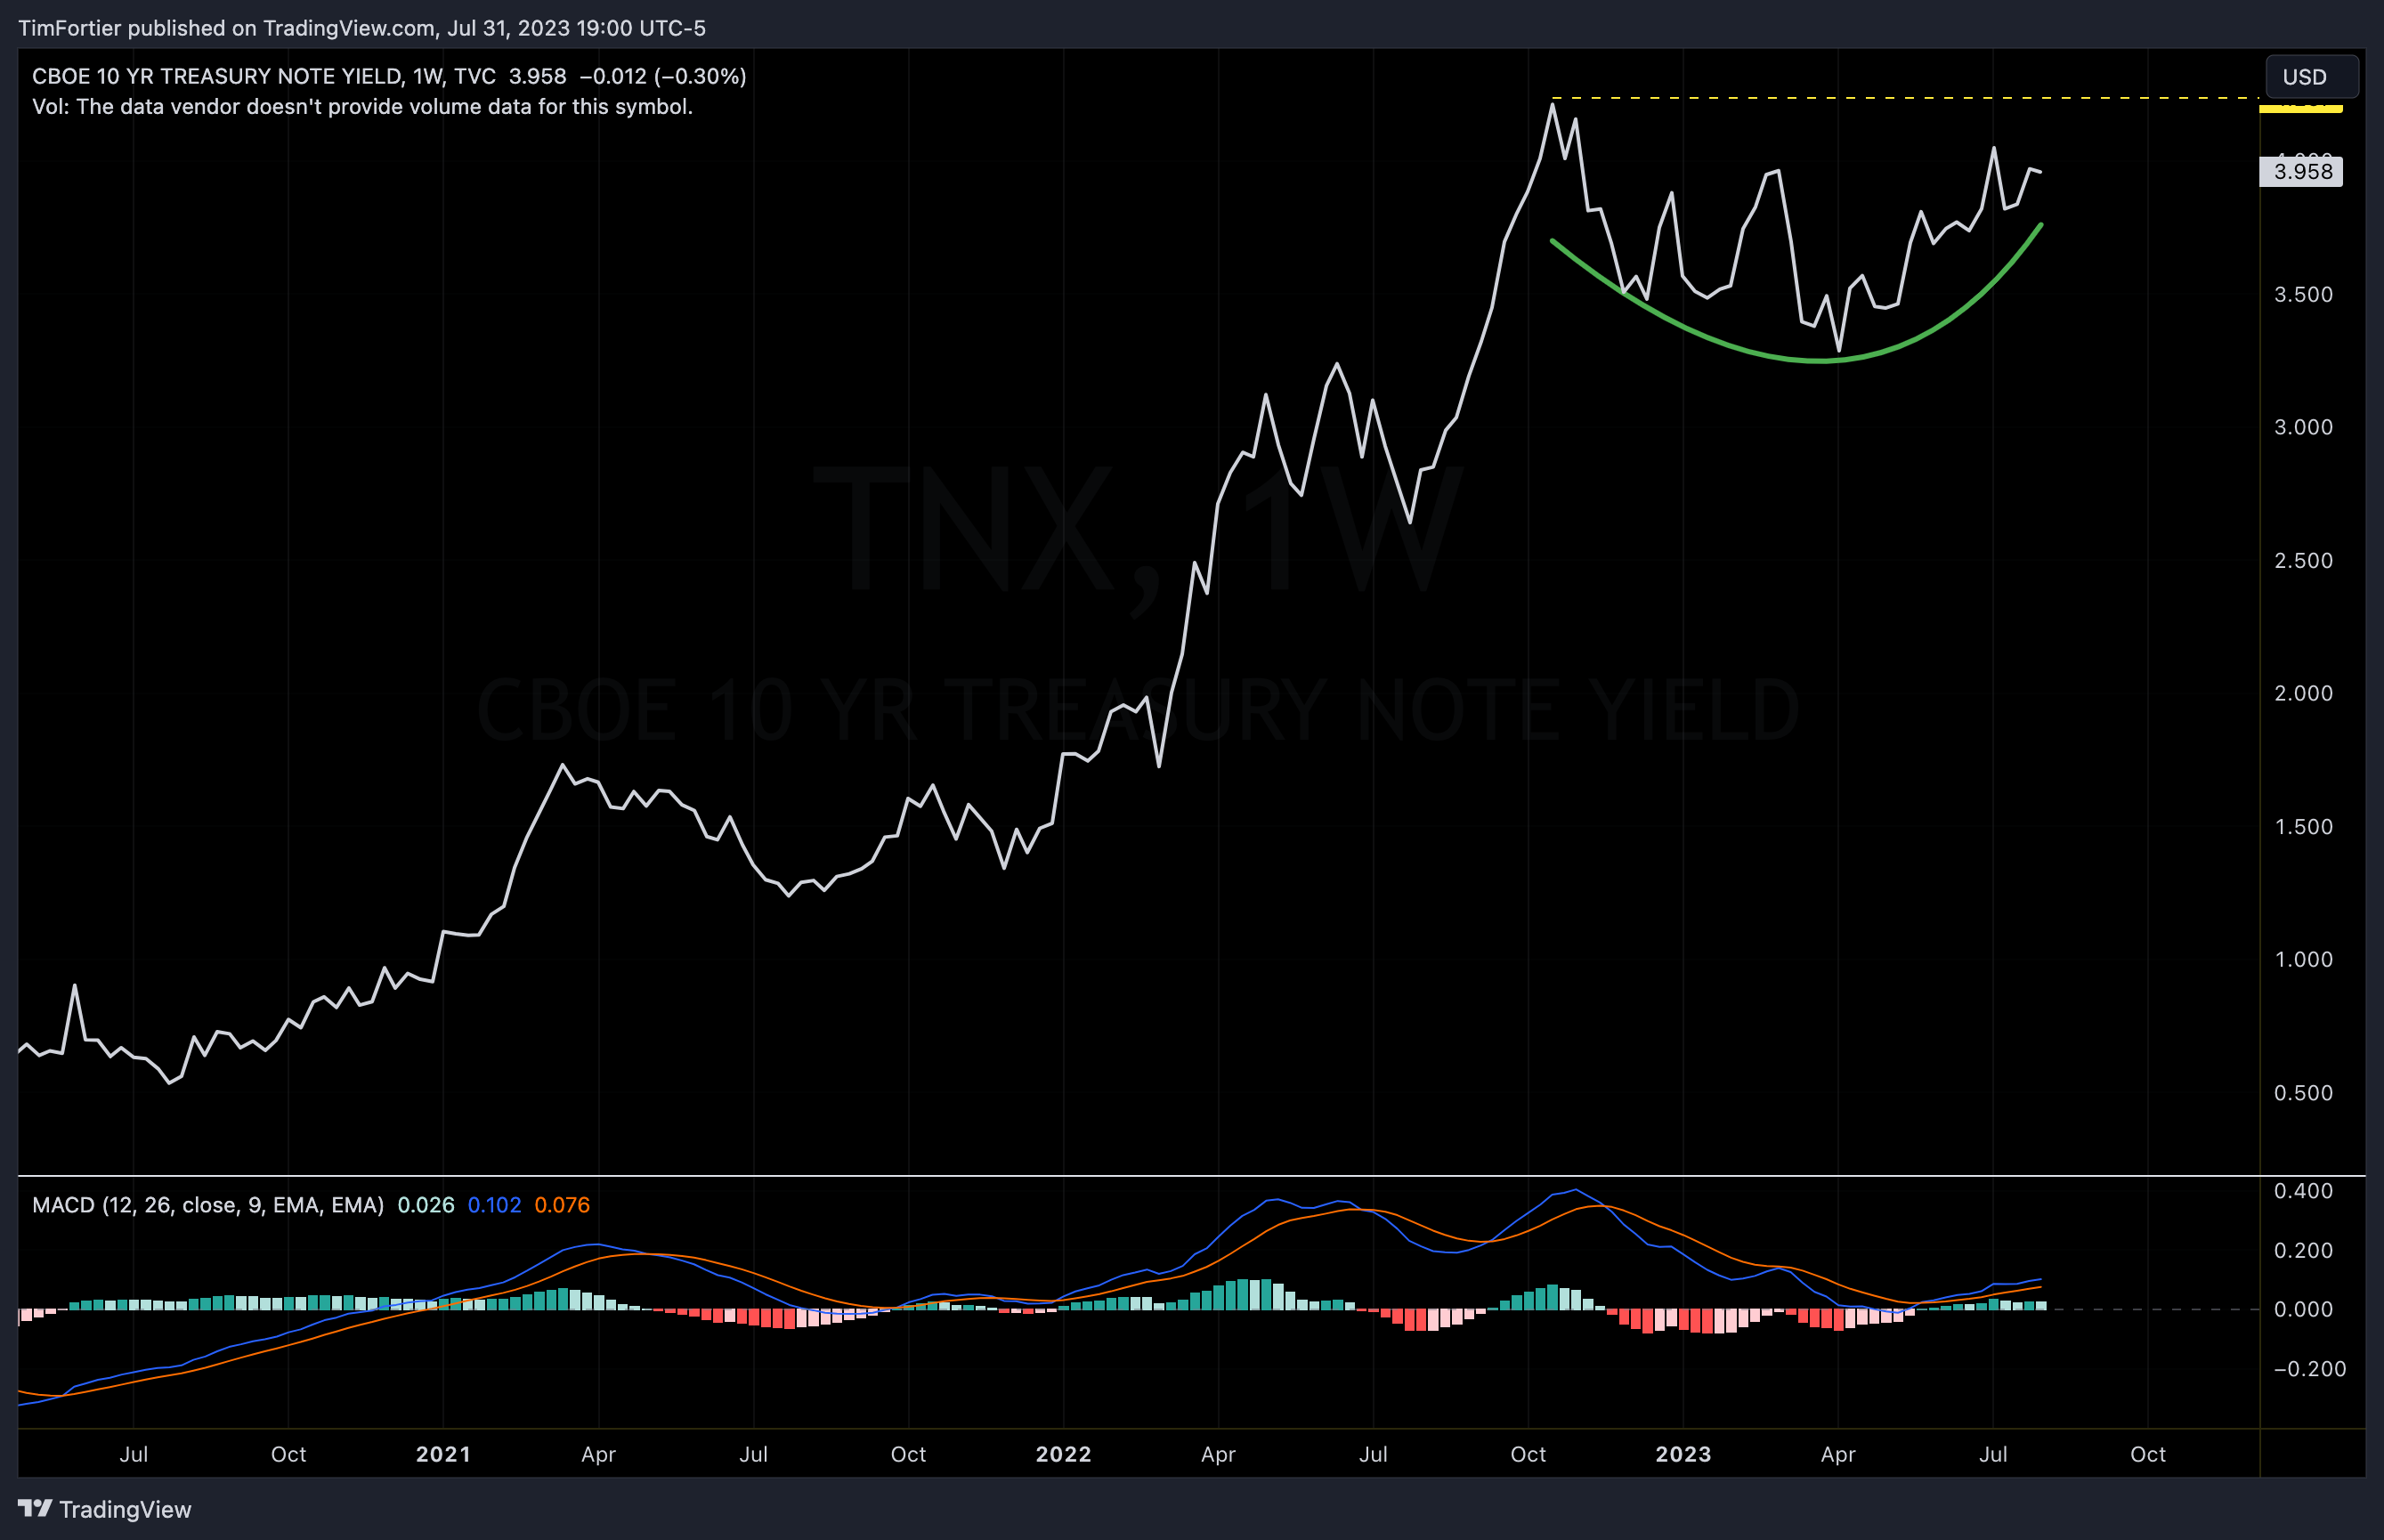
Long-term treasuries suffered a loss and remain relatively weak overall. Last week, the Fed hiked key interest rates to 5.25-5.5%, the highest in 22 years.
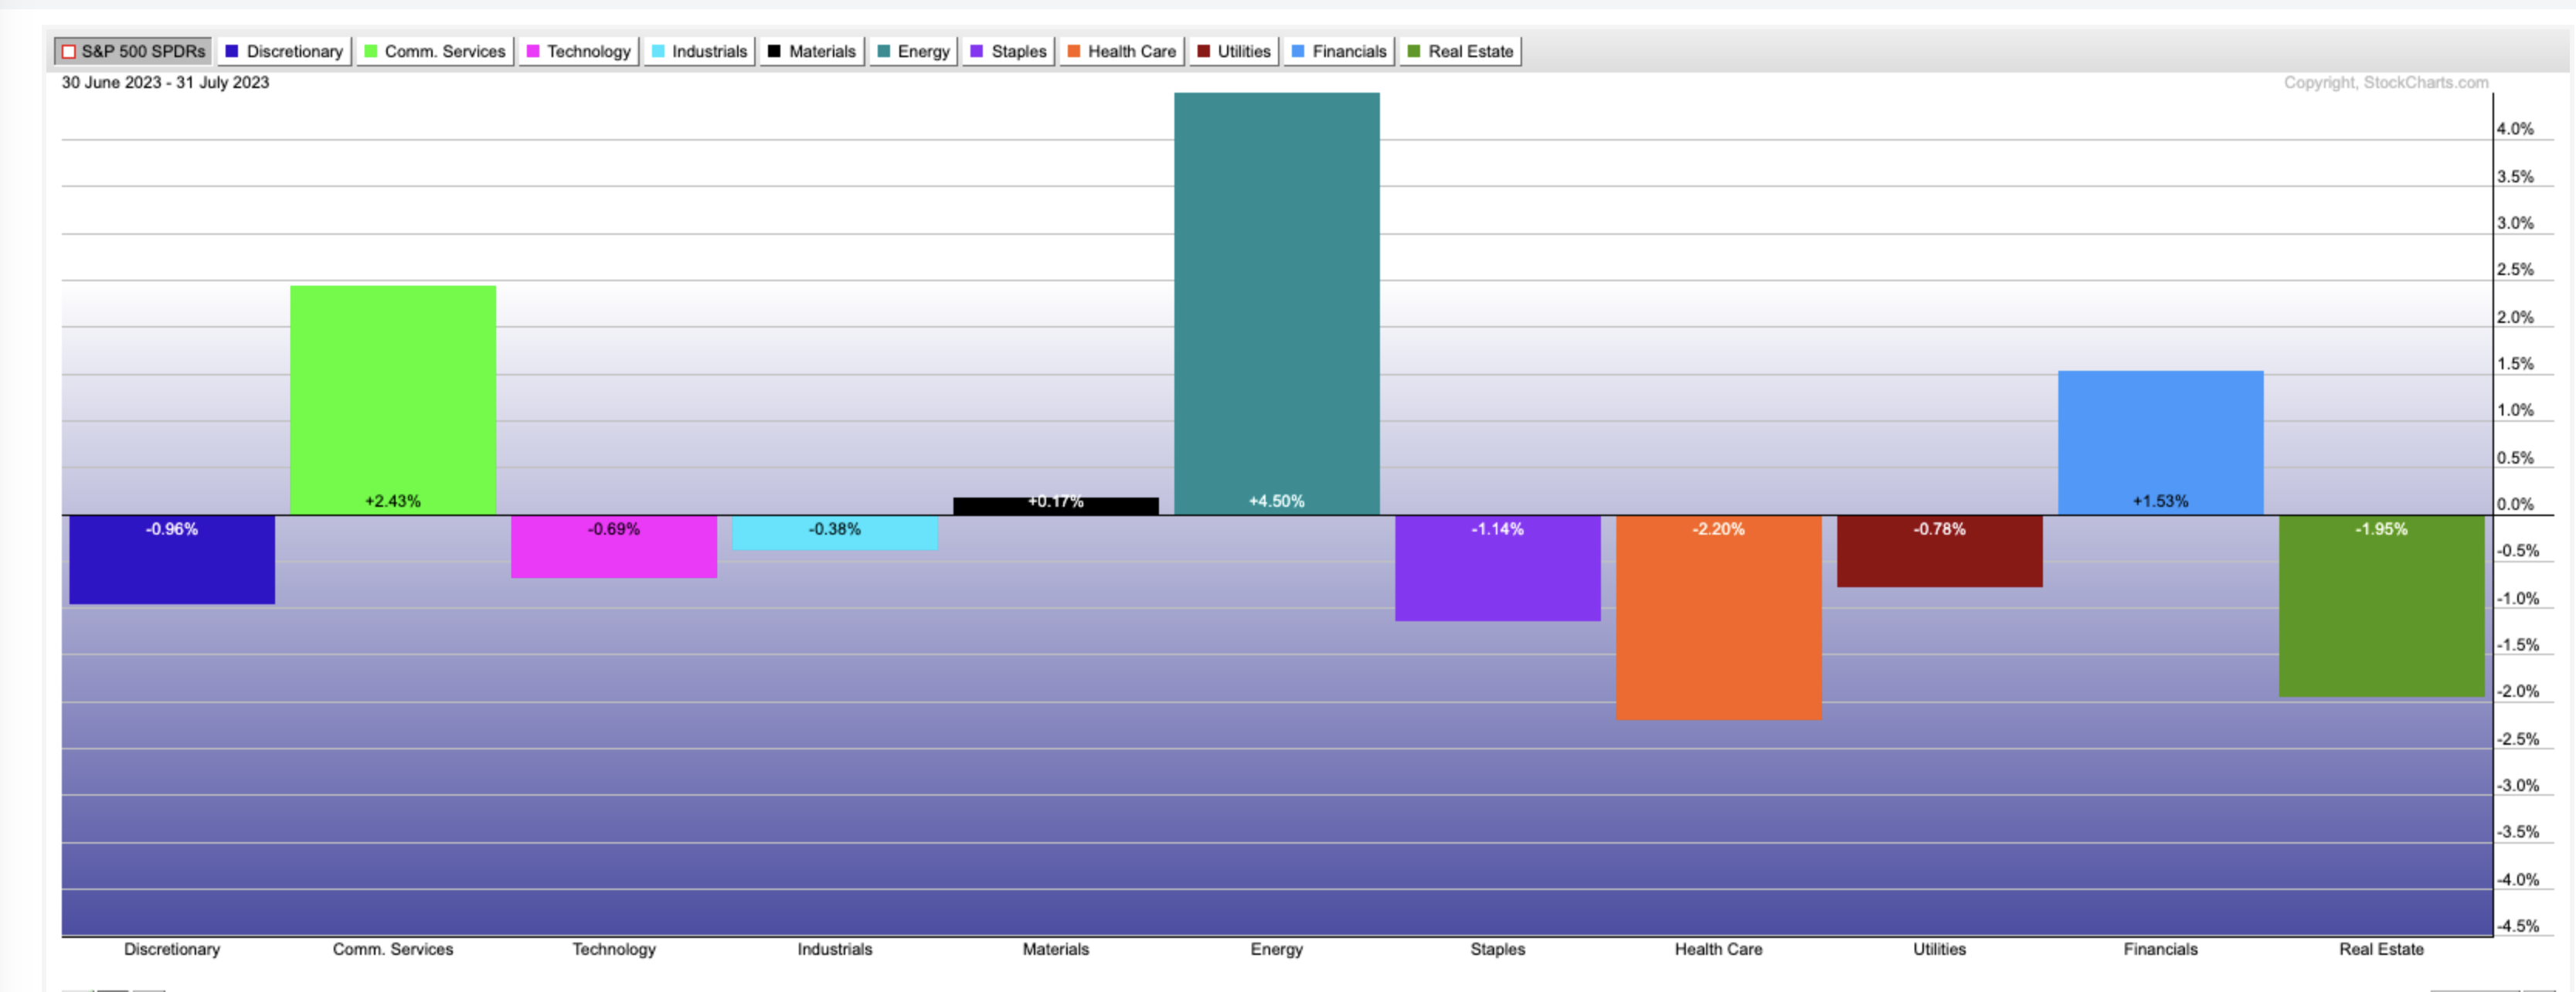
With commodities being the best-performing asset class, it should be no surprise that Energy was the best-performing sector.
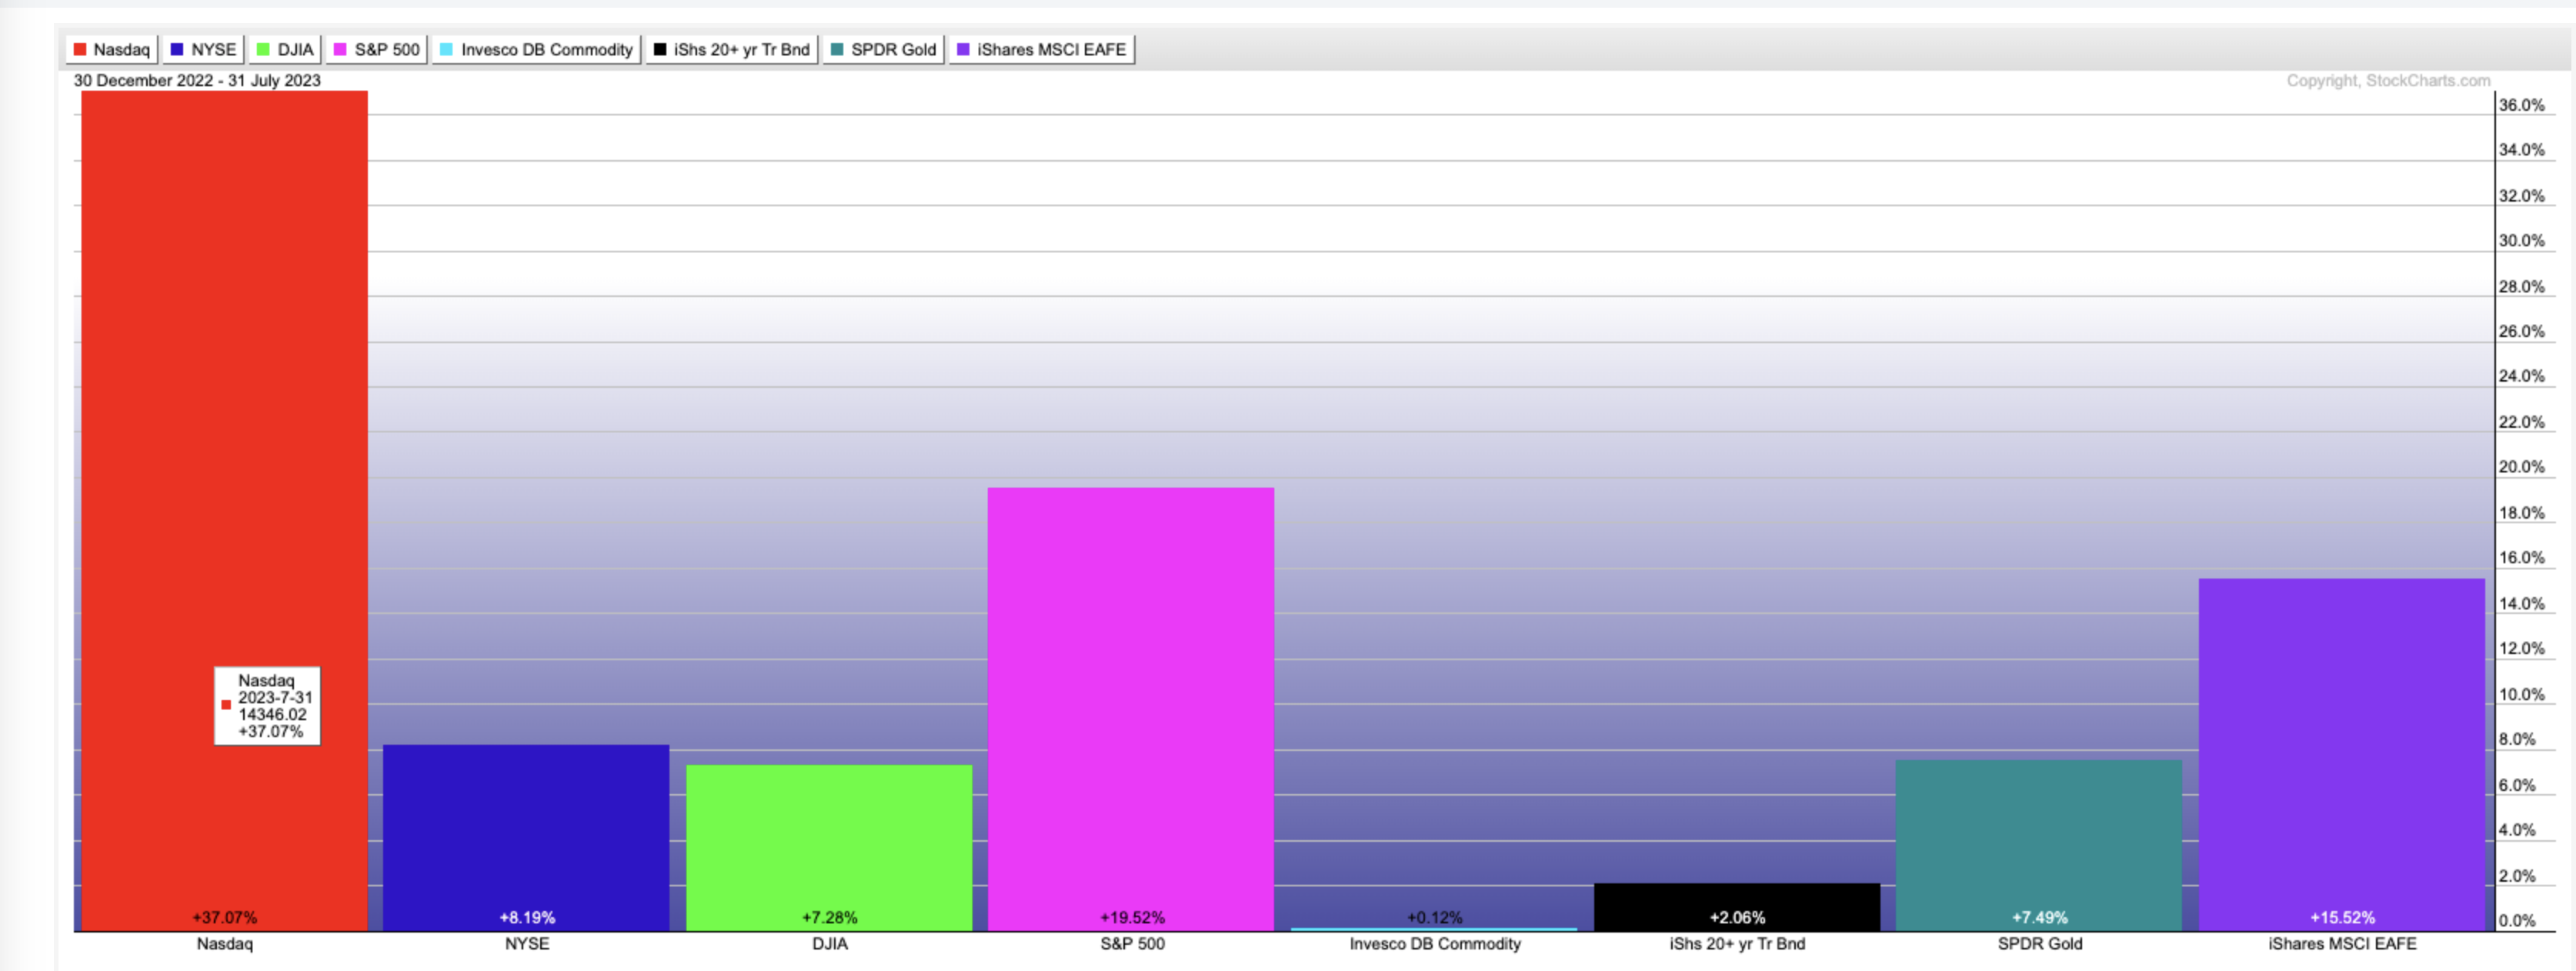
On a YTD basis, Technology stocks remain the dominant winner.
Technology has led all of 2023, and currently, the Nasdaq is ahead of the SP 500 by 2:1.
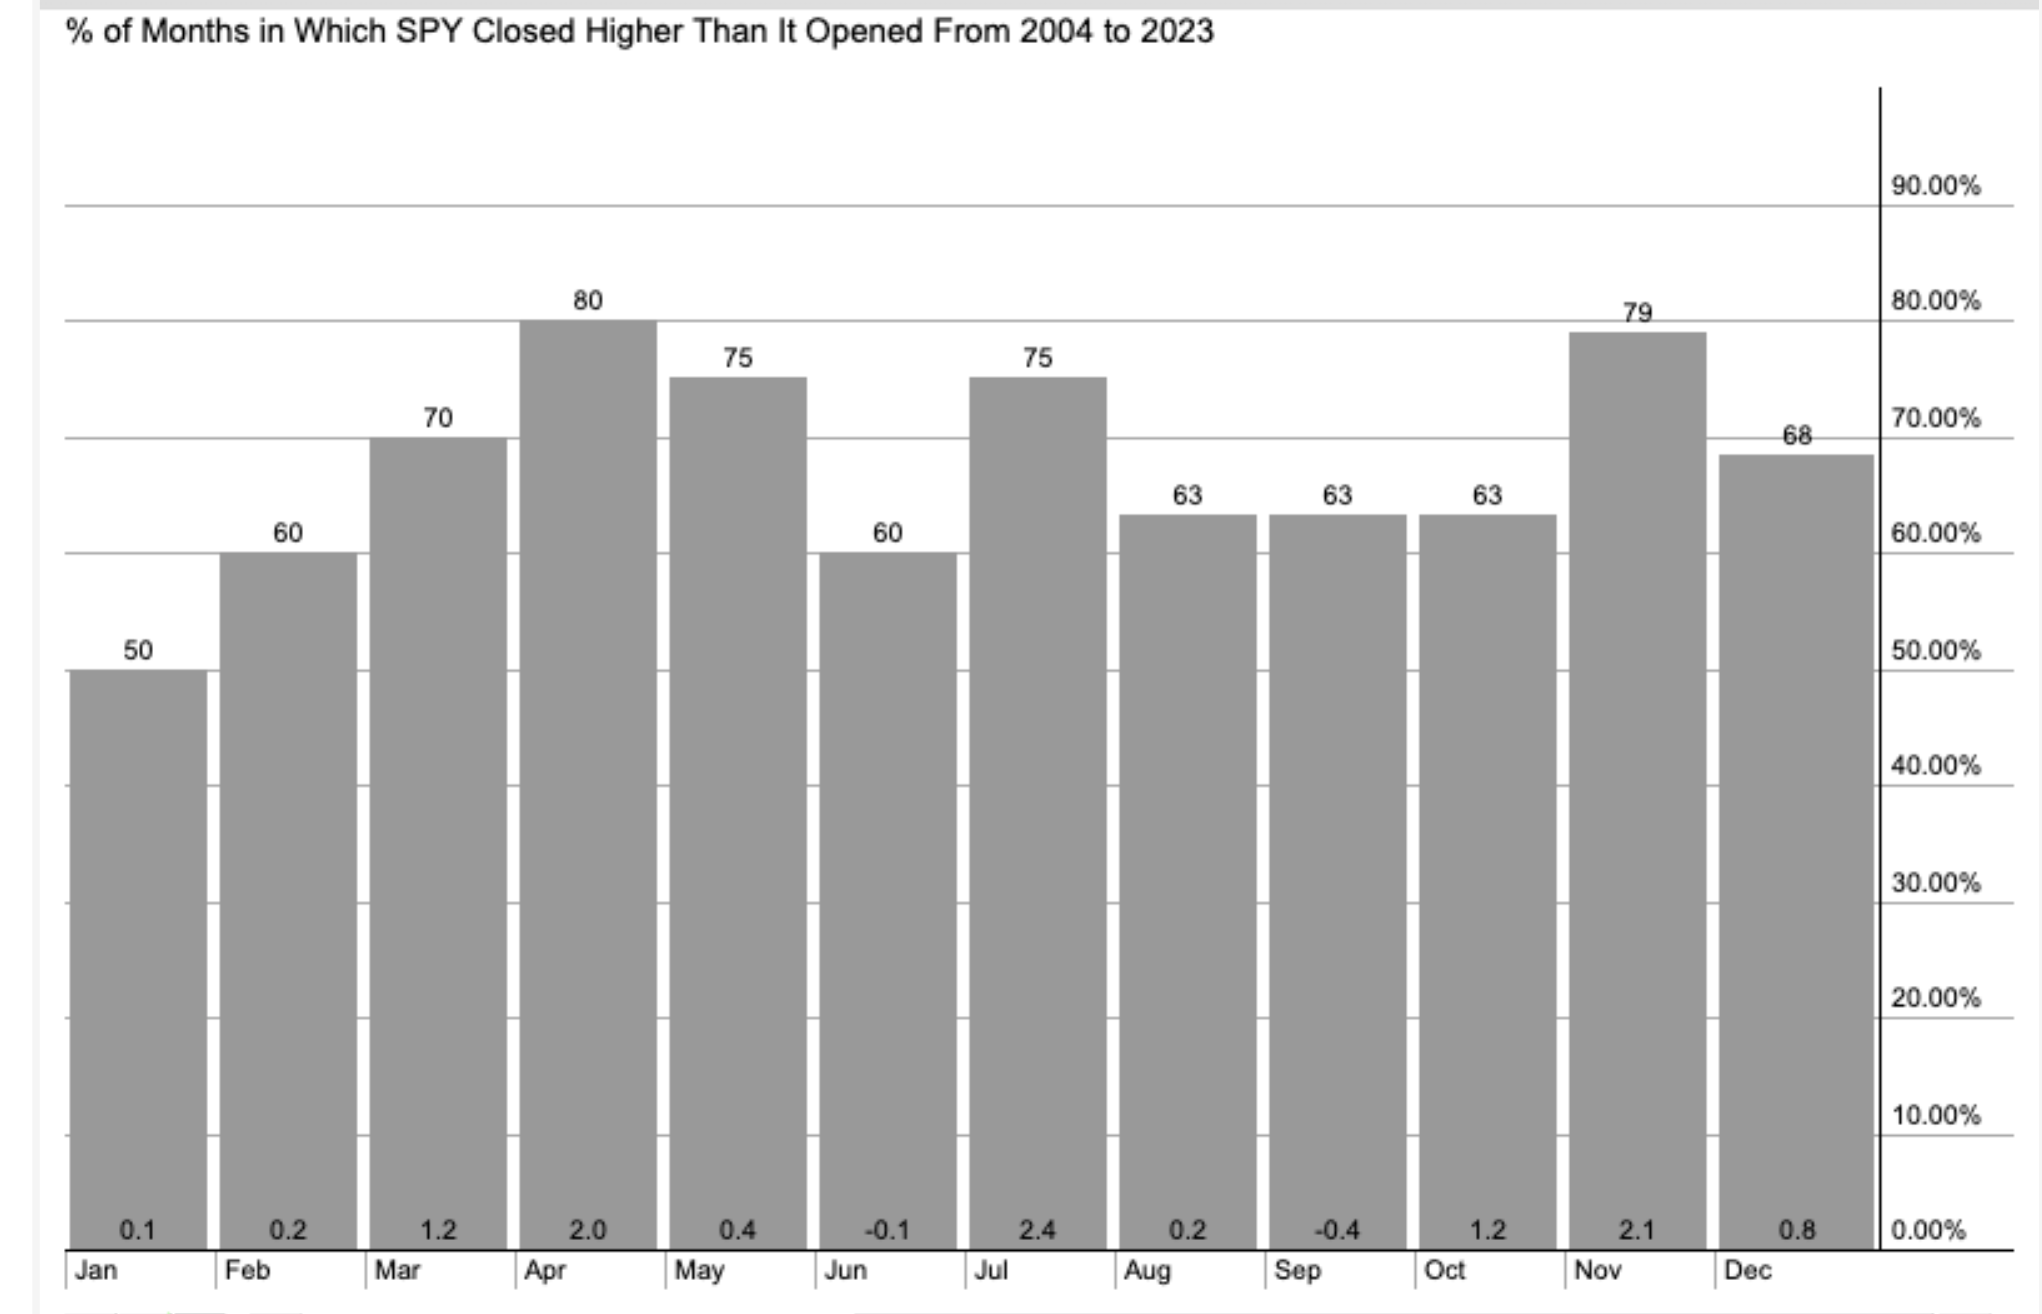
What can investors expect for August?
Seasonally, in the past 20 years, the SPY has closed up 63% of the time for the month of August.
Looking at a Relative Rotation Graph (RRG) may provide some clues for what to expect on a sector level.
RRG charts visually show how a given set of securities are performing either relative to themselves or a given benchmark, over a specified period of time.
The chart below shows each of the S&P 500 sectors with a 5-week trail of relative performance.
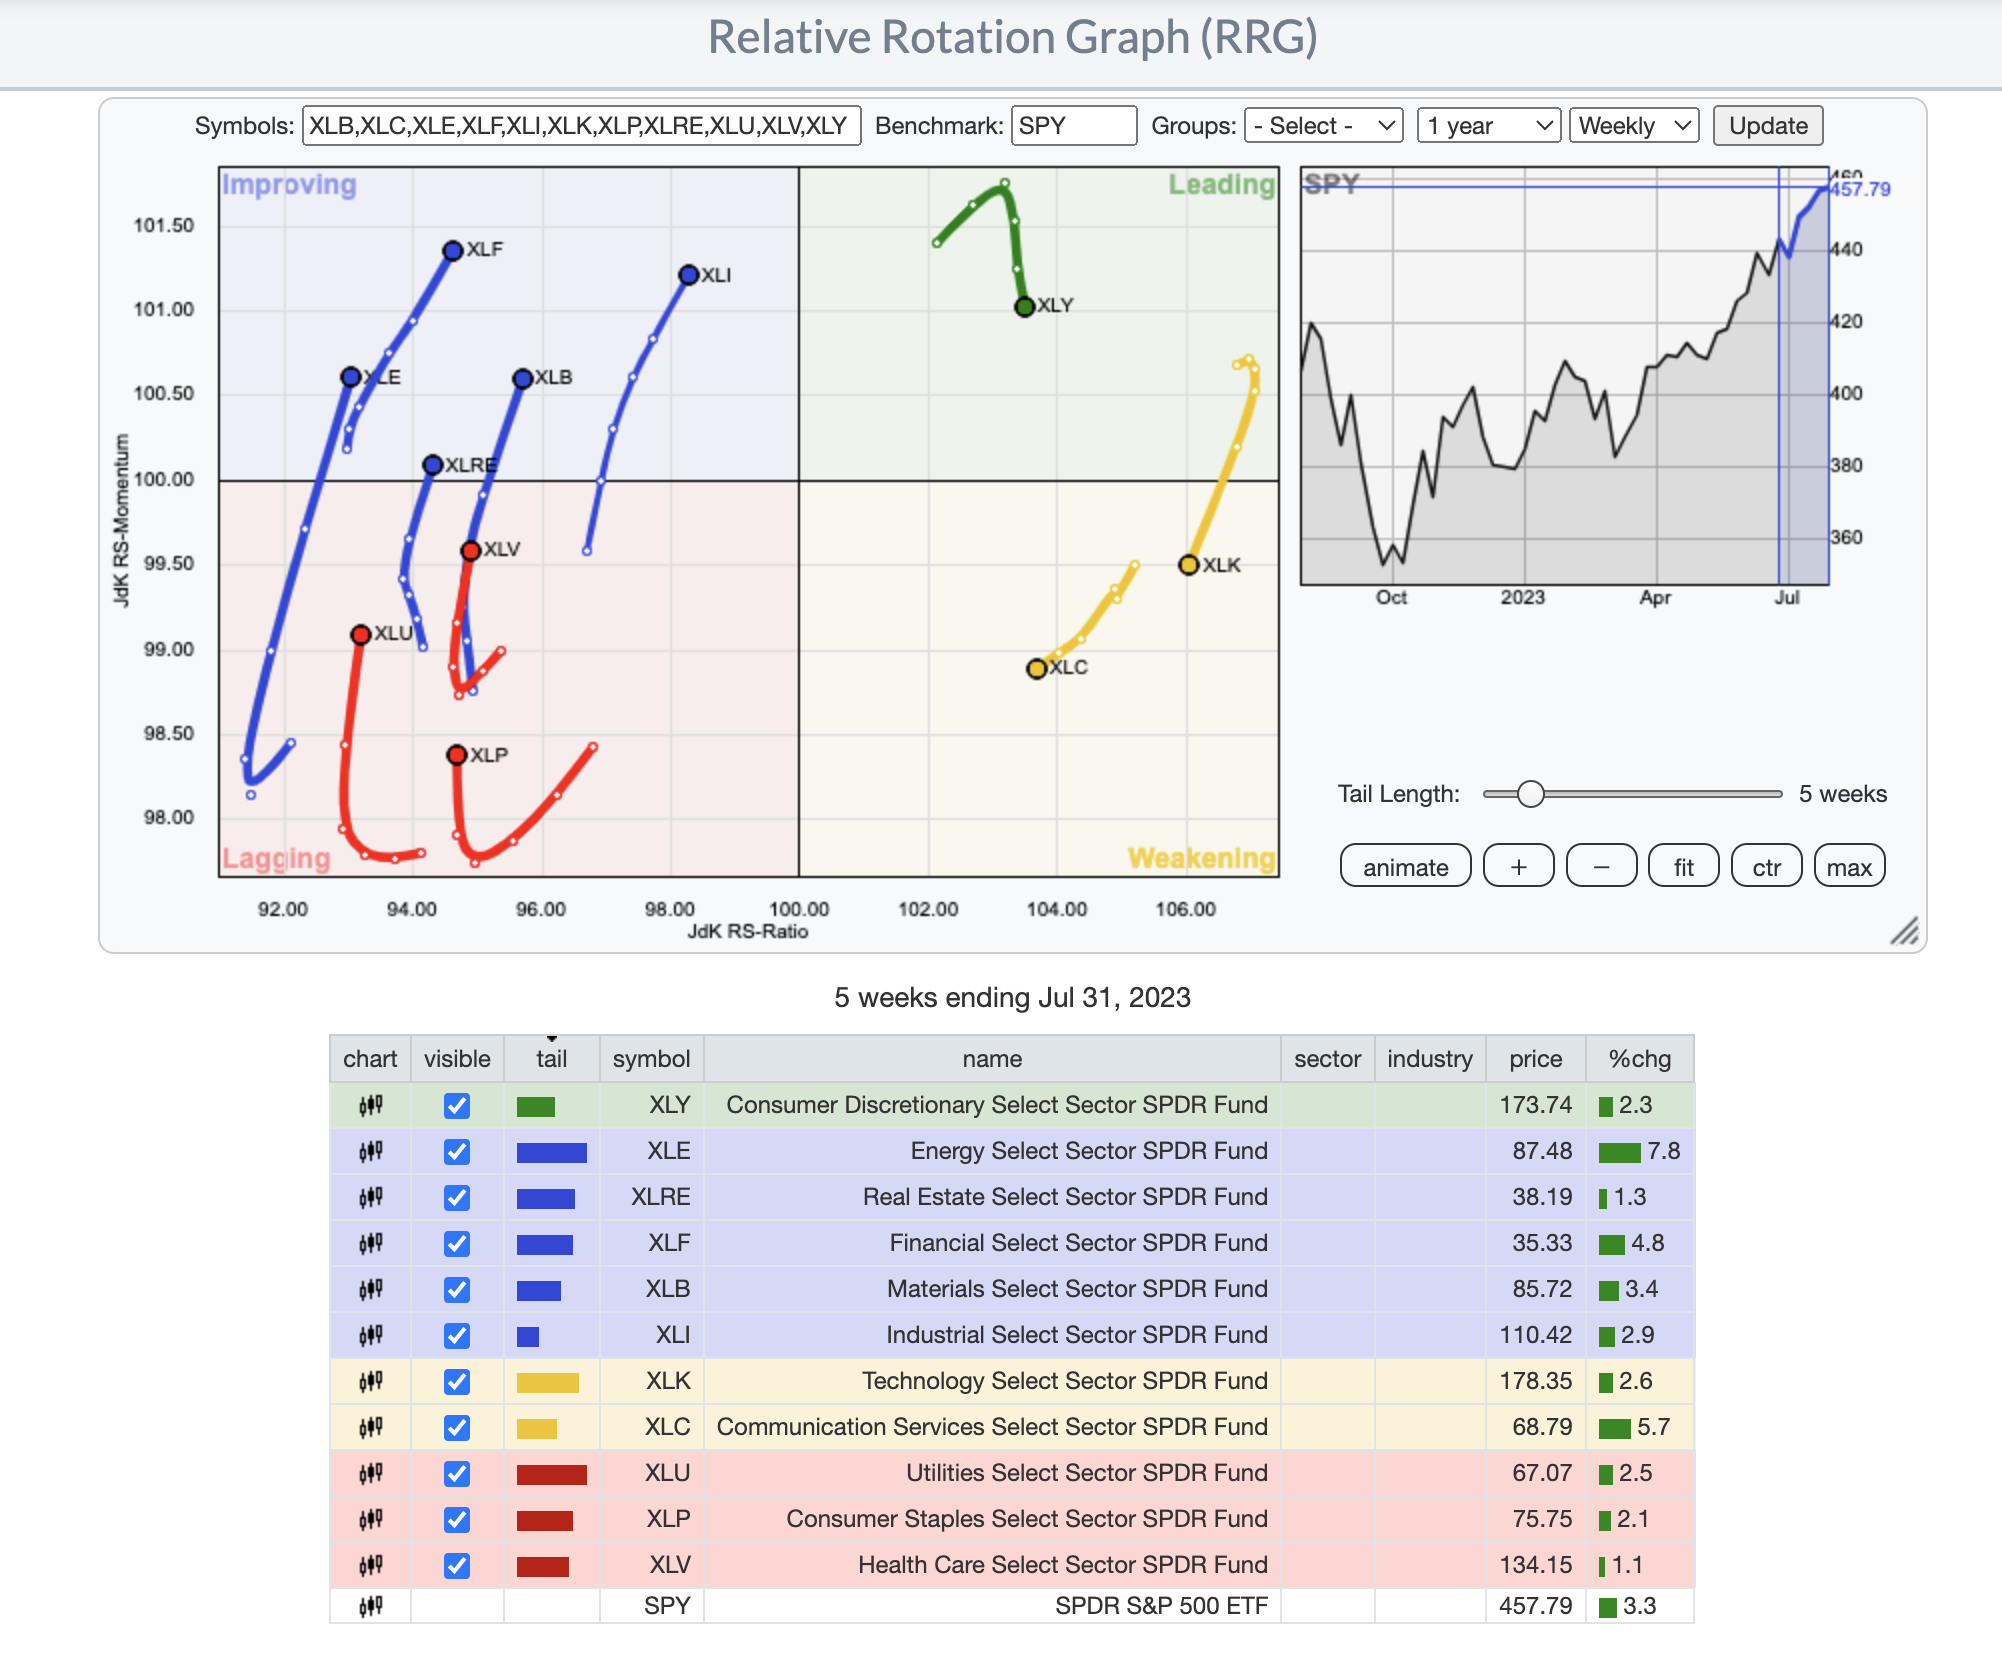
From this, it is easy to spot how Energy (XLE), Industrials (XLI), and Material (XLB) have shown great improvement, while Communication (XLC) and Technology (XLV) are displaying weakening performance.
In many ways, this is good news for investors as this signifies a broadening of the current stock market rally.
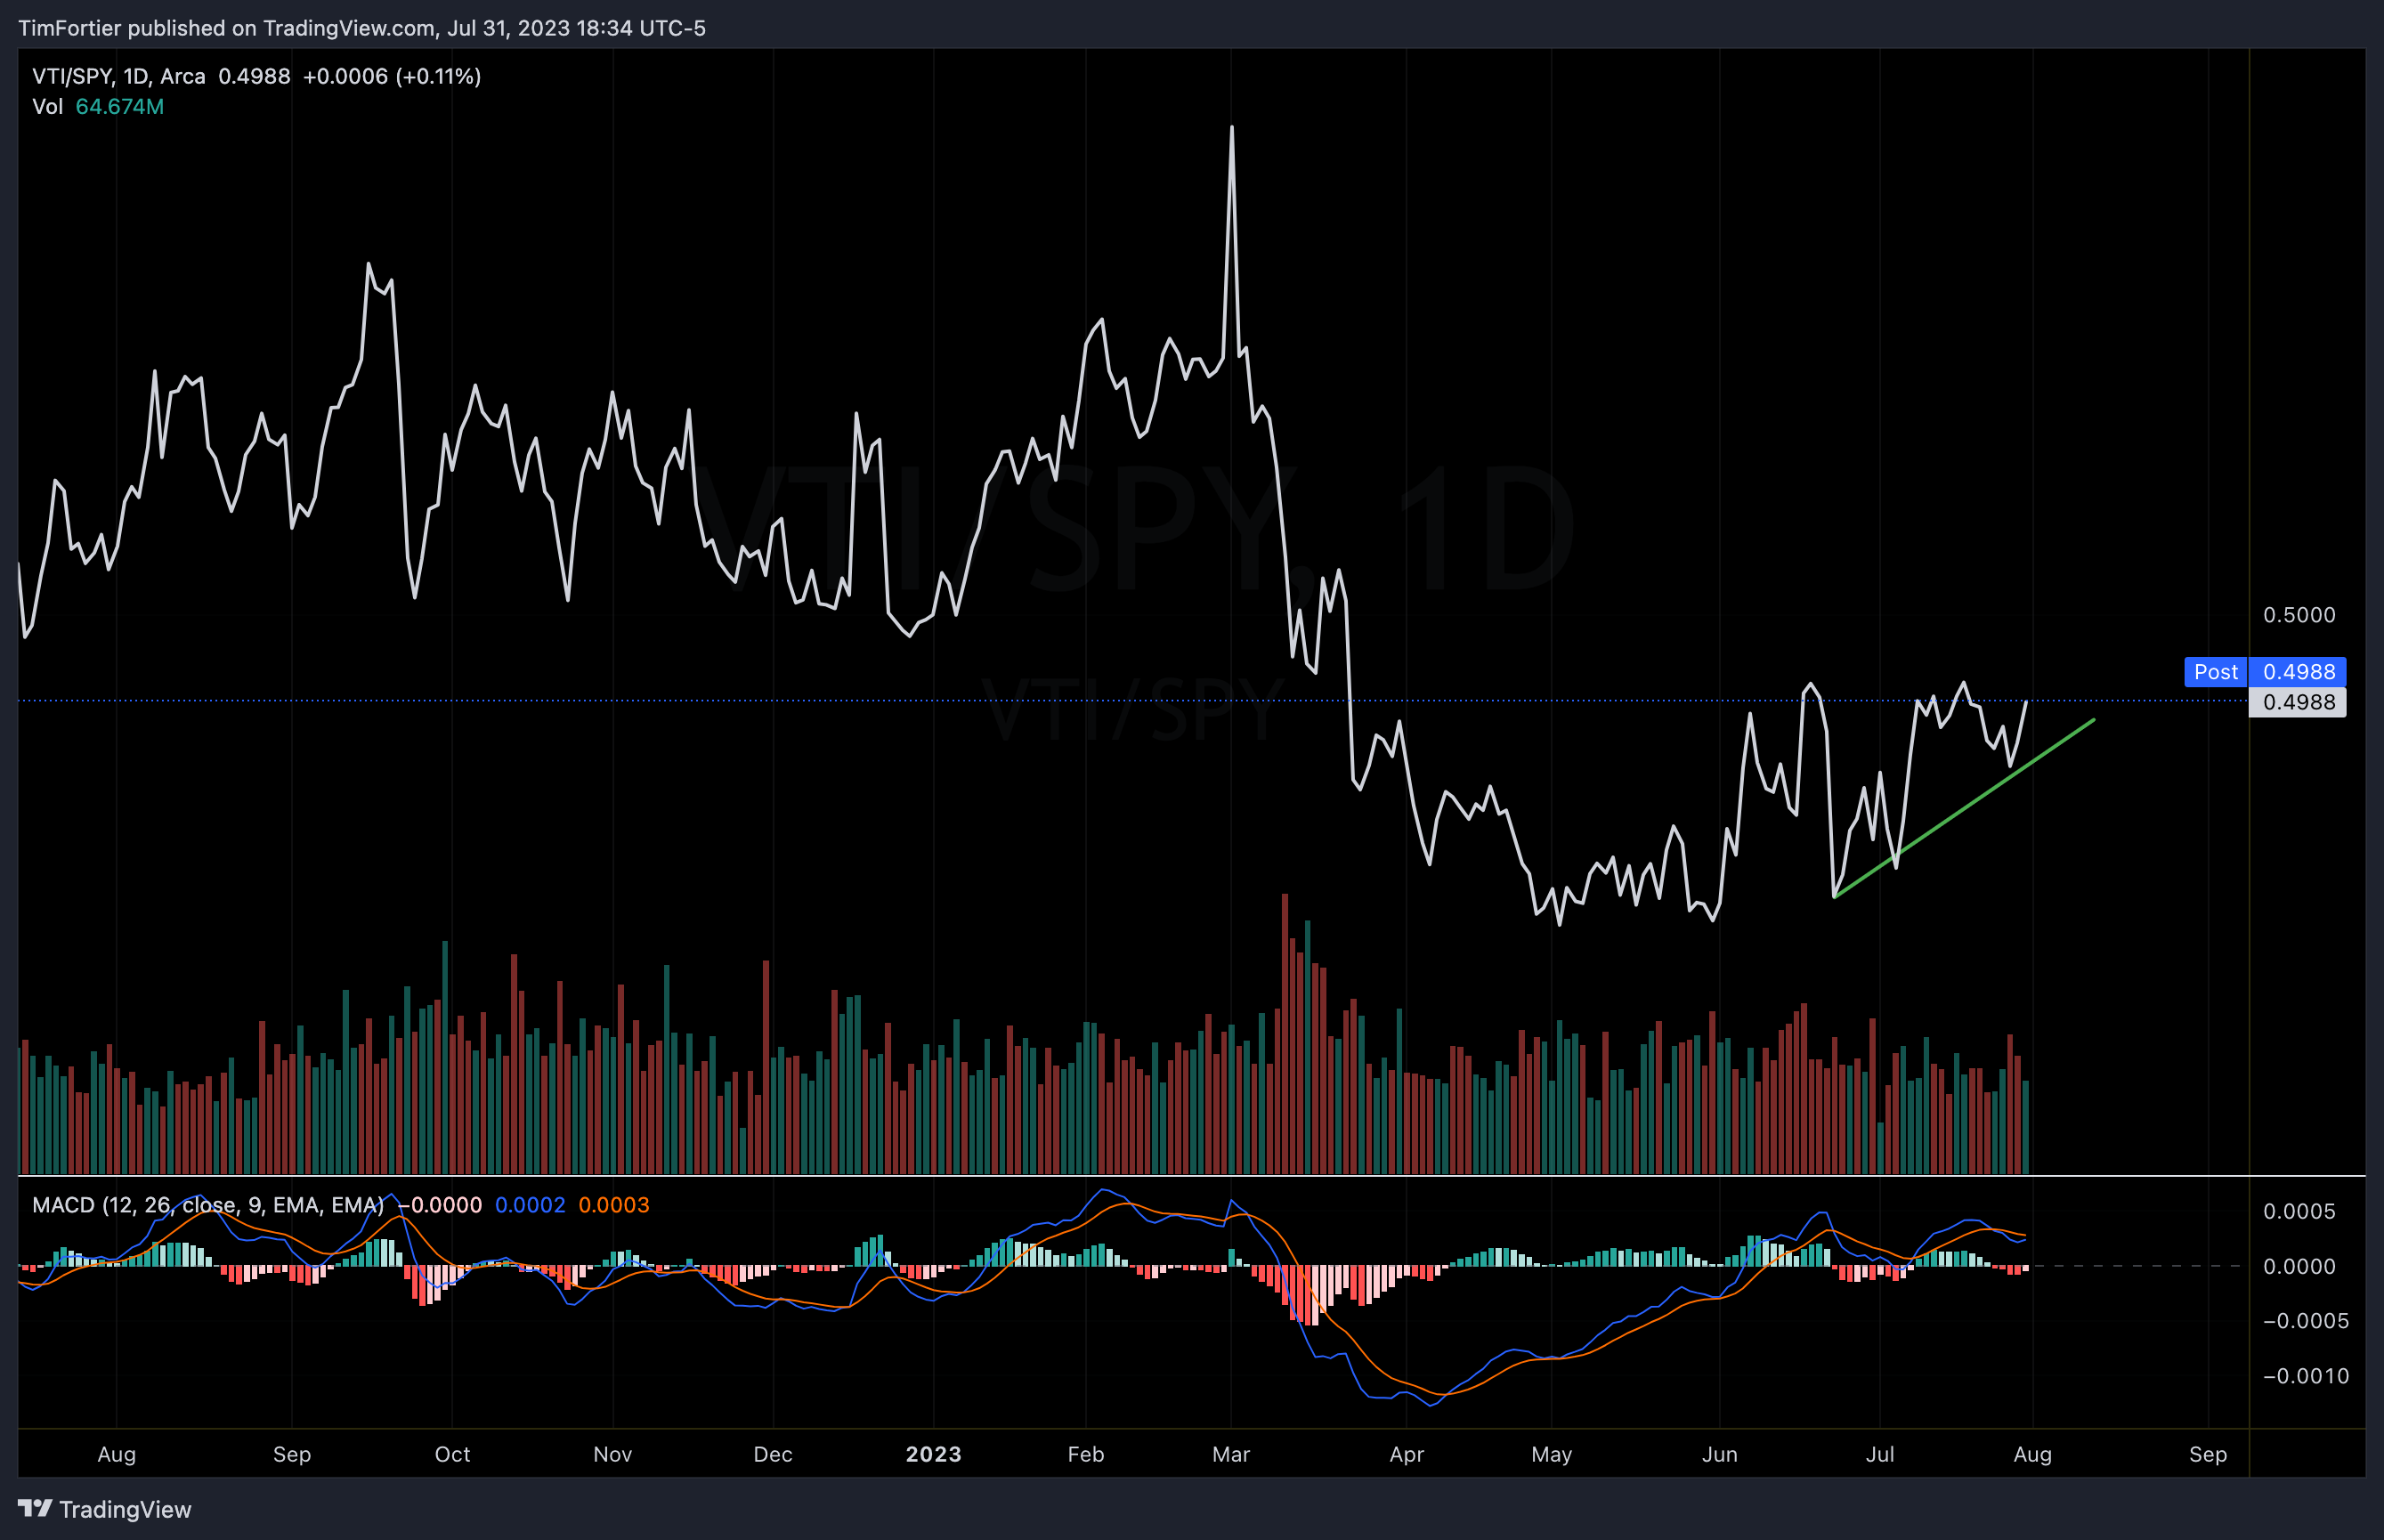
A ratio chart comparing the Vanguard Total Market (VTI) to the S&P 500 SPDR (SPY) also indicates how recently, the broader VTI has started to perform better.
Finally, a look “under the hood” shows that the percentage of stocks above their 200-day moving average on the NYSE has been steadily improving.
The following chart displays two moving averages of that percentage that can be considered bullish when the short-term moving average is above the longer-term moving average.
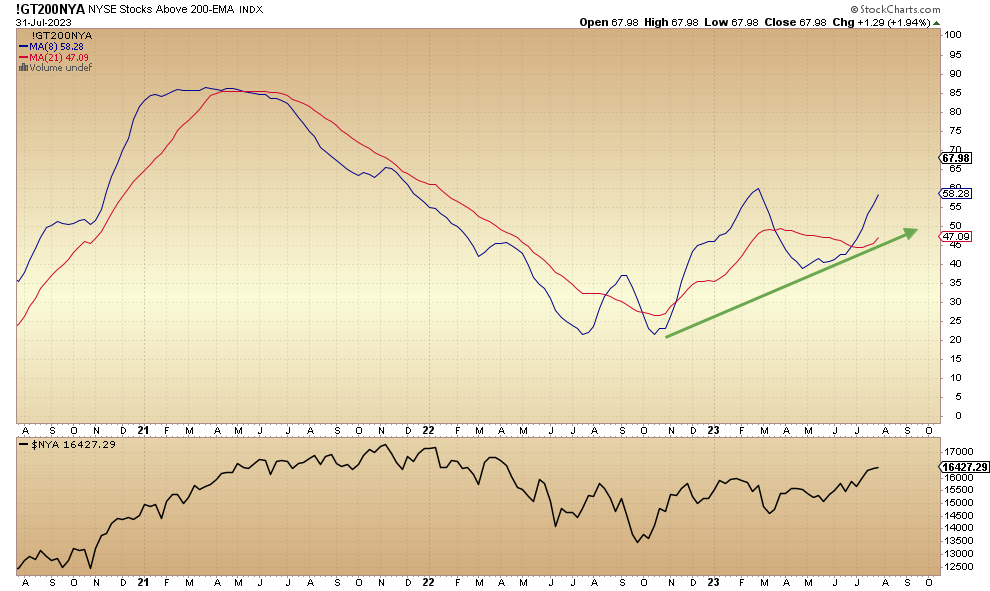
Since the 200-day moving average is considered by many institutions as the “gold standard” for defining whether a stock trend is healthy or not, this is indicating an improving, healthy market as 67% of stocks are above their respective 200DMA.
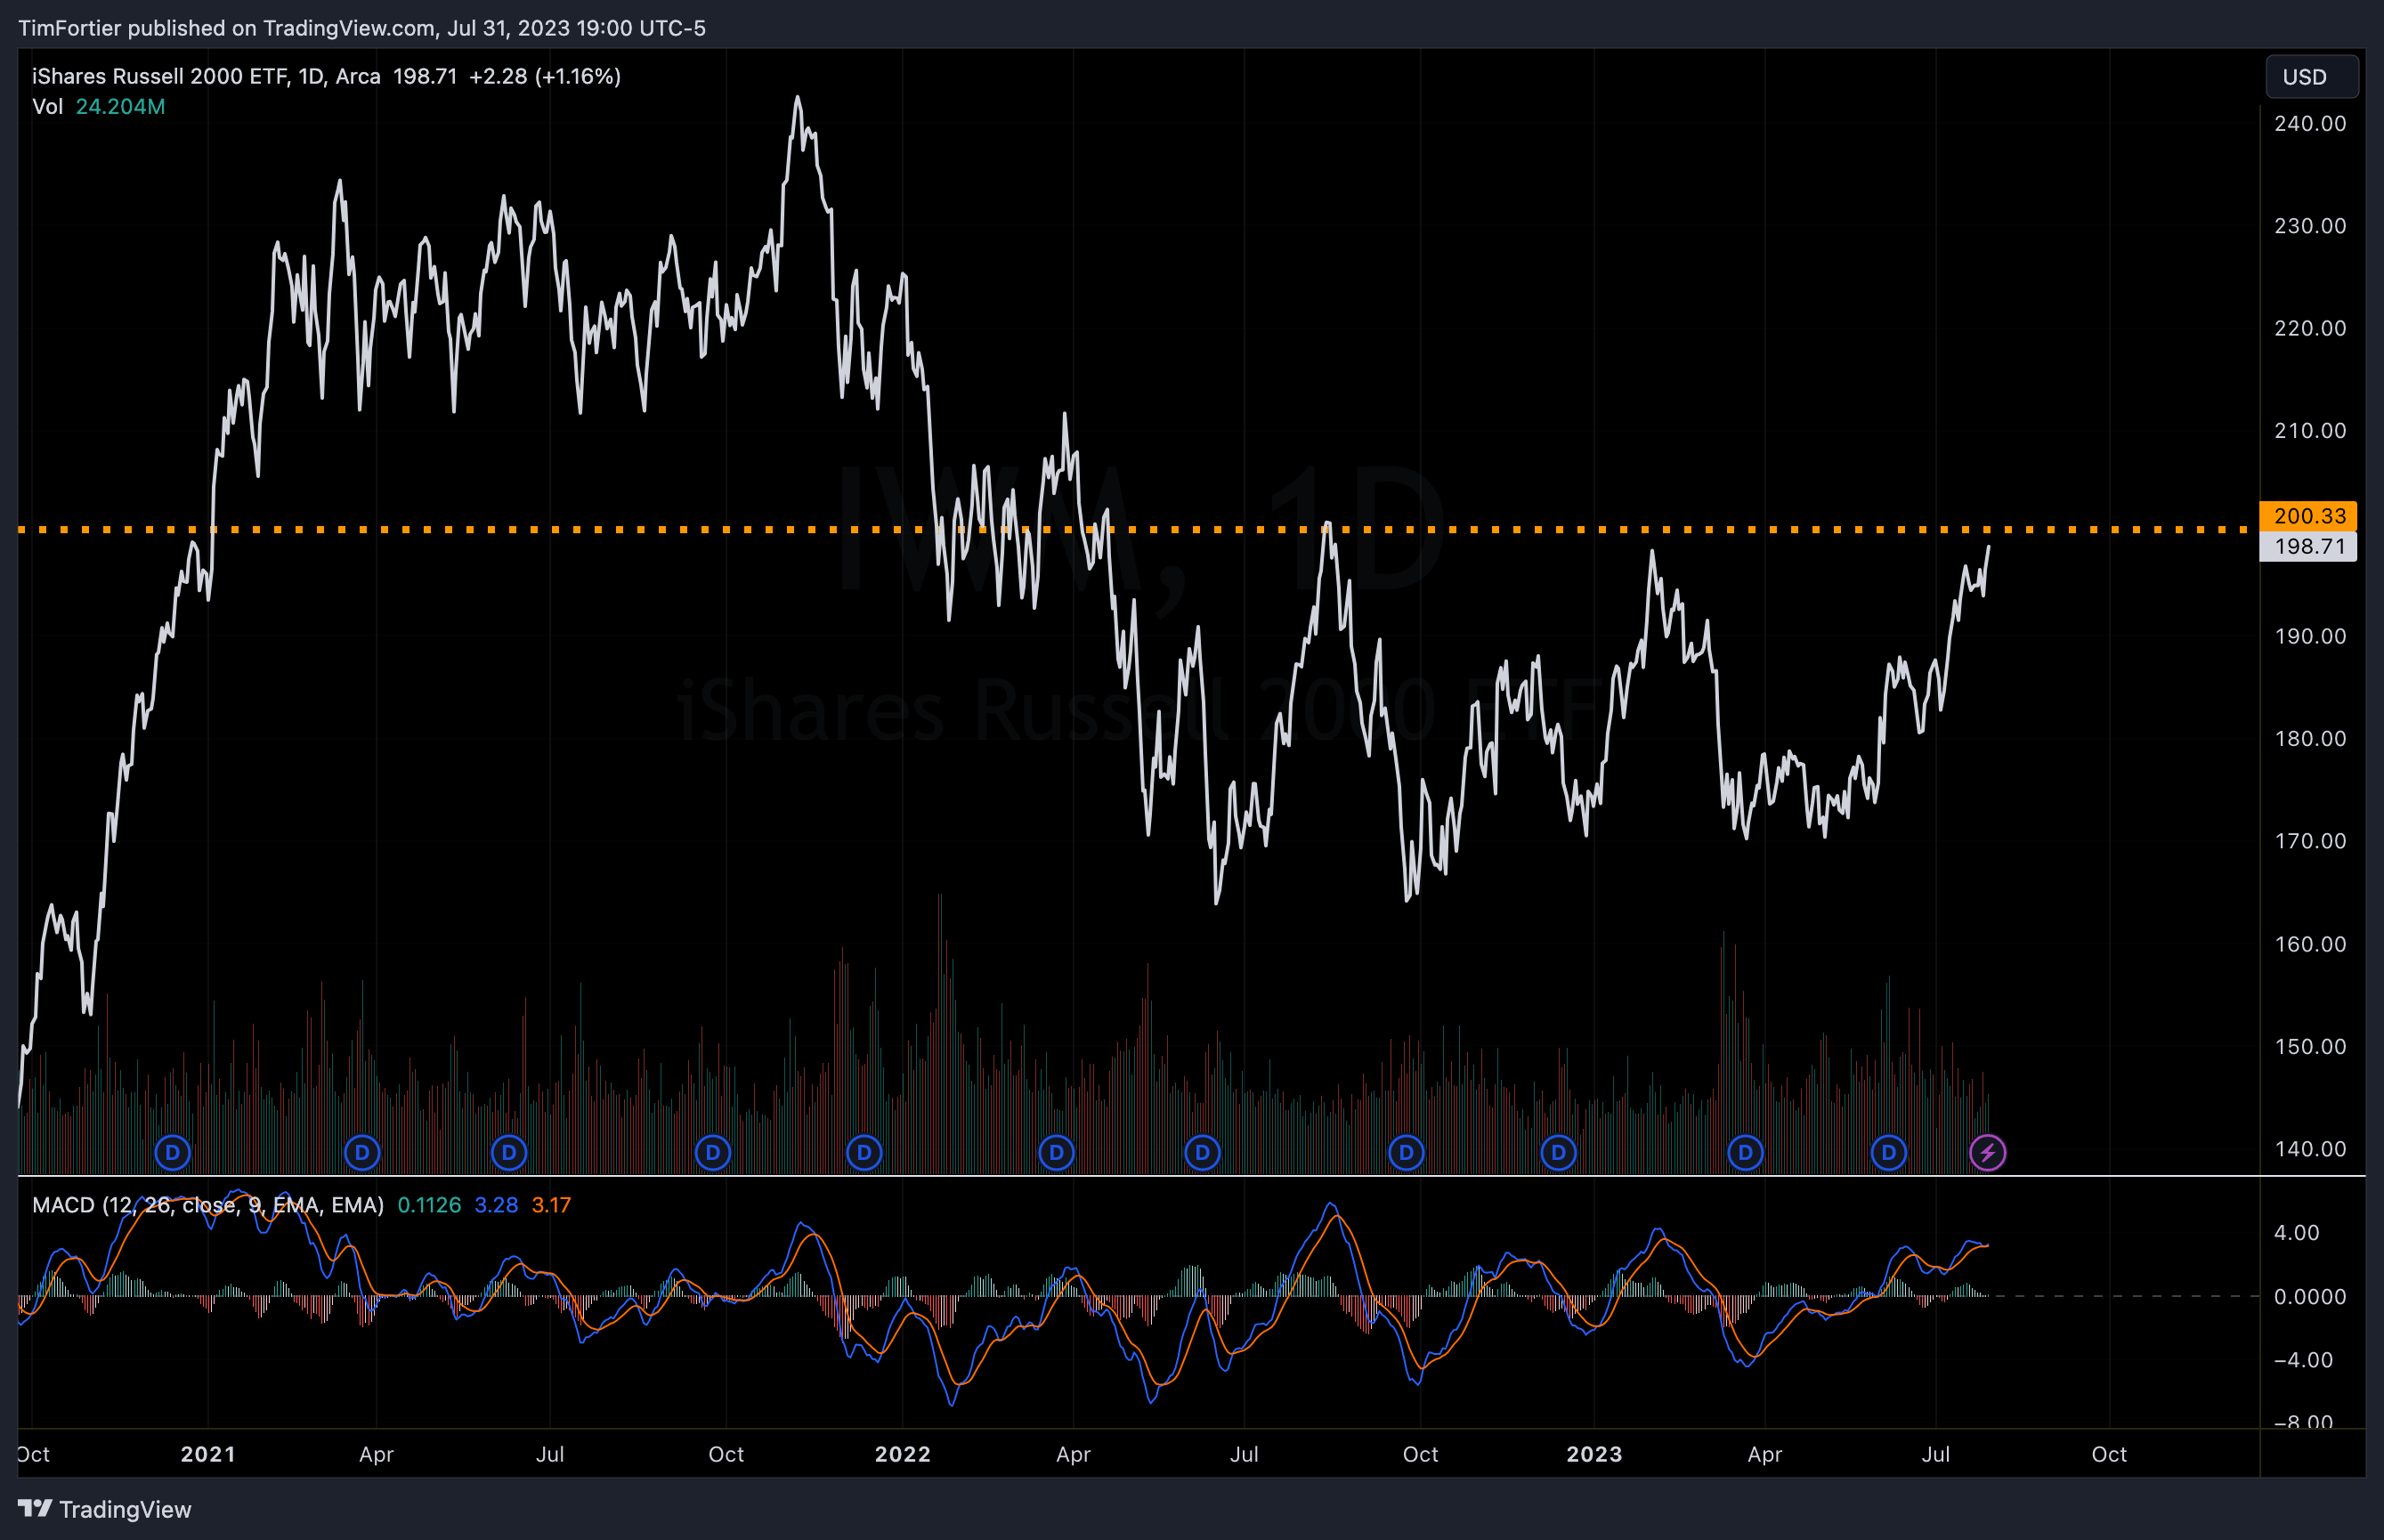
Two charts to watch in August will be the Russell 2000 Index (IWM). The index has made two failed attempts to get above $200. Will the third time be a charm?
The next chart to keep an eye on will be the 10-Year Interest Rate chart. So far it has been unable to break above the October 2022 high and is in a multi-month consolidation.
However, a move higher would be likely viewed negatively by the stock market and could quickly put an end to the stock market advance.
If you have any questions or have been considering hiring an advisor, then schedule a free consultation with one of our advisors today. There’s no risk or obligation—let's just talk.
Tags

Free Guide: How to Find the Best Advisor for You
Get our absolutely free guide that covers different types of advisory services you'll encounter, differences between RIAs and broker-dealers, questions you’ll want to ask when interviewing advisors, and data any good financial advisor should know about you and your portfolio.
