
Related Blogs
June 8, 2018 | Michael Reilly
What would have happened if, each year, we invested in the stock market in March, April, and May – ONLY?
One study shows that strategy may have generated an average annualized return that’s 31% higher than that of the U.S. stock market benchmark, the S&P 500… all year around.
Today I’ll dive into a few very interesting seasonal patterns that I hope you’ll use to your advantage, or at least find interesting enough to share with your friends.
Duck season, Wabbit season, Equity season
For many of us here in the United States, Memorial Day weekend is considered the unofficial start of summer. And for those of us living in the NorthEast, it’s the long awaited beginning of sunshine, warm weather, and picnics.
But for investors who follow markets closely, the summer season also marks the time of year when stock market returns have historically been anything but hot. In fact, some might say they’ve been downright chilly.
Take a look at the chart below, provided by Nasdaq/Dorsey Wright.
The study compares the performance of four hypothetical portfolios (1958-2018) specific to each of the four seasons – Winter, Spring, Summer and Fall.
Defined as follows:
- Winter Portfolio Dates: 11/30 – 2/28
- Spring Portfolio Dates: 2/28 – 5/31
- Summer Portfolio Dates: 5/31 – 8/31
- Fall Portfolio Dates: 8/31 – 11/30
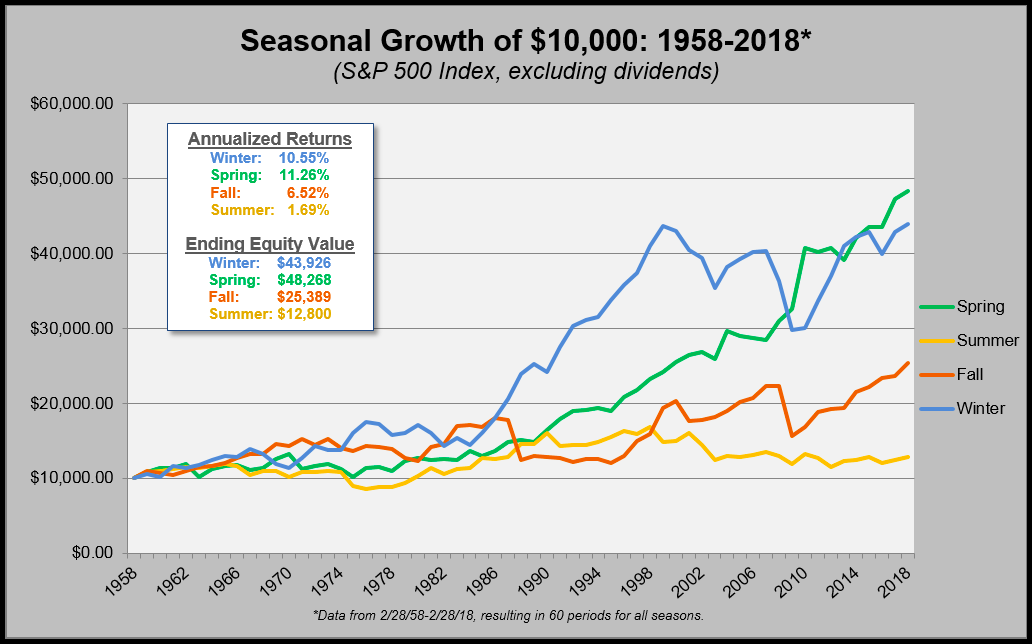
The Summer portfolio (yellow) greatly underperformed the other three seasons – Fall, Winter, and Spring.
As a matter of fact, according to Nasdaq/Dorsey Wright, a hypothetical $10,000 investment made only during the spring months (March through May), produced a cumulative return of 382% from 1958 through 2017, with an average annualized return of 11.26% – making it the best performing seasonal portfolio.
(Note: Unless otherwise stated, performance returns do not reflect dividends or all potential transaction costs. Taxes, fees, commissions, and trading expenses are not included in the hypothetical returns above.)
In comparison, the hypothetical Summer months portfolio gained a meager cumulative return of 28% over the last 60 years!
That results in an average annualized rate of return of only 1.69%. Hardly worth the risk.
While the months from March to May had an annualized return of 11.26%, the S&P 500 had an annualized average return of only 8.55% in the same time frame. That means the three appropriately named “Spring months” had an annualized average return that was 31% higher.
As always, there are exceptions, but weak summer season stock market returns have been a fairly common occurrence for market participants over the last 60 years.
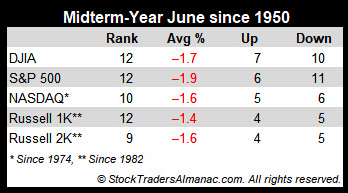
According to the Stock Trader’s Almanac, in midterm years since 1950, none of the five indexes below has a winning track record in the month of June.
And all five have declined more often than they have risen, with average losses ranging between -1.4% (Russell 1000) to -1.9% (S&P 500).
This year, we’re beginning the weak summer months after a very volatile start to the year.
After witnessing the S&P 500 Index (SPX) get off to a scorching start at the beginning of 2018, jumping 6% by January 26th, the Index fell 12%, entering correction territory in early February. After rising in March, the index fell again, retesting those February lows in April.
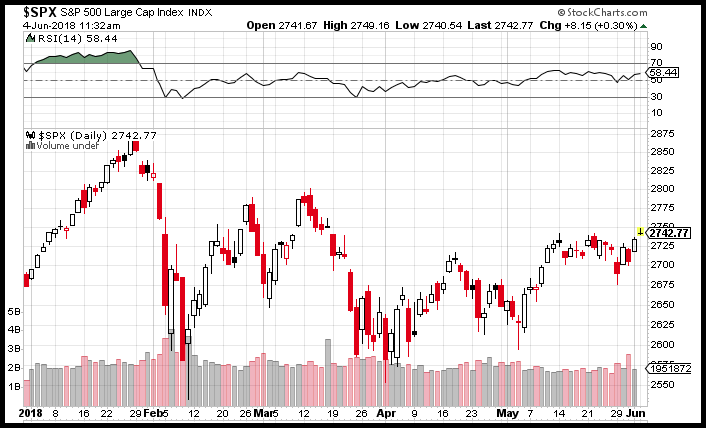
As we begin the month of June, and what is often considered the seasonally slow summer months, both the S&P 500 Index and the DOW remain well off the highs they established back in January.
The S&P 500 (SPX) is in slightly positive territory, up 2.28% (5/30) and the Dow (DJIA) slightly negative at -0.34%.
The lone ray of sunshine to the major market averages is the Nasdaq Composite Index (NDX), up 9.43%, closing in on it’s all-time high.
So, what does all this mean to investors? Well, it doesn’t mean investors should move to cash during the seasonally weak summer months…or throw caution to the wind and go all-in during the seasonally strong months of March through May.
It means traders and long-term investors would be well served to be more selective during these historically seasonally weak periods.
For technical investors like ourselves, this is when we continue to rely heavily on the charts, momentum indicators, and relative strength indicators.
And right now, our indicators remain solidly in favor of U.S. Equities, as the Asset Class remains in demand, with Small Cap Growth stocks the leader in Style and Size.
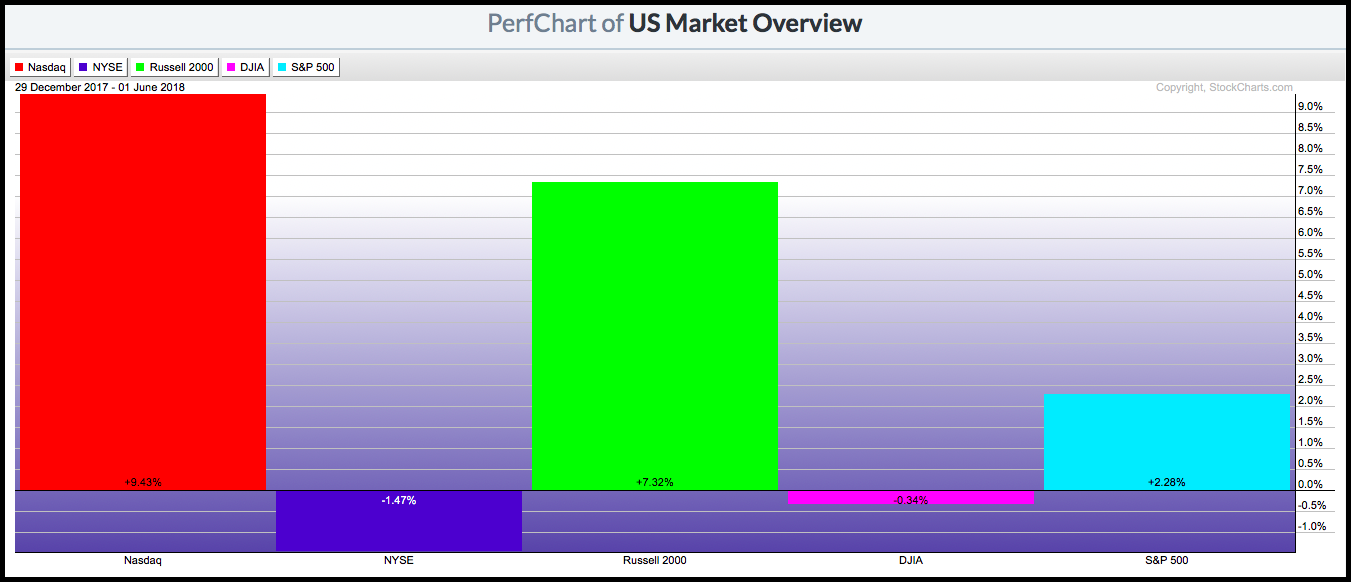
As of June 4, the tech heavy Nasdaq (+9.43%) and Russell 2000 Small Cap Stock Index (+7.32%) are tripling and quadrupling the returns of the S&P 500 Index (+2.28%) year to date, while both the NYSE and the DOW remain in negative territory.
Digging even deeper into the major U.S. sector level, Technology, Financials, Energy, and Industrials are in the driver seat.
The bar chart below includes ETFs from the Technology, Industrial, and Energy Sectors. Each of these sector ETFs are currently outperforming the S&P 500 (SPX) by a sizable margin year-to-date.
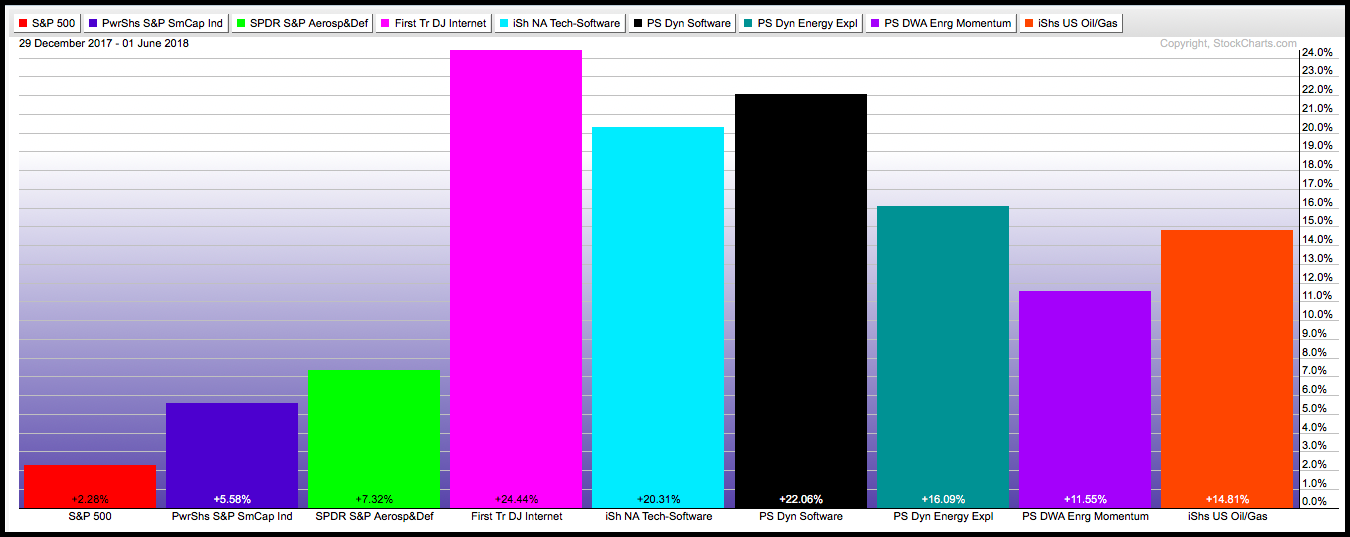
So, although major markets tend to underwhelm during the summer months, being selective and applying a relative strength strategy may give investors an important edge as you look for market beating returns.
While we can’t make any personalized recommendations, we can give you a peek into some of the funds that make it to our sector matrix. These aren’t necessarily “good buys”, although they do have the highest Tech Attribute scores at the time of this writing, and are probably worth keeping an eye on in the near future.
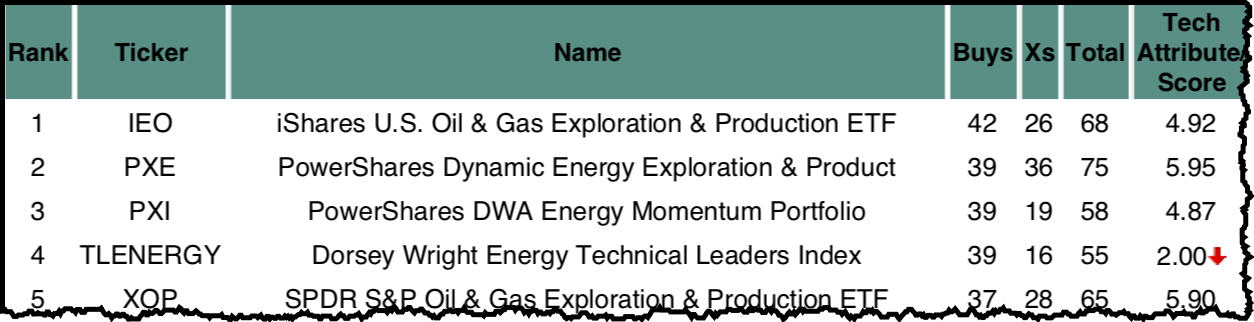
These Energy ETFs rank highly in our current matrix of Energy related ETFs:
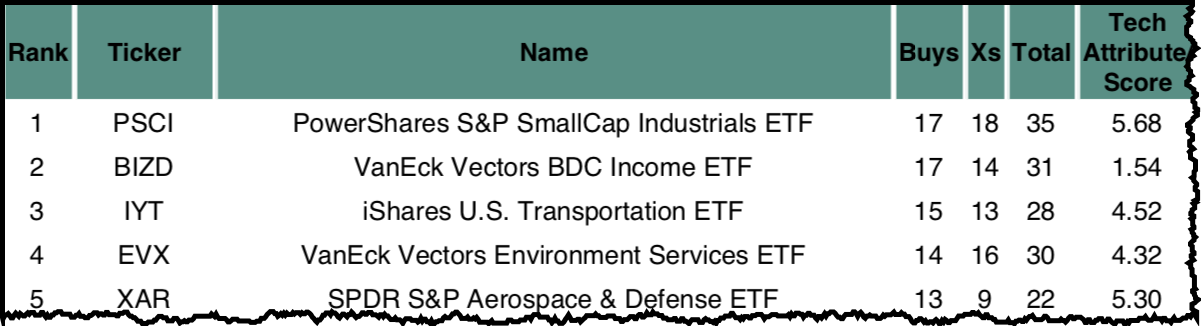
These Industrial ETFs rank highly in our current matrix of Industrial ETFs:
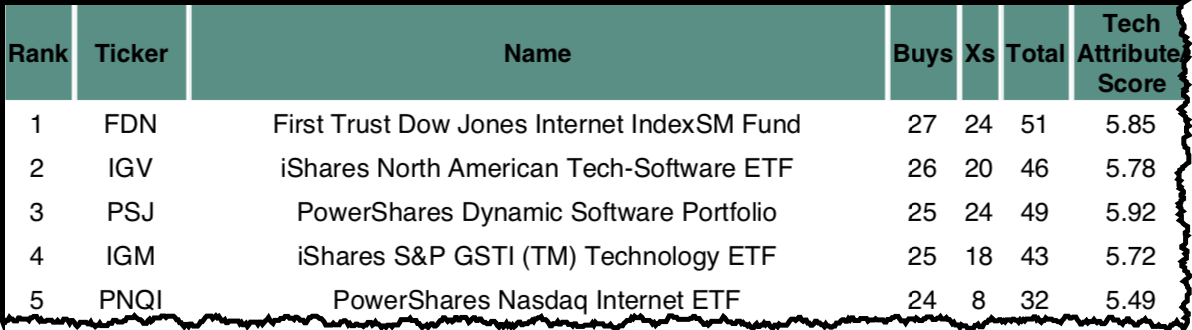
And here are a few Technology ETFs rank highly in our current matrix of Technology related ETFs:
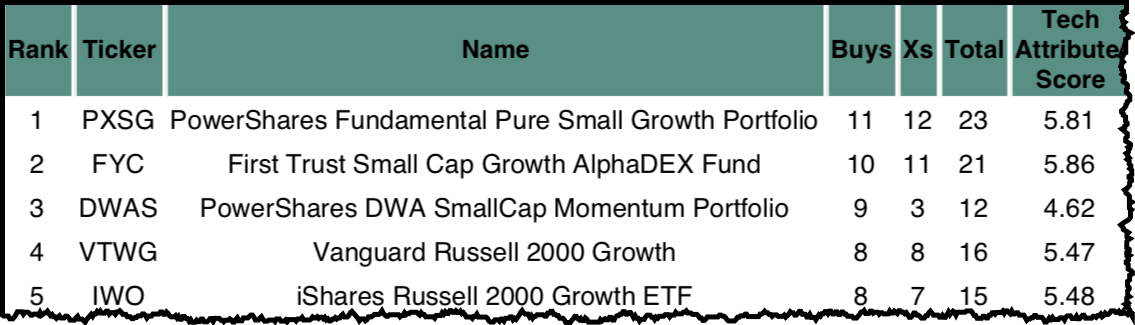
And last, ETFs ranked in the top 5 of Small Cap Growth ETFs in our current matrix.
If you want more personalized information on how you can best handle these “historically weak” summer months, or how to properly invest in ETFs based on their attribute score, please don’t hesitate to schedule a consultation with Rowe Wealth.
We offer free services such as portfolio analysis and risk analysis to qualified investors. A consultation carries no commitment, and we’d be more than happy to answer any questions you have, no strings attached! To find out if you qualify, click here now to select an appointment time.
Till next time, trade safely…
Tags

Get Our FREE Guide
How to Find the Best Advisor for You
Learn how to choose an advisor that has your best interests in mind. You'll also be subscribed to ADAPT, Avalon’s free newsletter with updates on our strongest performing investment models and market insights from a responsible money management perspective.
