
Related Blogs
June 14, 2018 | Michael Reilly
The surprising results of the 2016 Presidential election lit an inferno under the Financial sector.
In September 2016, just months prior to the 2016 election, Financials were ranked dead last on a relative strength basis (#11 out of 11).
By October 28, 2016, they had jumped to #5 and – just after the election – Financials displaced Industrials to move into the top 3 sectors. On February 24, 2017, Financials moved to the #2 spot, and never looked back.
One of the most popular proxies for the Financial sector is the SPDR Financial sector ETF (Symbol: XLF), it jumped 46.34% between November 1, 2016 and June 11, 2018.
To put those returns in perspective, the S&P 500 Index gained 31.74% over the same time.
That means a hypothetical investment in the broad financial sector fund (XLF) would have accumulated an additional 14.60% over the same period.
Overall, gains in XLF were 46% higher than the gains in the S&P 500.
But, since the market high of January 26, 2018, this popular Financial sector ETF (XLF) has actually declined 8.59%, nearly twice the decline of the S&P 500 (-4.81%).
I read a blog post the other day that included this 5 year weekly price chart of XLF.
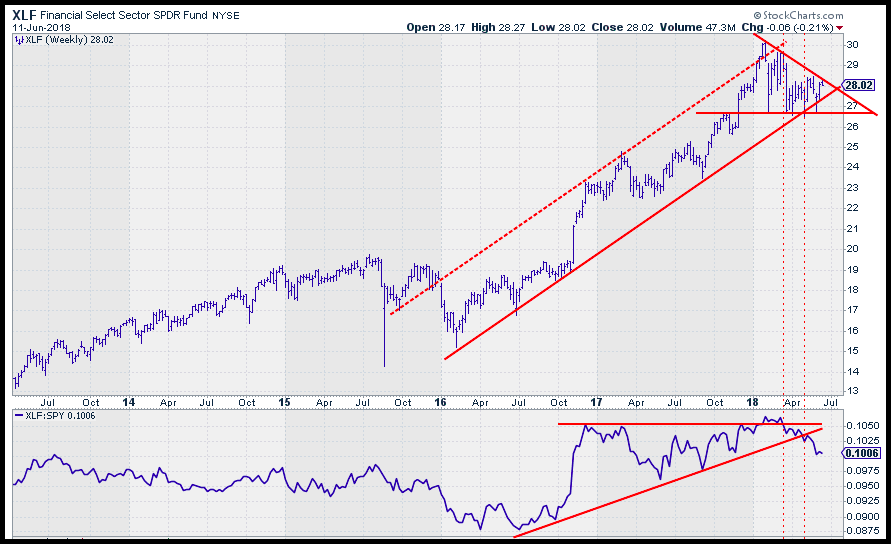
Most average investors reading that blog post and looking at the accompanying price chart may think the party for financials is over. And with good cause…on the surface the chart looks weak.
Here’s what the data is showing:
- The SPDR Financials ETF (XLF) has struggled to remain inside the boundaries of a rising channel that has been in place since early 2016.
- XLF has spent most of 2018 forming a descending triangle pattern – a pattern that forms when a security has a series of lower highs coupled with lows that have remained relatively intact.
- Descending triangles often break to the downside, resulting in lower prices.
- The relative strength chart comparing XLF to the broad market (shown here in the lower chart, as XLF:SPY) indicates that XLF has been losing relative strength against the broader market (S&P 500). Note: when viewing a comparative chart like this, a rising line indicates strength vs. the market, while a declining line signifies a weakening condition against the market.
- After rising sharply in October of 2016, the relative strength of XLF against the S&P has been choppy at best and has begun to decline.
But, investors with the ability to look under the surface will find that the relative strength data tells a different story – while there’s certainly a shifting occurring within financials…it doesn’t necessarily mean its leading position is going to drop.
Financials have been the second strongest Domestic sector for 16 months, dating back to February 2017. Meaning financials continue to show great strength relative to other sectors.
Then what’s the real story with XLF?
Well, it’s the LARGE-CAP financials held in XLF that have been underperforming the large cap index (S&P 500 Index).
Since Jan 28, Top 4 holdings, or About 37% weighting of the XLF, are
- Berkshire Hathaway (BRK/B) – down 10.9%,
- JP Morgan (JPM) – down 4.79%.
- Bank of America (BAC) – down 6.41%
- Wells Fargo (WFC) – down 14.86%
It’s these big names that are underperforming. 3 of the top 4 biggest holdings in XLF are down more than XLF itself.
This means, the smaller names in XLF are actually OUTPERFORMING, which is why XLF itself hasn’t been dragged down as much as those top holdings listed above.
The small caps tend to lead the larger names. So there’s no indication of deterioration in the sector, and our algorithms show financials in general remain strong.
If you’re already a client of Rowe Wealth, you can be assured that we’re well aware of the situation and have been rebalancing portfolios to take advantage of the continuing momentum in small cap financials.
If you’re not a client, you’re always welcome to schedule a consultation to discuss the data we see in greater detail and find out how we can help improve the strength of your portfolio.
Click here to see times and dates currently available.
Best Wishes,
Mike Reilly

Get Our FREE Guide
How to Find the Best Advisor for You
Learn how to choose an advisor that has your best interests in mind. You'll also be subscribed to ADAPT, Avalon’s free newsletter with updates on our strongest performing investment models and market insights from a responsible money management perspective.
