
Related Blogs
June 20, 2019 | Michael Reilly
Ever heard the old saying that fundamentals will tell you what to buy, while technicals tell you when to buy it?

Well, it’s just a lot of nonsense – how many times have you seen analysts give buy recommendations on stocks with falling prices? Or they reiterate a buy recommendation based on lower prices, saying something like…
“If you liked it $25 a share, you’ll love it $14”.
Umm, no thank you.
Our way of thinking is that you should let the technicals guide you to what to buy – just follow the price action. To put it simply, buy stocks showing positive momentum, the ones with rising prices.
Savvy investors already know this and focus on stocks showing the highest relative strength and positive momentum.
High momentum stocks often offer investors the best probability of investment success. (In a bit, I’ll highlight a few securities that fit this criteria right now.)
Sure, we want to buy fundamentally sound companies. And fundamental analysis will help put a valuation on a company – but what good is that if the market doesn’t agree with that valuation?
And, all too often, the market doesn’t agree with what the fundamentals say, Forcing your opinion on the market is a losing proposition.
I’d like to have a nickel for every time I heard an investor say – “the market is wrong about this one.”
Even if it is, the market can stay wrong longer than you can stay solvent. Get my point?
Success is more likely when you’re willing to take what the market is giving you… let the market tell you what it thinks and trade accordingly.
One of the benefits of understanding basic technical analysis is that you don’t have to be an expert in every (or any) sector of the market.
You don’t have to be an expert in the financial sector, or consumer goods, or energy stocks. The fact is, we really only care about one thing – the direction of price.
Sir Isaac Newton said – “an object in motion tends to stay in motion”. Well, it’s the same for stocks showing positive momentum.
Want proof? Check out the charts below illustrating this momentum phenomena…
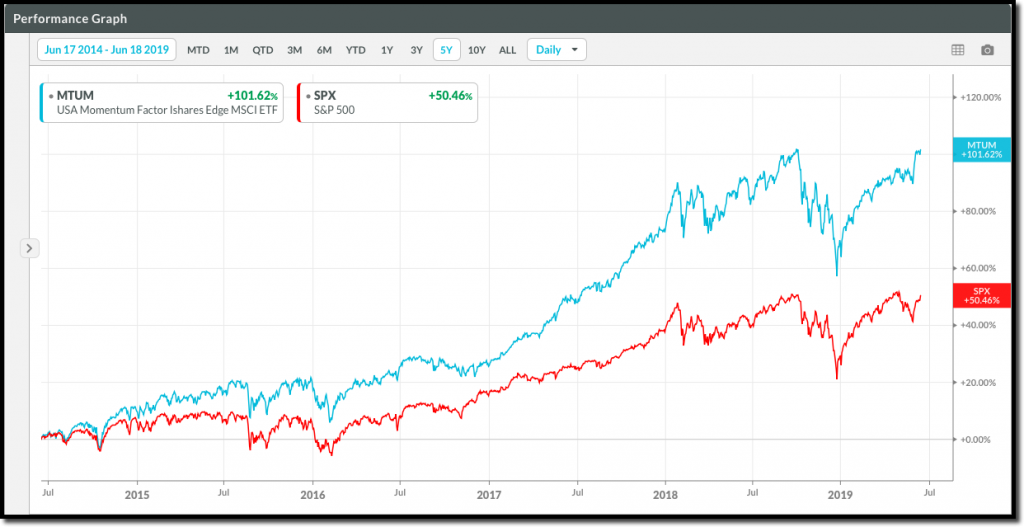
In these two performance charts, I’m comparing the performance over 5 and 10 years, between the S&P 500 index and the iShares Edge MSCI USA Momentum ETF (MTUM).
MTUM is an ETF designed to track the performance of large and mid size U.S. stocks exhibiting high momentum characteristics.
These are the kind of stocks we like to own. Stocks that have the wind at their backs, making profitable outcomes more likely. Since June 17, 2014, MTUM has doubled the return of the S&P 500, outperforming the index 101.62% vs. 50.46% for the S&P 500.
(Click any image to enlarge
How much more would your portfolio be worth today had you followed the momentum trade instead of a cap weighted index? Ouch!
Zooming out to the 10 year chart, MTUM has gunned higher by a whopping 150.88%, crushing the S&P 500’s gains of 89.52%.
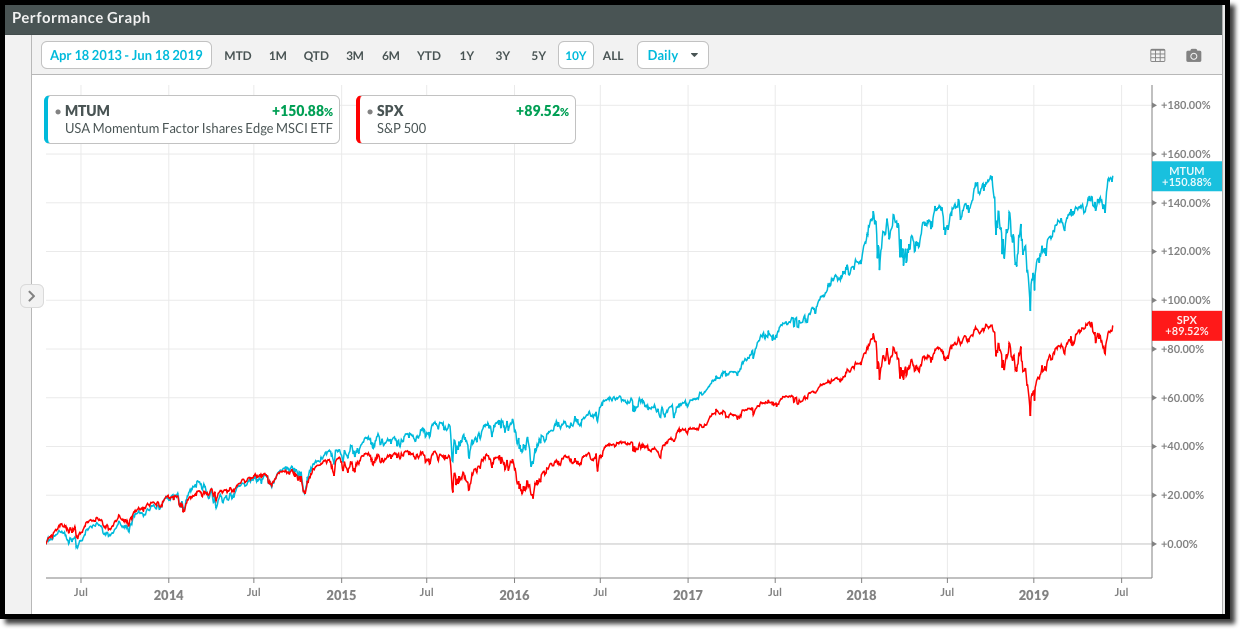
That means investors in this 8 billion dollar momentum giant enjoyed gains in excess of 68% higher than typical index investors.
In last week’s edition of Adapt, I wrote about the downside of index investing – click here to read.
Need more convincing that momentum (ie. relative strength) investing has a place in your portfolio? It’s the same relative strength/momentum analysis that lead investors to dive into Microsoft (MSFT) three years ago as it ripped higher by 191.21% against the backdrop of the S&P 500 and its record highs (as I write), gaining 42.66% since June 17, 2006.
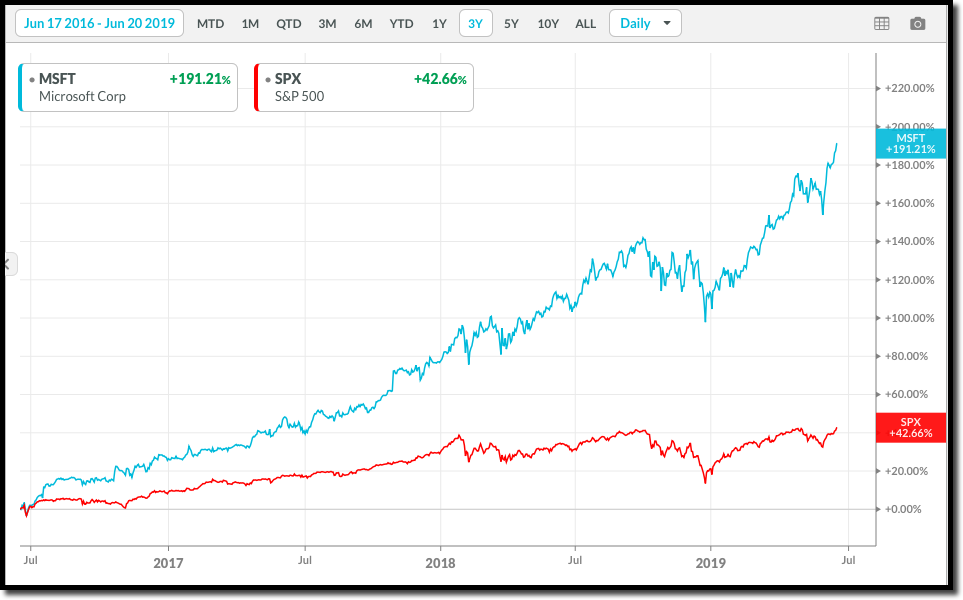
Think you missed the boat on MSFT? Think again. Our relative strength algorithms kept MSFT at the top of investors’ wish lists in 2019.
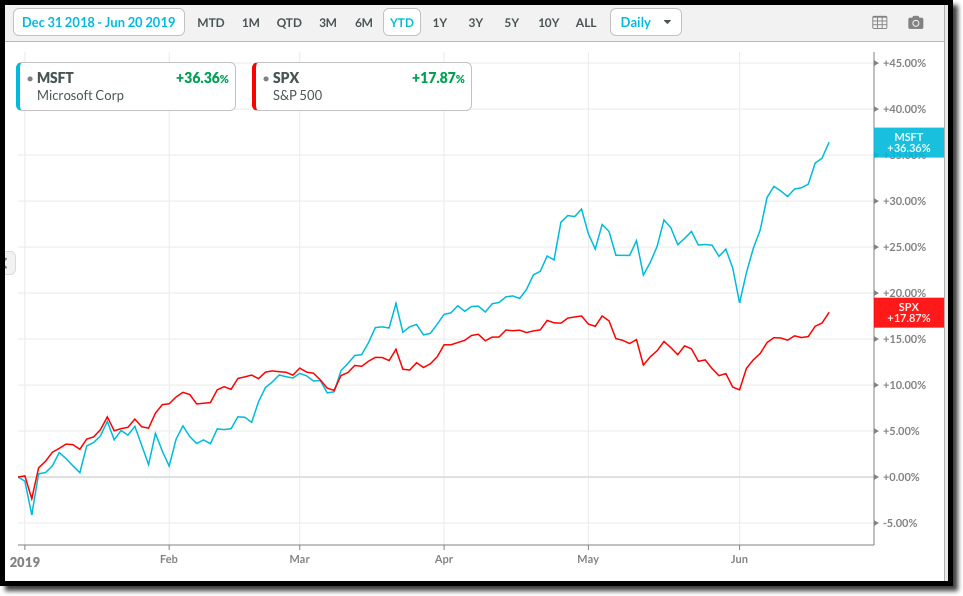
Since December 31, 2018, MSFT has continued to be a strong outperformer – gaining 36.36% – more than doubling the 17.87% YTD return of the S&P 500 index.
It’s not just about finding the winners – relative strength/momentum investing is equally adept at keeping you out of weak, underperforming stocks.
A perfect example of this is Wells Fargo & Company (WFC). While MSFT is a strong stock in the strongest sector (technology), Wells Fargo, is a weak stock in the 5th ranked sector – Financials (out of the 11 broad sectors we track).
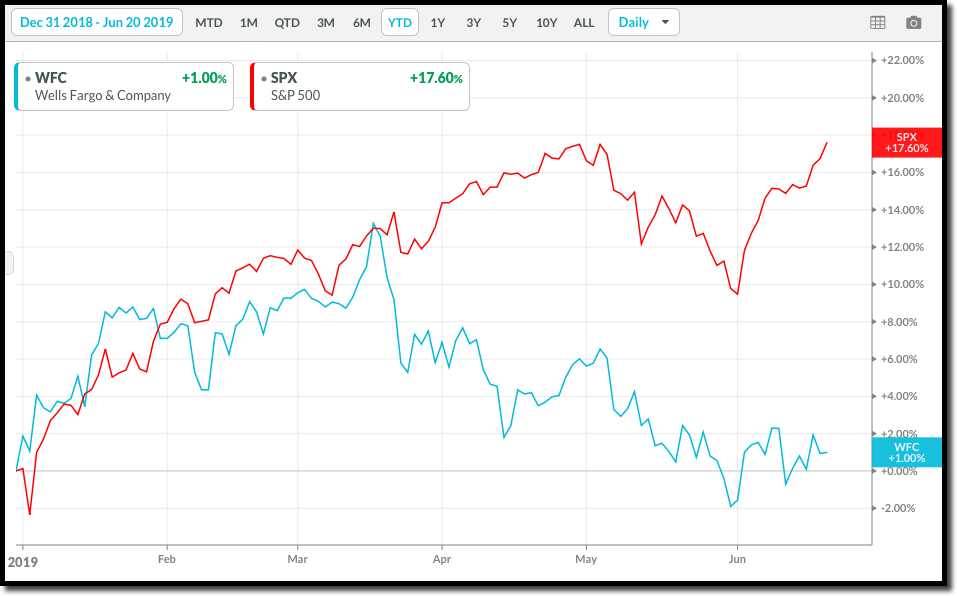
As you can see in the performance chart below – WFC has been a real dog all year – gaining 1% vs. the S&P 500’s 17.60% gain.
The technical picture of this stock would have kept you out of it and its anemic 1% gain.
The chart below illustrates the performance spread between MSFT – our strong relative strength stock and WFC – a weak relative strength stock.
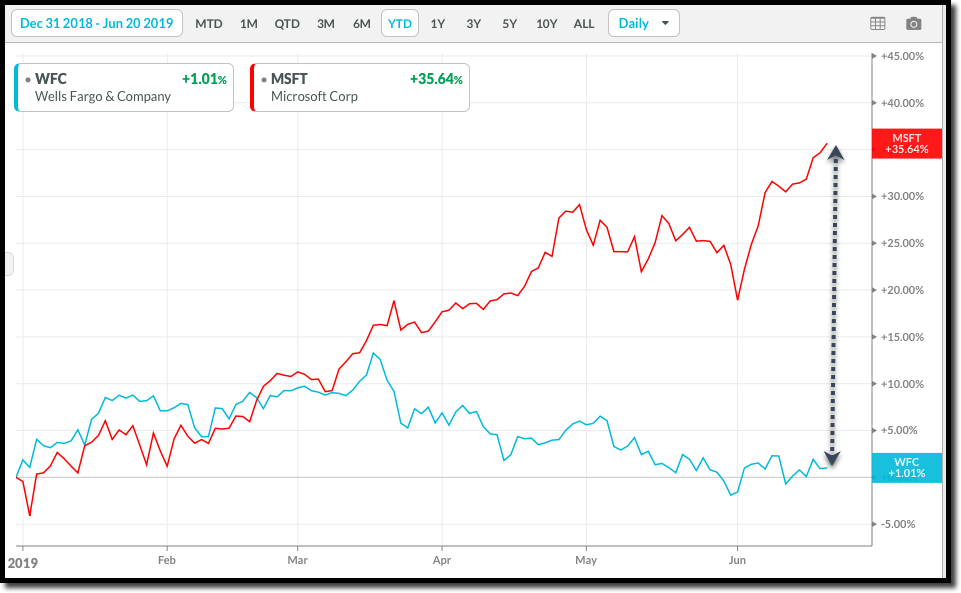
That spread – of more than 34% ytd – is what relative strength investing is all about. Investing in stocks exhibiting strong characteristics and higher prices while avoiding stocks exhibiting weak technicals and falling prices.
This is one of the fundamental principals behind how we structure some of our models at Rowe Wealth. By designing models that rebalance to only contain securities that score the highest across relative strength and momentum indicators, we substantially increase our clients’ chances of outperforming the market.
If you’re tired of doing the work yourself, and feel you may be interested in investing in one of our models (which will do the work for you) feel free to email us at info@rowewealth.com. You can also click here to book an appointment with one of our advisors. We would be more than happy to answer any questions you may have.
As always, invest Wisely
Tags

Get Our FREE Guide
How to Find the Best Advisor for You
Learn how to choose an advisor that has your best interests in mind. You'll also be subscribed to ADAPT, Avalon’s free newsletter with updates on our strongest performing investment models and market insights from a responsible money management perspective.
