
Related Blogs
September 17, 2019 | Michael Reilly
Lets face it, small-caps have been a mess.

As a matter of fact, the Russell 2000 index (RUT) has done nothing for 21 months. It’s been trading in a range between 1450 and 1600 since late 2017.
RUT has bumped up against overhead resistance at 1600 no less than 6 times since January of last year – including a failed breakout in May of 2018 that lasted until October before falling back below prior resistance.

Think about the psychology of what you are seeing. This chart signals to investors that every time RUT has reached 1600, sellers have overwhelmed buyers, forcing prices down.
There just simply wasn’t enough buyers to wrestle away control – meaning there wasn’t enough buying conviction.
And, excluding last December’s rout, that hurt just about everything – the Russell has held support in the area of 1450 five times since late 2017.
It’s a textbook case of a range bound market.
Remember something else about a range bound market – as the saying goes …”the bigger the base, the bigger the breakout!”
If small caps can get their act together, and buyers can push RUT to break and hold above 1600, the small-cap index may finally join what, until now, has been primarily a large cap stock rally.
We don’t have a crystal ball allowing us to see into the future. But what we do have is technical analysis…
So rather than straining our eyes to peer into the mist, hoping for some kind of sign, we have something better – charts!
And not just one chart! Lots of charts! Best of all, price charts tell you exactly what is happening. Not what might happen, not some “experts” opinion. Price charts identify where money is flowing right now – and it pays to follow the money.
The more charts you use, the more clear the picture becomes, and the higher your probability of success.
So today, we’re going to look at lots of charts!
We’ll begin with a quick look at RUT, using a Point and Figure chart to gain perspective of the directional trend of the Russell 2000.
Late last week, RUT gave a strong technical move that got our attention.
This is when the price action on the P&F chart broke above 1524 – marking the third consecutive buy signal on the chart (a spread triple top for you P&F lovers) – see arrows.
When P&F charts move to a buy signal, or multiple buy signals as this one has, it’s indicative of more and more buyers stepping in and buying, even at higher prices.
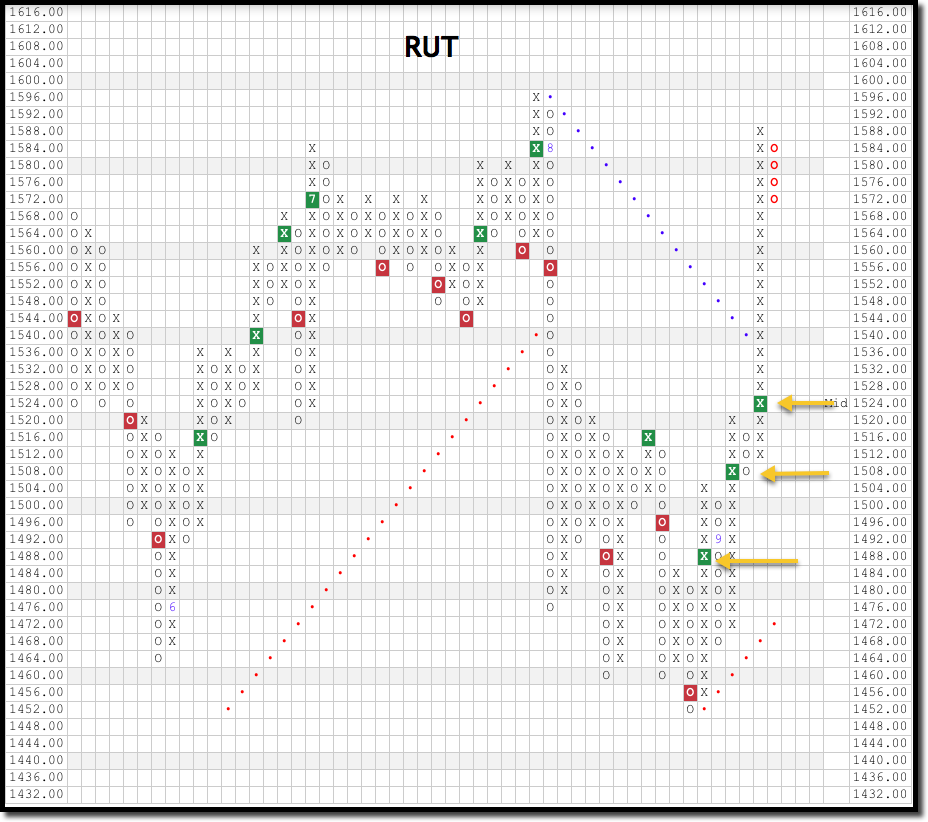 Chart courtesy of Nasdaq/Dorsey Wright
This move was followed by RUT rallying up to 1540 and breaking through what we refer to as the bearish resistance line (blue dotted line).
And when RUT moved above this line it caused the overall trend to move back to positive. And we like to invest into positive trends!
Although the Russell did just flip back to a column of Os, indicating selling pressure in the small cap index, the column change is short term in nature and not a surprise after a fast move up. RUT remains in a positive trend, which is important here.
When comparing the relative strength of the Russell 2000 small cap index to the S&P 500 large cap index, we see that small caps are now showing positive relative strength.
This means small cap stocks of the Russell are outperforming large cap stocks of the S&P 500 index.
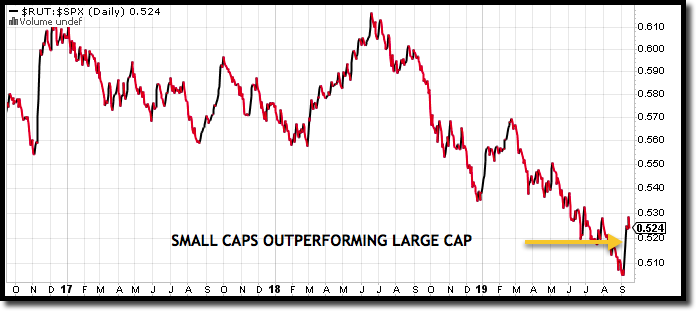
If we are going to start to see outperformance from the little guys, this would certainly be a logical place to look for it.
So far, we’ve seen two chart patterns indicating strength coming back to small caps.
The trend chart for the Russell 2000 turning positive after three consecutive buy signals and a relative strength chart comparing RUT to SPX has moved positive – and in favor of small caps.
Note: The relative strength line chart comparing RUT to SPX (RUT:SPX) moves up when small cap stocks, represented by RUT, are outperforming large cap stocks, represented by SPX, and moves down when small cap stocks are underperforming large cap stocks. Right now, small caps are stronger than large cap stocks.
The iShares Russell 2000 Index Fund (IWM) and iShares S&P Small Cap 600 ETF (IJR) are two ETFs that we also use to track the small cap market.
IWM is an ETF designed to track the performance of the Russell 2000 index, while IJR tracks the performance of the S&P small cap 600 index.

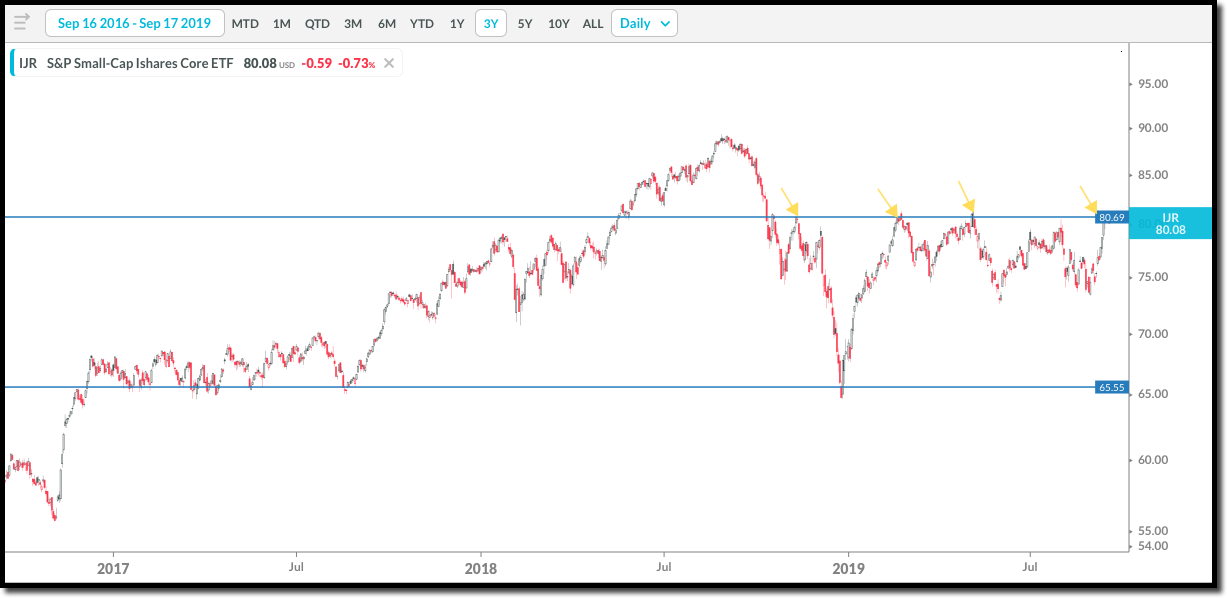
Both of these small cap ETF charts look very similar to the chart of the Russell 2000, in that they have both tested overhead resistance multiple times this year looking to breakout.
And here is a relative strength chart between the small cap ETF (IWM) and the S&P 500 (using SPY as a market proxy).
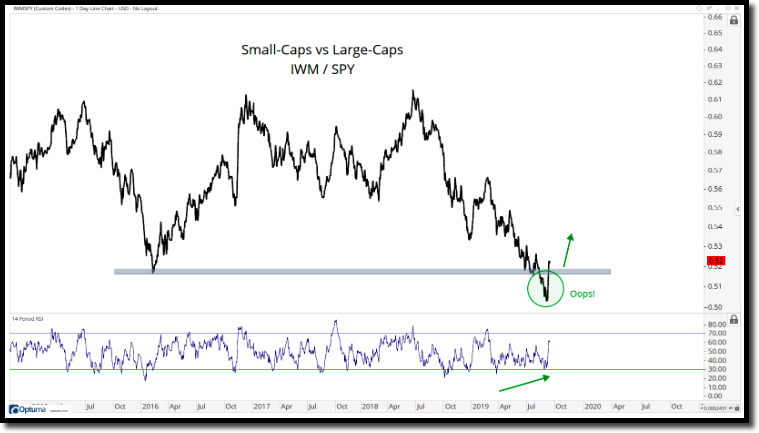
The last time the ratio between small and large cap stocks bottomed was in early 2016, when stocks in general started to rally hard, following the correction of 2014-2015.
We’ll have to wait and see if this another risk-on signal from small caps, similar to the move we saw in 2016. But I like what I’m seeing.
Small caps are making a case for higher prices on the sector level too.
Technology is, by far, the strongest of all the Small-cap sector indexes.
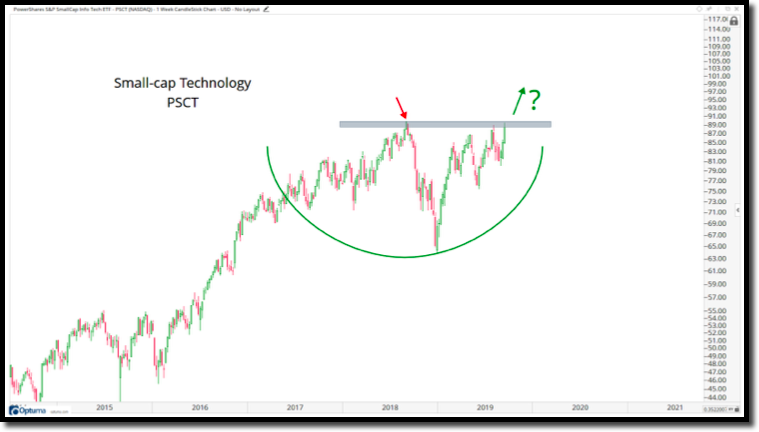
Small-cap tech is up against its former 2018 highs. If PSCT can get above 90, it may signal a breakout in the small cap sector.
Small caps are even making noise in the weakest sectors.
Even Energy, the weakest sector across all 11 sectors we track, is showing the strength of small caps.
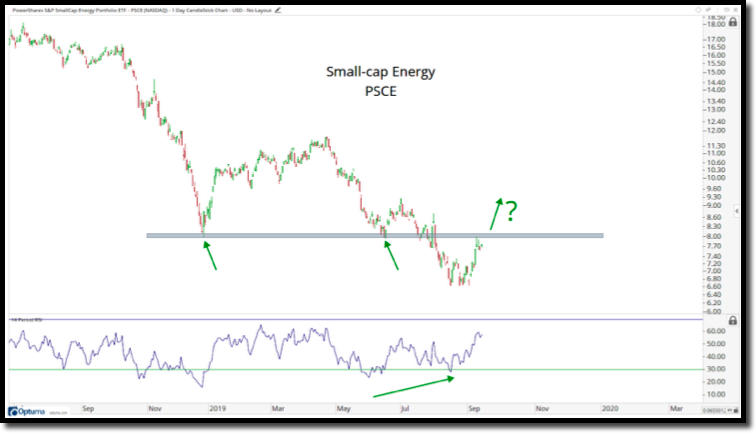
If the weakest small cap sector is moving up – what does that say about the underlying strength of small caps in general?
This chart of the Small-cap Energy Index (PSCE) looks awful, but look how it has moved back up to former support at $8.00.
What if PSCE can get back above the late 2018 lows? From that point, it would be in a great position to move even higher, especially if we continue to see real strength return to small caps.
Keeping your eye on internal market indicators like those we’ve just discussed is a great way to confirm action you think you’re seeing in the market. This can help you predict market direction and time your trades with much better accuracy.
If you’re interested in learning more about small-cap investing, you may want to consider scheduling a consultation with one of the advisors here at Rowe Wealth. We’ve recently created a model that specifically targets small caps that are likely to outperform (like the ones discussed above) and uses them to build a portfolio. If you’re not interested in watching the charts yourself, this could be a perfect way for you to gain exposure to the strongest small cap securities.
Click here now to see available appointment times.
As always, invest wisely.


Get Our FREE Guide
How to Find the Best Advisor for You
Learn how to choose an advisor that has your best interests in mind. You'll also be subscribed to ADAPT, Avalon’s free newsletter with updates on our strongest performing investment models and market insights from a responsible money management perspective.
