
Related Blogs
September 29, 2019 | Michael Reilly
We have a market of stocks, not a stock market (ie. S&P 500).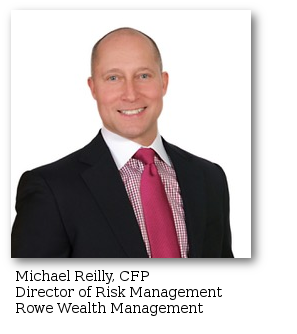
And just because the stock market (an index) isn’t going up, doesn’t mean there aren’t stocks in that market trading higher – sometimes much higher…
While the S&P 500 index, what most people think of as “the market”, has only managed to gain 5.21% over the last 6 months (March 26, 2019 – September 27, 2019) – here’s one sector that has more than doubled the market’s return.
And better yet, there’s a segment of this sector (or sub-sector) that has gained 6 times what the stock market (S&P 500) has offered up.
The sector I’m referring to today is Financials. And since March 24, 2019 (3 months) the iShares SPDR Financial ETF (XLF) – a broad based financial ETF, often quoted as a sector proxy, has gained 10.26%. That’s twice what the S&P has gained over the same time frame.
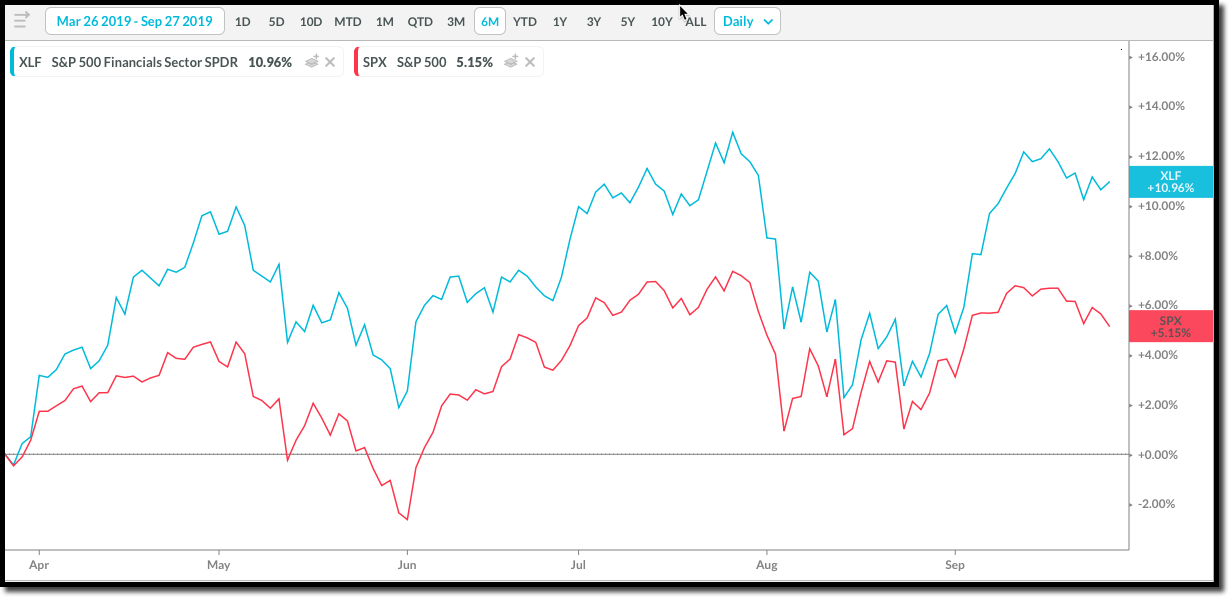
Digging a little deeper into the sub-sector of financials, we can see even more strength and market out-performance hidden away in the parts that comprise the financial sector. U.S. broker dealers, regional banks, and insurance for example.
Take a look at KIE, the S&P SPDR Insurance ETF (15.12%) has more than tripled the return of SPY (4.89%).
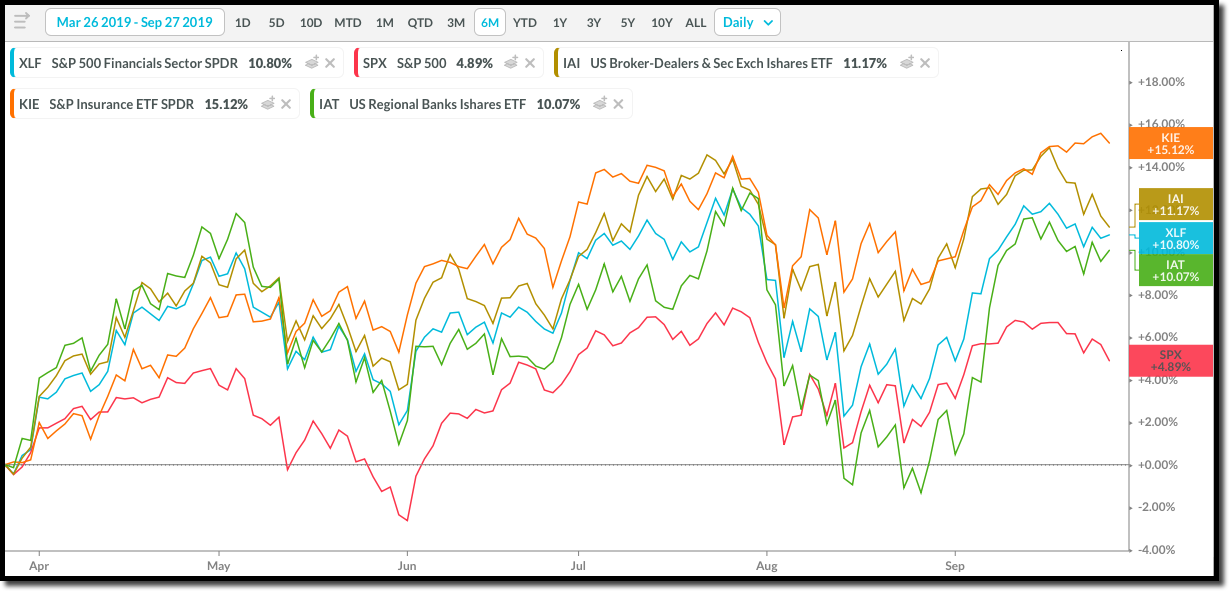
Below is a 1 year relative strength chart comparing the financial sector (XLF) to the S&P 500 index, using the SPDR S&P 500 index ETF (SPY) as our market proxy.
When the line on the chart is falling (black arrows) the S&P is showing relative strength vs. the XLF – financial sector. So it is either moving up by more or down by less than financials.
But when the line chart is moving up, as it is now (yellow arrows) the financial sector is showing relative strength vs the S&P 500 (SPY). Meaning it is moving up by more than the market or down by less than the market. This is by definition relative strength.
Investors will want to keep an eye on this relative strength relationship, because when the line chart is moving up, as it is right now, that’s when investors can find opportunity to outperform the overall market and beat the S&P 500.
Below is a list of ETFs and individual stock names that live in the financial subsections I’ve mentioned. Maybe you will find a few of these names interesting.
Exchange Traded Funds:
KIE – SPDR S&P Insurance ETF
IAK – iShares U.S. Insurance ETF
IYG – iShares Dow Jones U.S. Financial Services ETF
IAI – iShares U.S. Broker Dealers & Securities Exchange ETF
Individual stock names include:
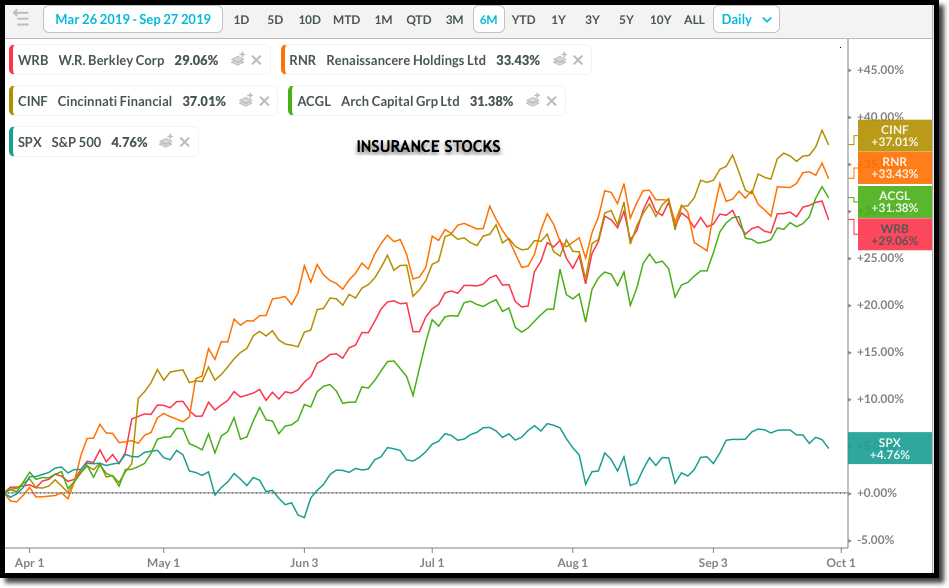
Insurance:
W.R. Berkley Corp WRB, Cincinnati Financial CINF, Arch Capital Group ACGL and Renaissancere Holdings RNR.
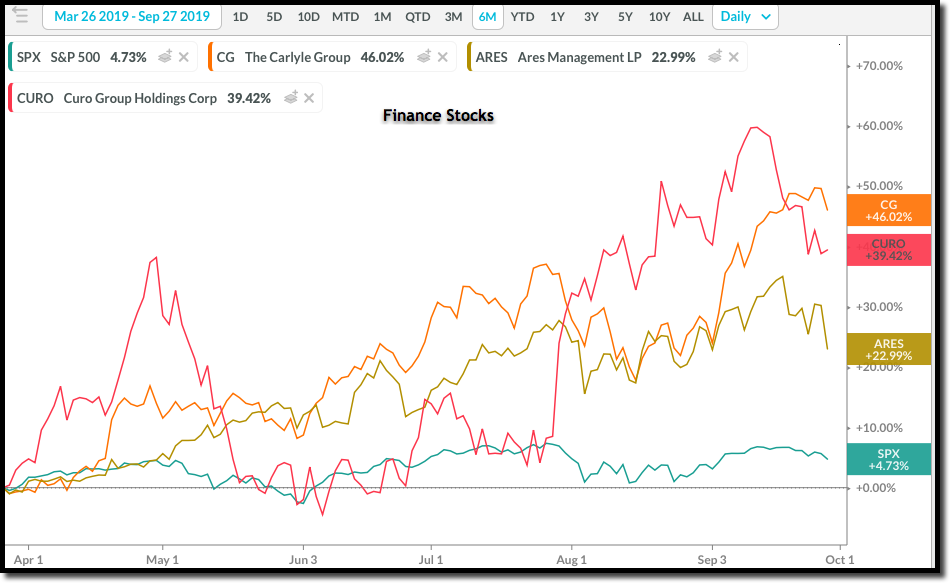
Finance:
Ares Management ARES, The Carlyle Group CG and Curo Group Holdings Corp CURO.
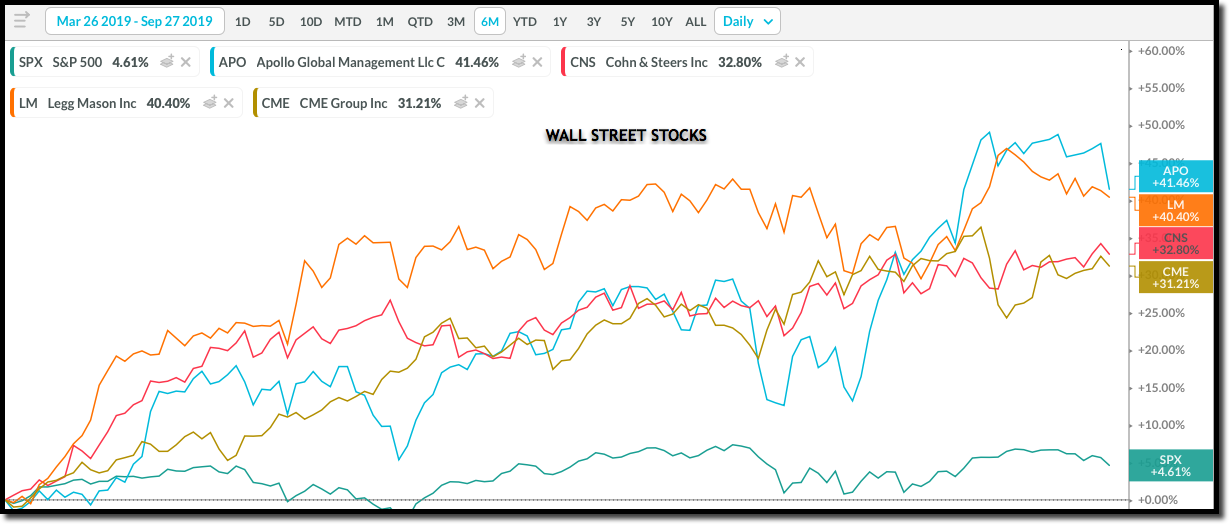
Wall Street names:
Apollo Global Mgmt APO, Cohn & Steers Inc CNS, Legg Mason LM and CME Group CME.
The stocks and ETFs we’ve identified in each of the financial subsectors, using relative strength algorithms, have all hammered the returns of the “stock market” for the last 6 months.
You see, this truly is a market of stocks… not a stock market. Understanding this is what gives savvy investors an opportunity to outperform markets.
As Sir Issac Newton said – “an object in motion tends to stay in motion..” So, there’s no reason to believe the trend in financials is over.
We don’t know how long a trend will last, when it emerges, or when it will reverse. The best we can do is to identify strong trends in sectors and sub-sectors and ride them until it is time to move on and adapt to these ever changing markets.
Until next week, invest safely…

Get Our FREE Guide
How to Find the Best Advisor for You
Learn how to choose an advisor that has your best interests in mind. You'll also be subscribed to ADAPT, Avalon’s free newsletter with updates on our strongest performing investment models and market insights from a responsible money management perspective.
