
Related Blogs
July 25, 2023 | Avalon Team
What will the second half of 2023 have in store for investors?
Will Big Tech continue to dominate?
Will we see additional rotation into sectors that until now, have underperformed?
I wouldn’t bet against the latter.
There’s one relationship we have our eyes on: The Relative Strength between the Energy and the Technology sectors.
There’s a potential change in the works, and if it happens, investors will want to be ready!
The chart below compares these two sectors – Energy (XLE) and Technology (XLE).
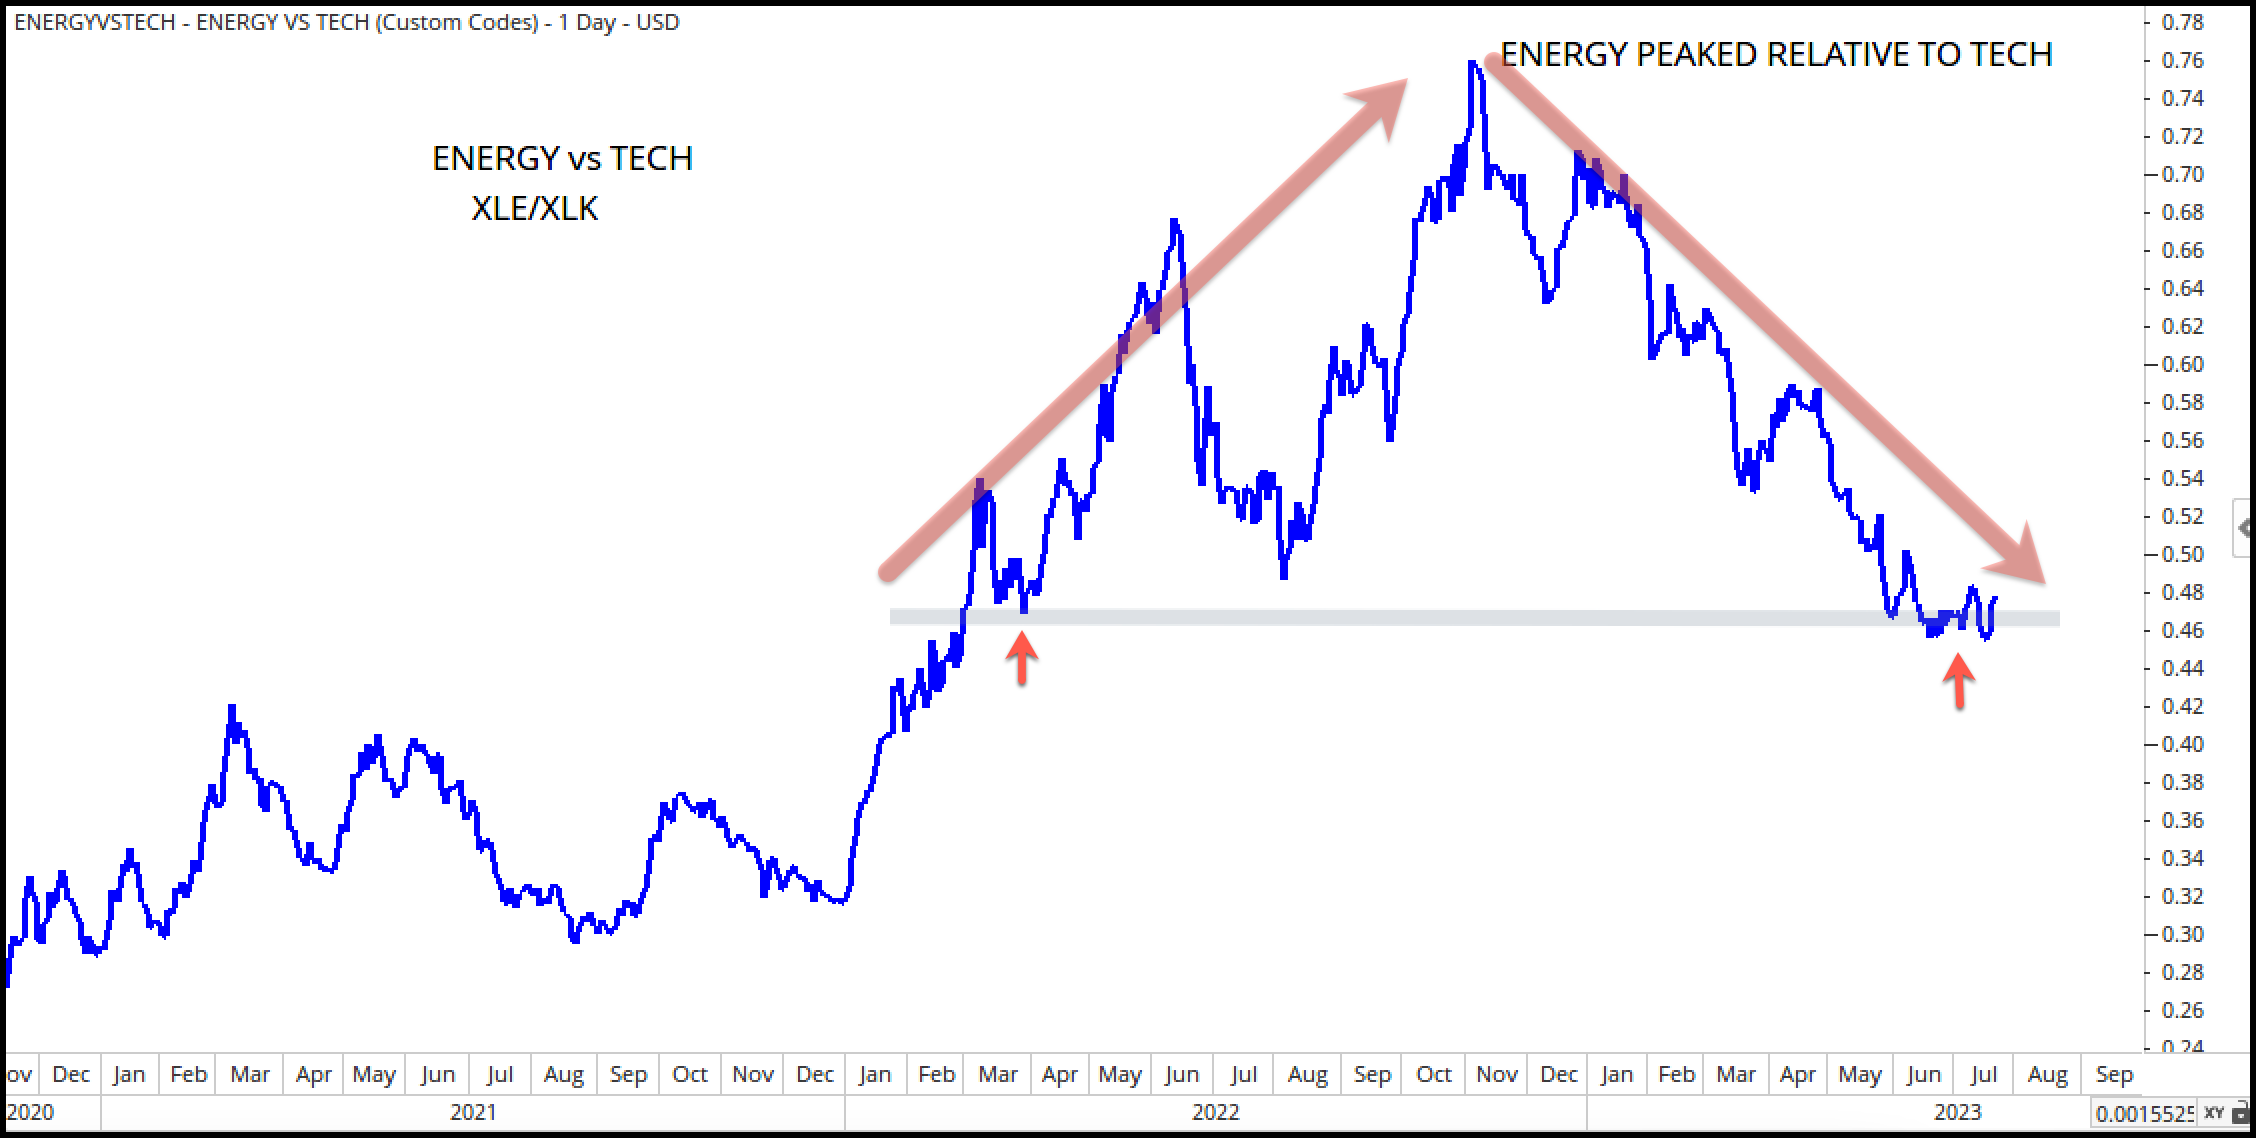
The rising blue line beginning in January of 2022 alerted investors to strength in Energy stocks (XLE) relative to Technology (XLK).
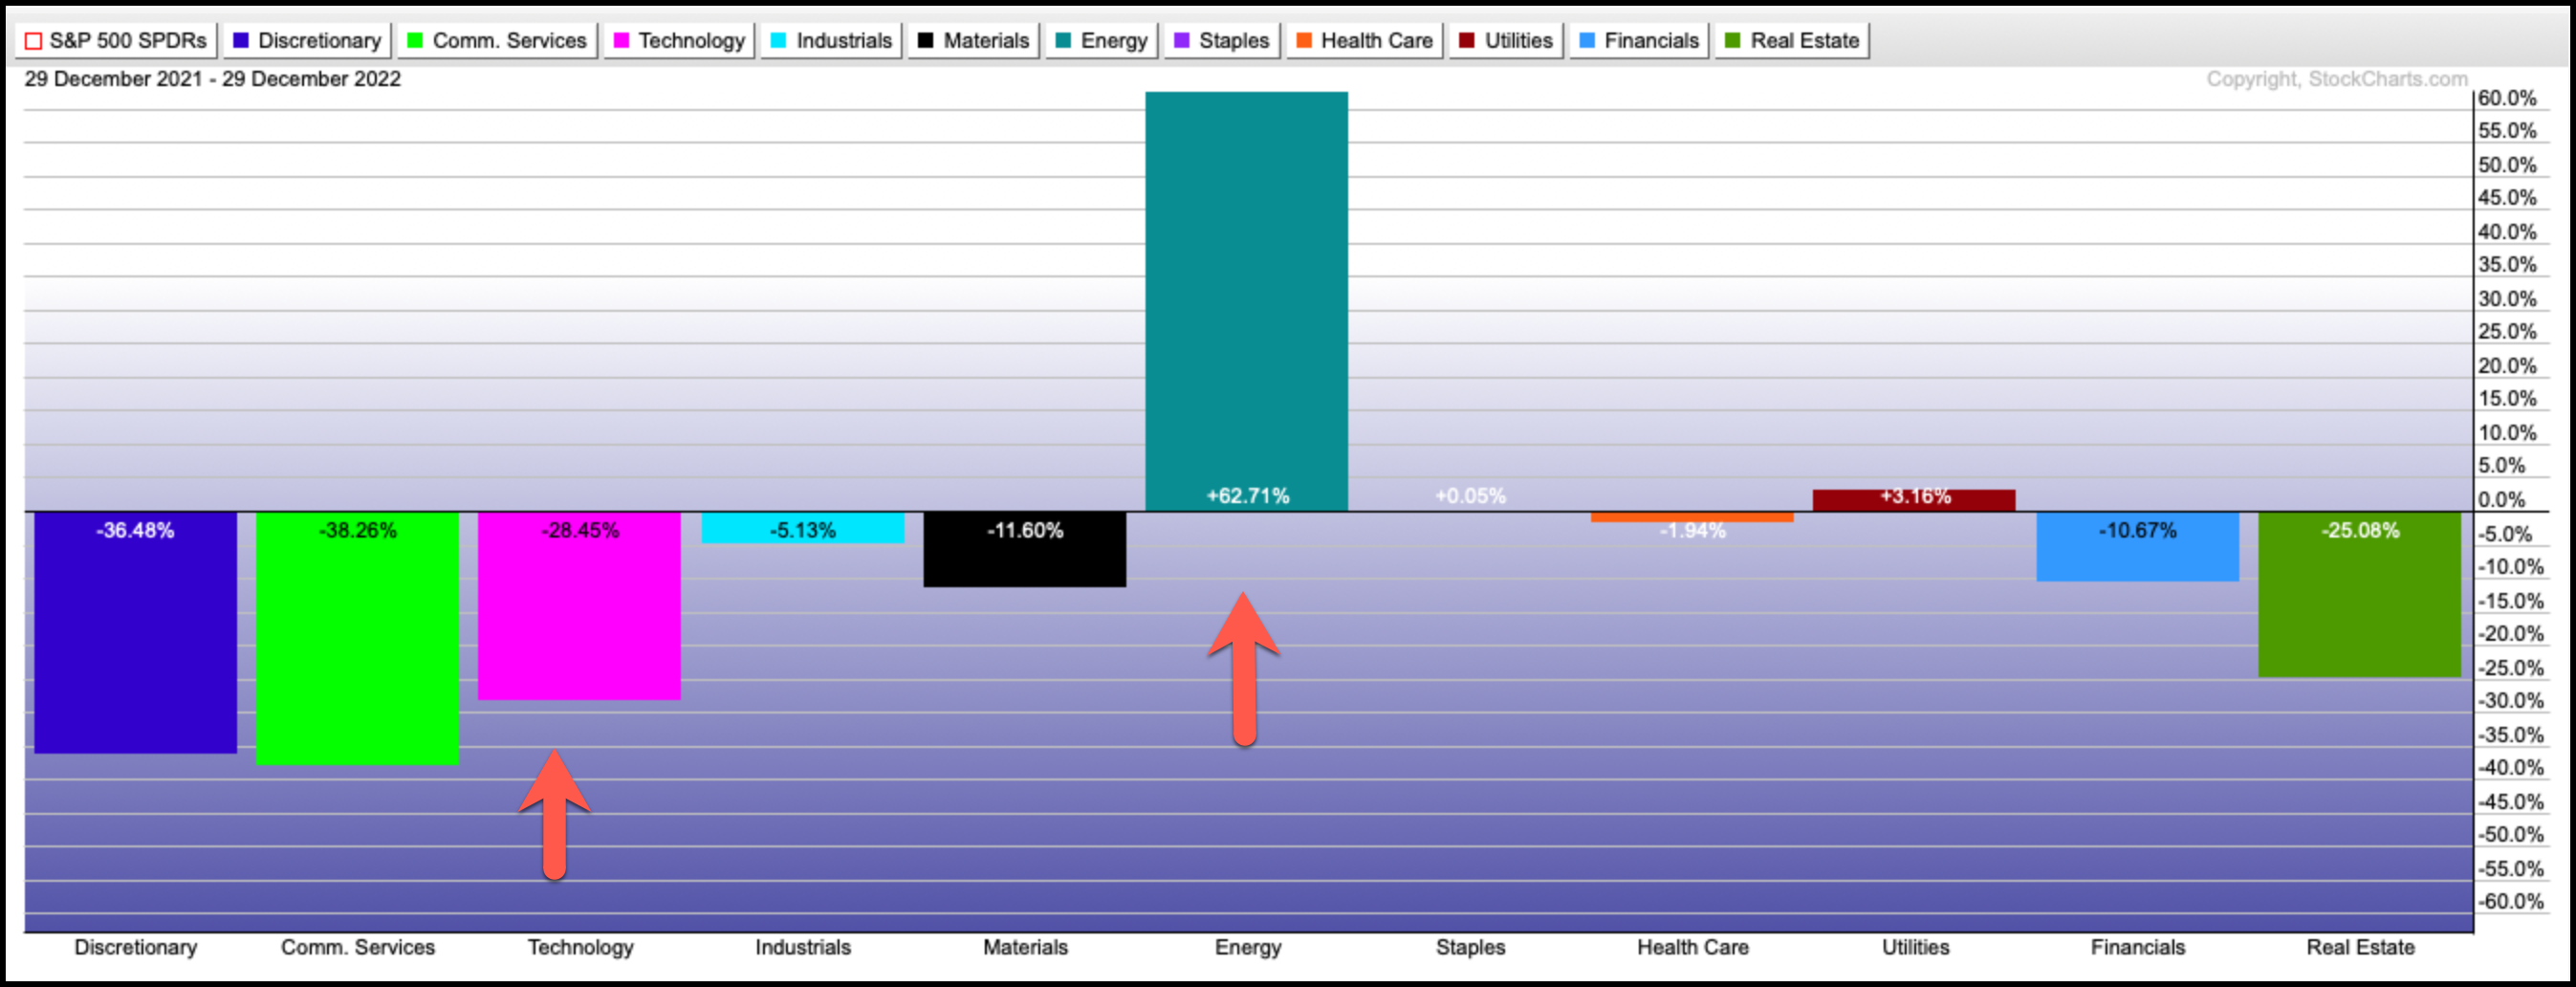
And safe to say, Energy was the dominant force in 2022, both on a relative and absolute basis…
While XLE surged more than 62% higher last year, Tech stocks looked more like a dumpster fire shedding nearly 30%.
But, these relationships can change. And the relationship between Energy and Tech did exactly that, peaking in Q4 2022.
Since then, the relationship flipped, favoring Tech stocks over Estocks on a relative basis.
And where we see Relative Strength (RS), we expect to see an advantage in absolute performance.
And that’s exactly what we’ve seen out of Tech in 2023 with XLK rocketing 42% higher YTD, while XLE remains flat on the year.
That’s a massive performance spread!
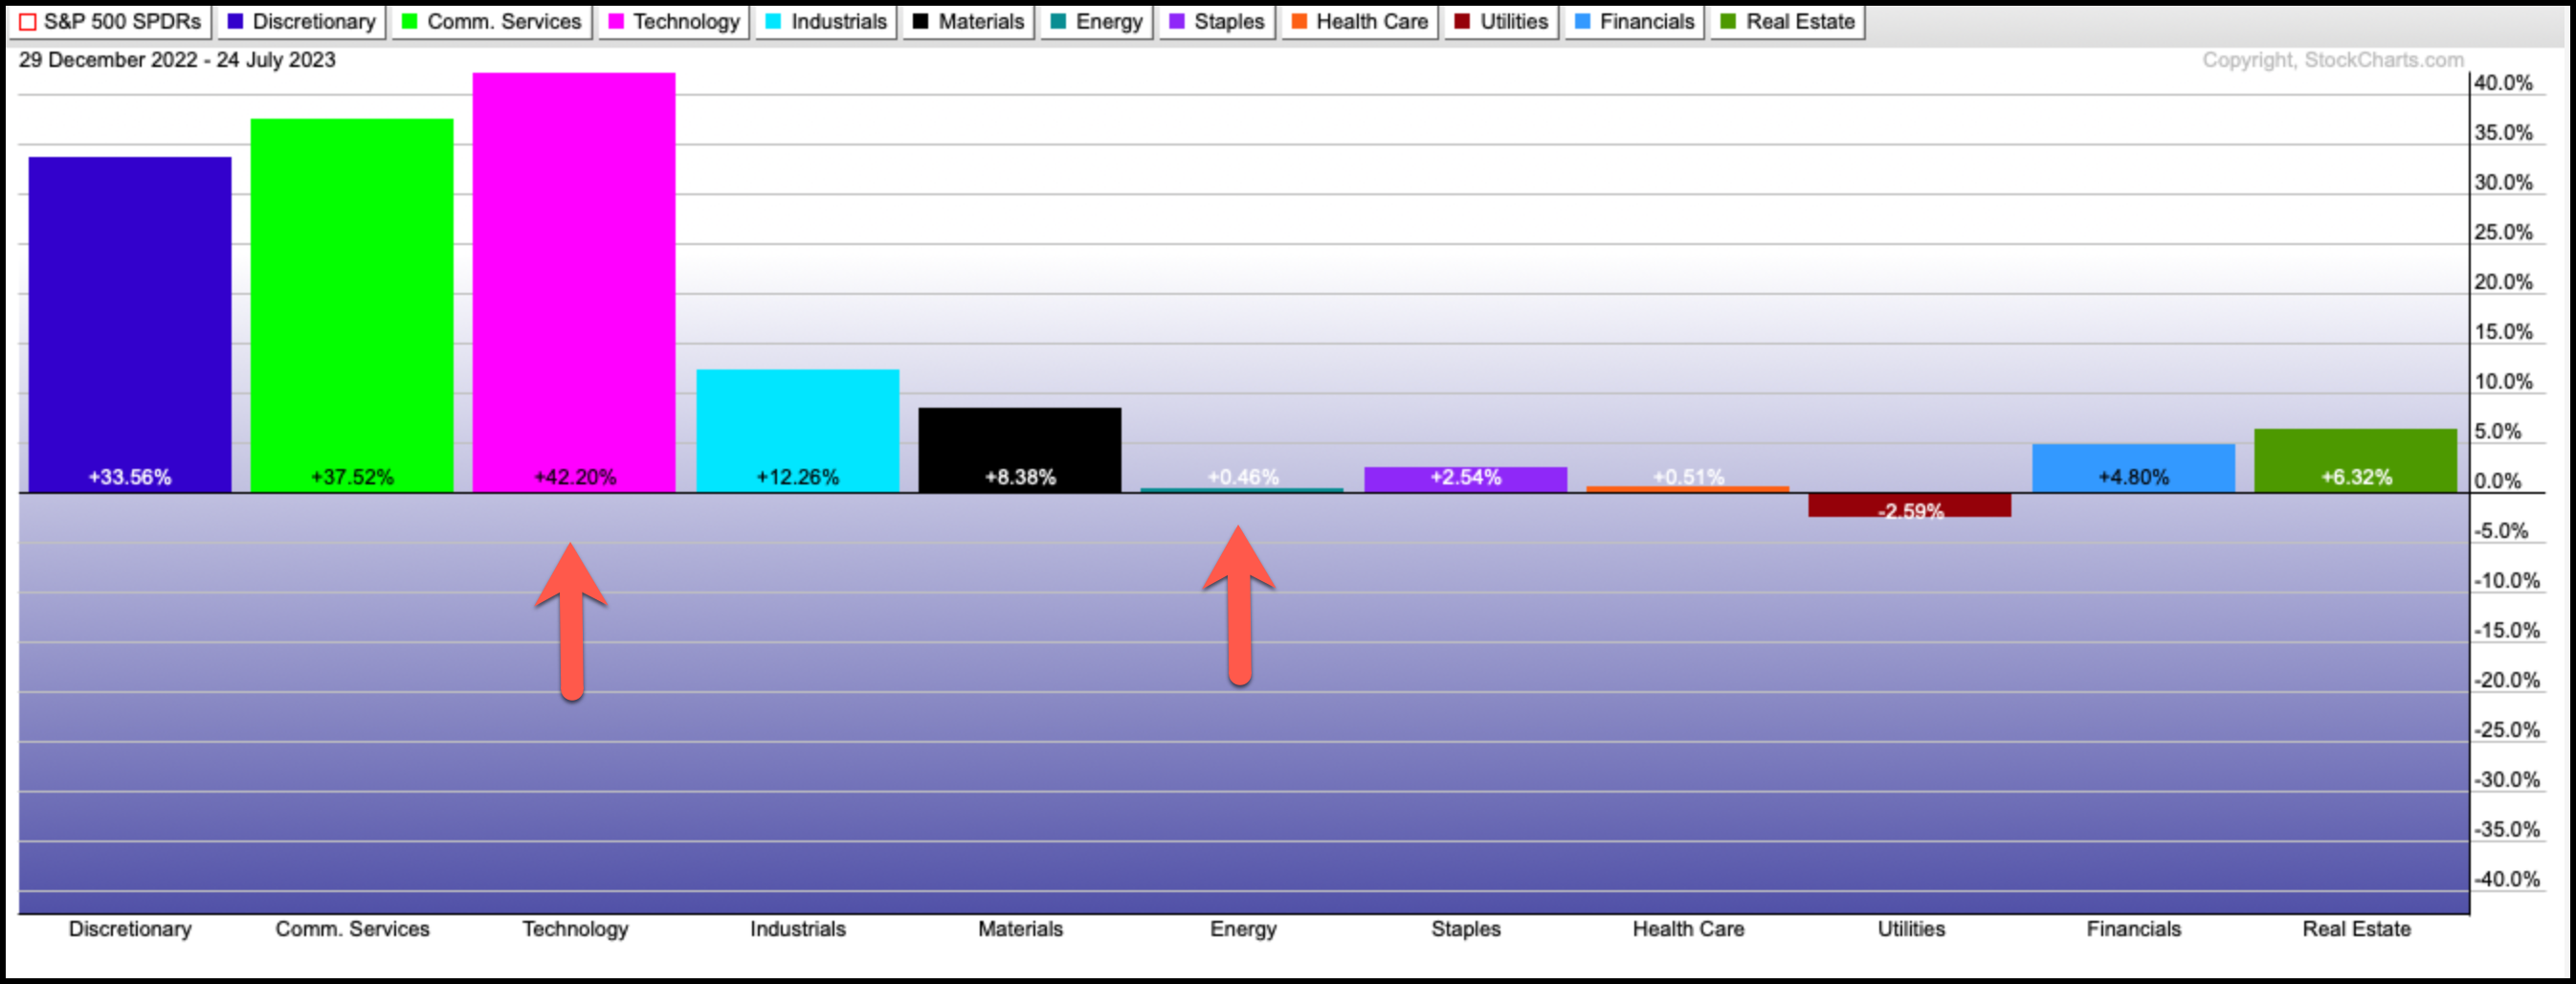
This simple, yet effective RS ratio analysis would have tipped you off to this change, giving you the opportunity to participate in Tech’s reemergence.
But the message here isn’t about what we already know. What’s interesting is a potential setup for a return of Energy.
Now, we can’t say for sure – only time will tell.
But by using this same RS analysis we can visualize an interesting change in the dynamics between energy (XLE) and technology (XLK). Is energy drawing a line in the sand?
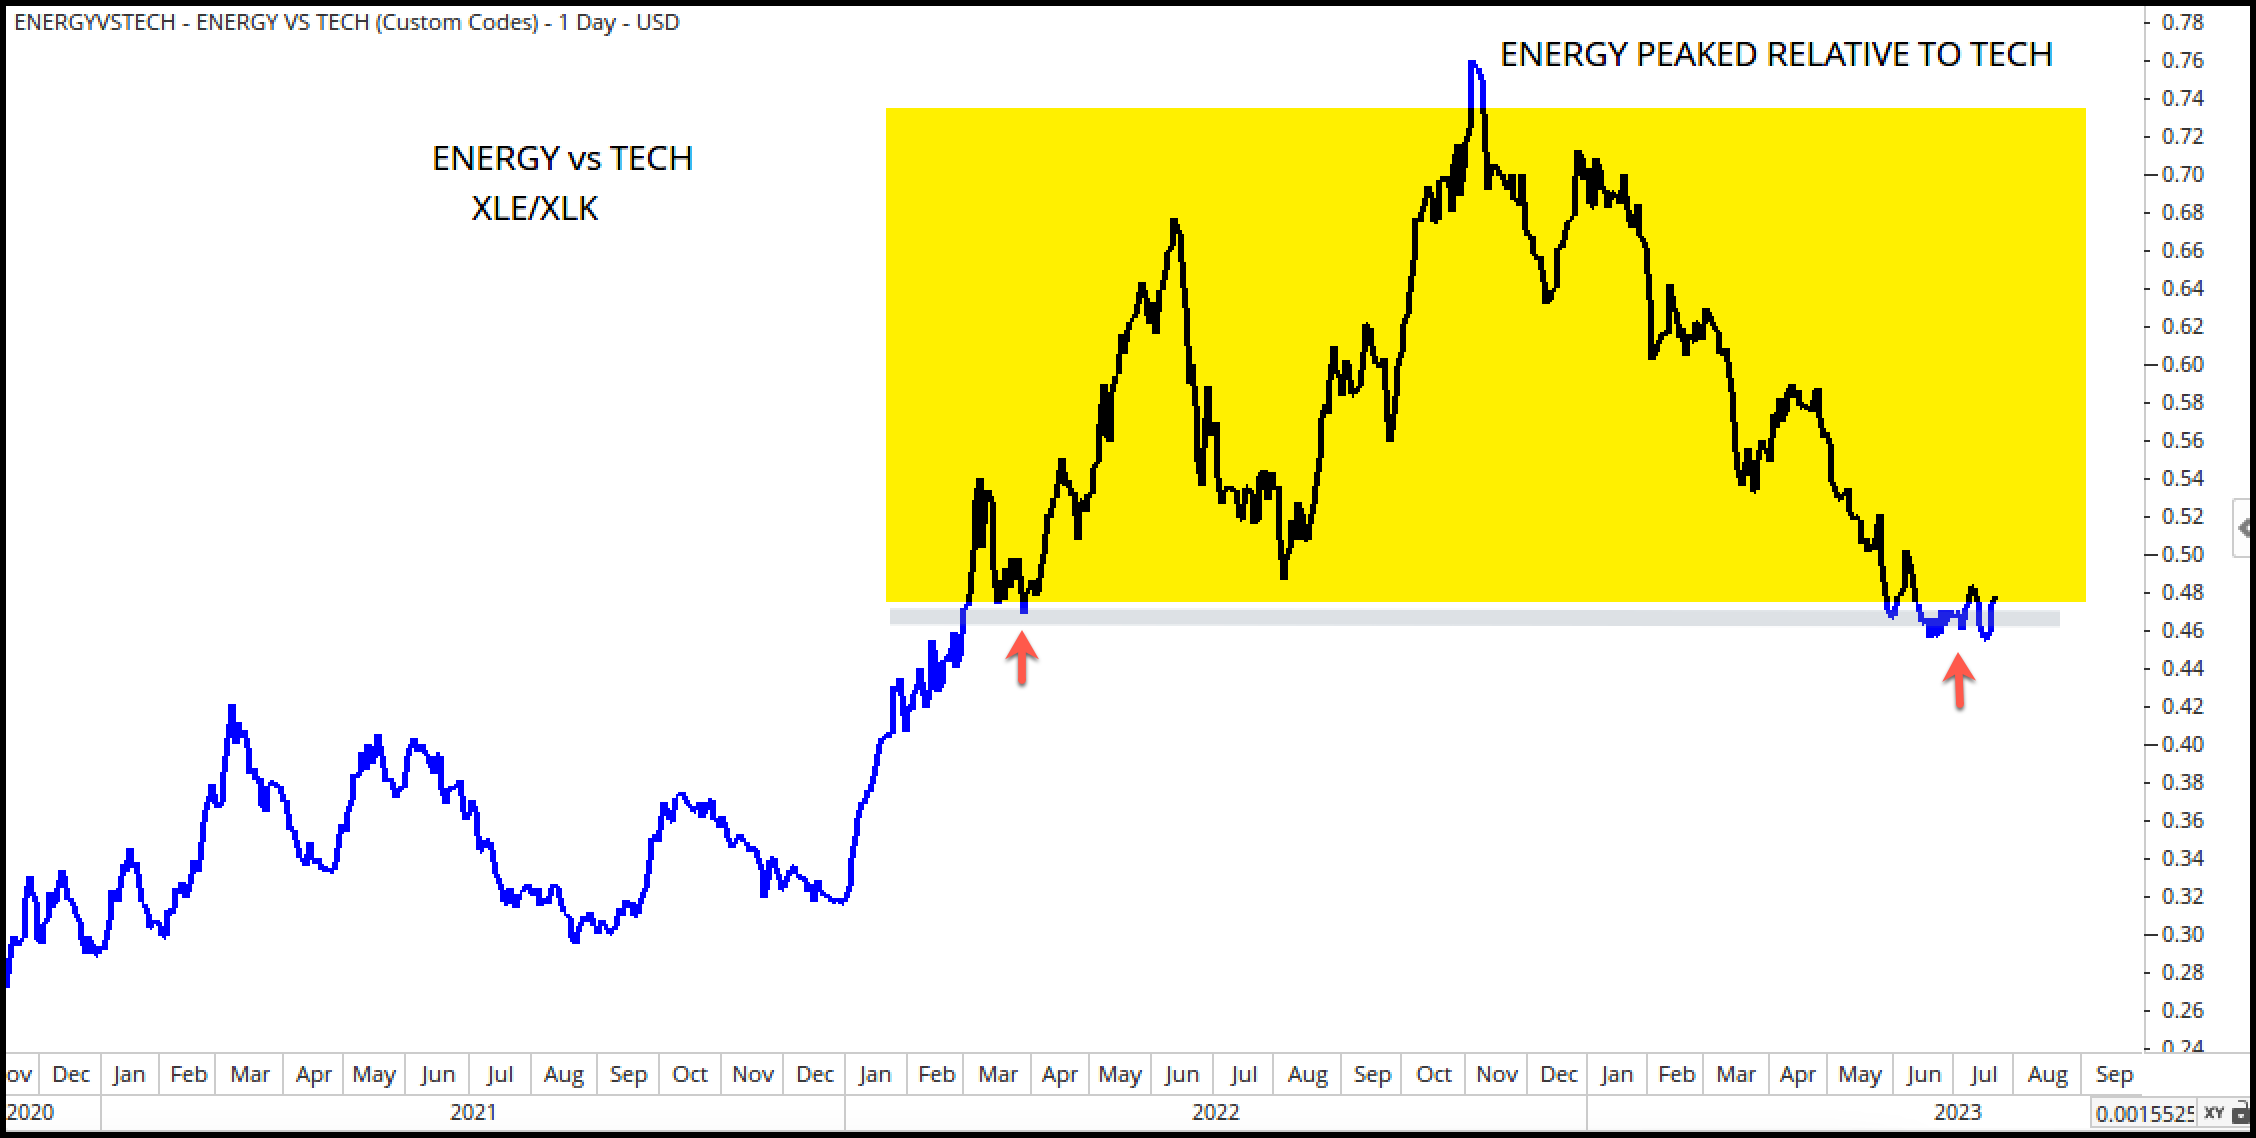
Either we’re looking at a massive topping pattern for Energy in which prices break below former support continuing lower…
Or Energy is at a logical spot to find support at the 2022 lows, setting up a potential rebound.
If XLE holds here, then Energy and related stocks will look very interesting in the second half of 2023.
Prices of energy-related commodities have already been showing signs of life this quarter with home heating oil, gasoline, Brent, and WTI crude oil all posting double-digit gains.
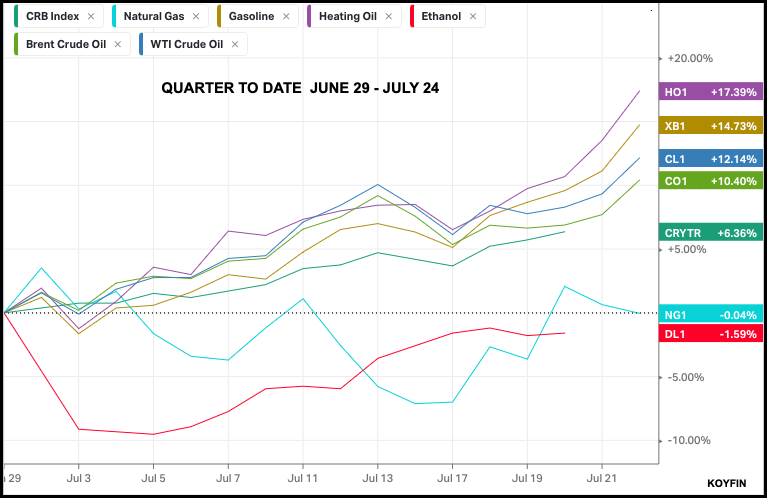
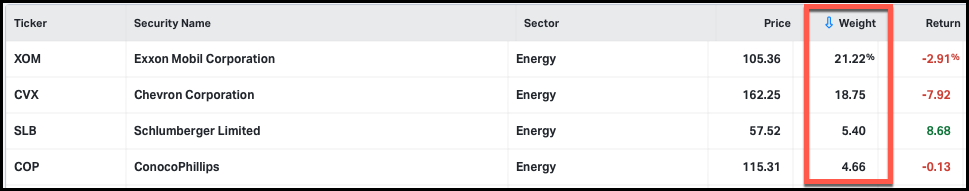
Energy-related stocks found in XLE have yet to reflect the gains of these commodities (50% of XLE is comprised of just four companies).
So, until they start playing catch-up, I wouldn’t expect any significant changes out of XLE. But there’s something interesting to see at the industry level.
The energy equipment and services industry component are posting solid YTD returns of 9.26%
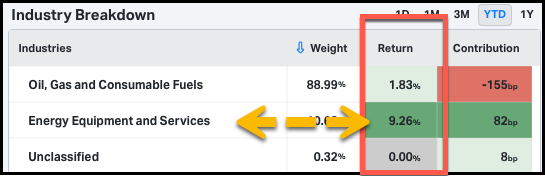
But because this group only makes up around 10% of the fund, they need to be noticed.
Here’s an example of an ETF that lives in the universe of oil services and equipment – it’s the VanEck Oil Services ETF (OIH).
The price chart of OIH shows a clear upside move off its most recent low in early June.
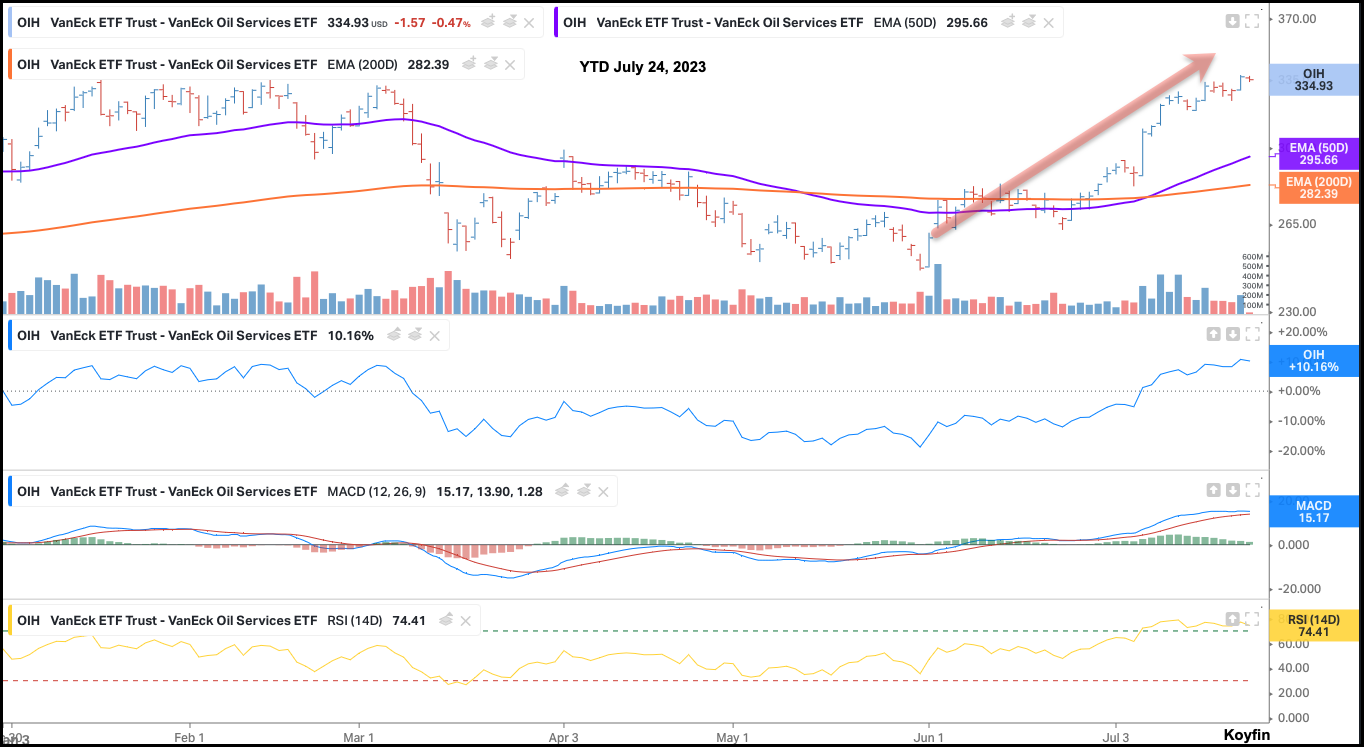
This is one ETF to keep an eye on if oil and energy-related stocks and commodities can show continued strength, the oil services group would be a beneficiary of that strength.
If you have any questions or have been considering hiring an advisor, then schedule a free consultation with one of our advisors today. There’s no risk or obligation—let's just talk.

Free Guide: How to Find the Best Advisor for You
Get our absolutely free guide that covers different types of advisory services you'll encounter, differences between RIAs and broker-dealers, questions you’ll want to ask when interviewing advisors, and data any good financial advisor should know about you and your portfolio.
