
Related Blogs
January 28, 2022 | Avalon Team
 Welcome to week four of the series The Death of 60/40.
Today, we’ll continue to explore stock market valuations and what they portend.
John Bogle, the late, legendary founder of Vanguard Funds used a simple formula to determine future market returns:
Future Market Returns = Dividend Yield + Earnings Growth +/- Change in P/E ratio.
In his book Don’t Count On It, John Bogle presented the following table:
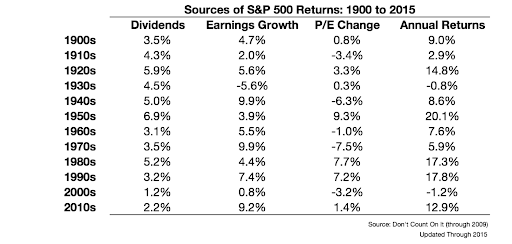
What’s interesting here is how inconsistent the change in P/E has been decade-to-decade. At times high earnings growth has led to multiple expansions, while other times it led to a contraction in that multiple people were willing to pay for earnings.
Fundamentals matter over the very long term, but even over decade-long stretches, investor sentiment can trump all. And the reason for this is because the P/E change is really a gauge of investor sentiment or emotions.
When investors are feeling good, they’re willing to pay a higher multiple of earnings for stocks. When they’re feeling nervous, they’re willing to pay a lower multiple of earnings for stocks.
The problem with trying to forecast stock returns is that you’re really trying to guess how people will feel in the future.
Let’s take a look a look now at dividend yields.
The total return is the amount an investor earns that includes all of the distribution of dividends, plus any price appreciation.
In the white paper “Why Dividends Matter,” Dr. Ian Mortimer and Matthew Page, co-managers of Guinness Atkinson Funds, concluded that dividends account for as much as 42% of total return over periods of 5 years, 48% over 10 year periods, and as much as 60% during periods of 20 years or more.
In short, dividends matter can matter a great deal.
Today’s dividend yield on stocks of 1.40% is well below the historical average of 4.24%.
It’s important to note that in 1982, at the start of the best market period performance, dividend yields were near 6% and thus represented an above-average yield.
By the end of 2000, the average yield on stocks had fallen to 1.22%, well below the historical average, and not that dissimilar to today’s dividend yields.
Now let’s see what earnings growth can be expected…
FactSet expects CY S&P 500 aggregate earnings to be about $222.32. This implies a forward P/E of 19.48 based on the current level of the S&P 500.
On its own, that does not seem that unreasonable, but here are a few things to remember:
- These are estimates subject to change. Historically, industry analysts have overestimated at the beginning of the year by about 7.2%
- Stocks trade with a risk premium over “riskless” securities. If interest rates were to continue to rise, then the risk premium will need to be larger, and thus the larger the discount that stocks would likely trade.
- The current inflation could cause the P/E multiple to deflate. As the chart below shows, there is a strong correlation between CPI and Earnings Yield (the inverse of the P/E ratio) over the last seven decades.
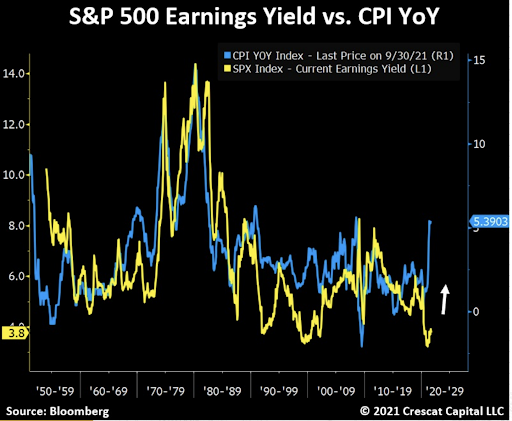
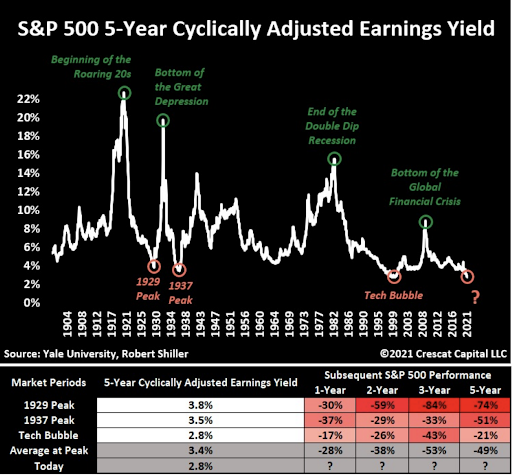
Historically, such depressed earnings yields as we have today have always led to significant market meltdowns.
Going back to John Bogle’s Expected Return Formula, we find that today we have historically low dividend yields and a historically high P/E ratio in an environment where interest rates are rising and inflation is increasing.
Collectively, this foretells that stock market returns may be under pressure until more reasonable valuation metrics are reached.
Unfortunately, there are some other measures that also suggest an overvalued stock market.
Named after Warren Buffett, who called the ratio “the best single measure of where valuations stand at any given moment”, the Buffett Indicator is the ratio of total the United States stock market valuation to GDP.
As of January 20, 2022, the indicator stands at 202% meaning that the aggregate U.S. market value ($48.1T) is valued at over twice the annualized GDP ($23.8T).
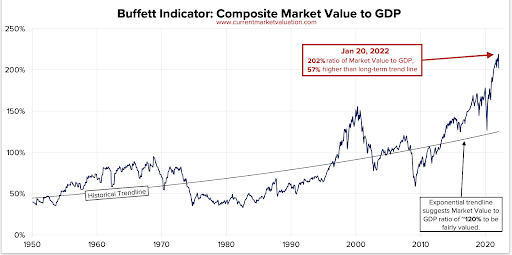
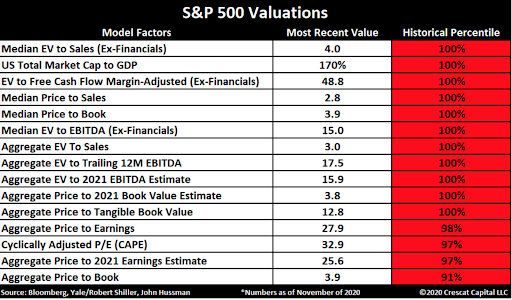
We can see how not just a few singular indicators are suggesting an overvalued market, but rather a concert of market valuation metrics.
The data suggests that it would be unreasonable for passive buy-and-hold approaches to the stock market to return anything similar to the past decades’ returns that investors may have come to expect.
The past several decades have been marked by falling interest rates, falling inflation, low starting valuation multiples, and expansionary Federal Reserve policy.
If investors look today, all of those factors are no longer present and suggest a much different future stream of returns.
Next week, we’ll examine the historical contribution of bonds to the 60/40 Strategy and what investors can expect today.
If you have any questions or have been considering hiring an advisor, then schedule a free consultation with one of our advisors today. There’s no risk or obligation—let's just talk.
Tags

Free Guide: How to Find the Best Advisor for You
Get our absolutely free guide that covers different types of advisory services you'll encounter, differences between RIAs and broker-dealers, questions you’ll want to ask when interviewing advisors, and data any good financial advisor should know about you and your portfolio.
