
Related Blogs
May 2, 2019 | Michael Reilly
Today we flip the calendar from April to May, and with the turn of the calendar we welcome warmer days.
Trees are once again budding, birds are singing, and flowers are in full bloom, adding a pop of color to what had become a dreary landscape.
And, like spring in New England, the markets have thawed and stocks have rebounded from an icy December, providing investors a little sunshine in the way of profits.
But, is it time to take what Mr. Market has given us since January and sell stocks?
It’s May after all, and there’s the old investment adage – “Sell in May and go away”.
For those not familiar with this old saw, it’s said that the market has a good six months to invest and a bad six months to invest.
You see, historically speaking, June, July, August, and September are known to be the worst months of the year for the stock market. Hence the adage – “Sell in May and go away”.
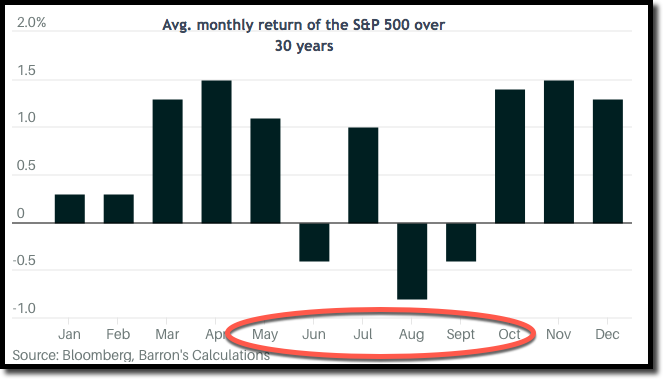
The average monthly return for that span over the past 30 years is negative 0.1%.
The average monthly return the rest of the year is 1.1%.
Why the historical bias? Well, the reasons can vary.
I’ve heard it all. Everything from all of Wall Streets major players taking the summer months off,and not returning until fall, to changes in investor psychology – transitioning their thinking from current year earnings to waiting on next year’s guidance.
Regardless of reason, one thing is sure, journalists love to write about the old “Sell in May” adage. You can count on it just as you can count on trees blooming in the spring.
It’s the reason I’m writing about it today!
The relevance is this: through 2016, all of the gains in the Dow Jones Industrial Average since 1950 have come between the months of November and April.
In other words, had you bought the Dow every May 1st and sold on Halloween every year since 1950, you would have actually had a negative return.
Traditionally, we’ll see underperformance in what the Stock Trader’s Almanac refers to as the “Worst 6 months”.
I’ve highlighted these months in the charts of the DOW, S&P500, and NASDAQ. As you can see, the charts tend to be more flat during the May – October time period when compared to the “strong six months”.
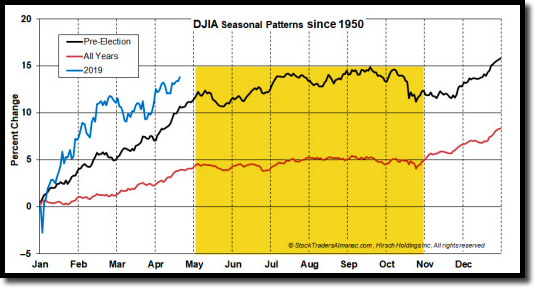
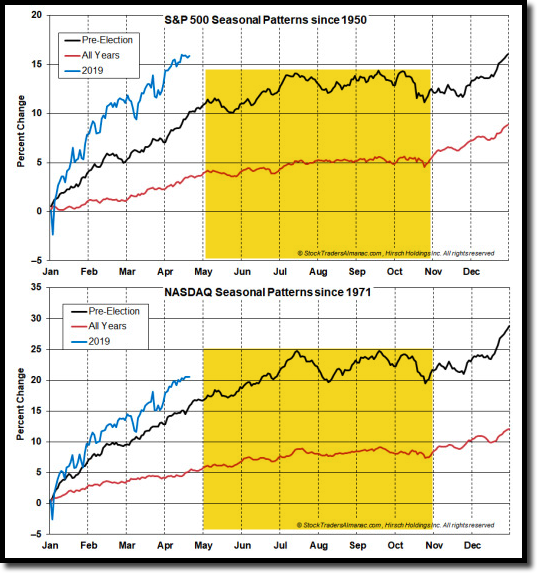
Charts courtesy of Stock Trader’s Almanac
2019 has seen a strong start to the year – well above both the historical average for all years, but also above the pre-election year average.
Pre-election years are historically the best year for stocks in a 4-year presidential cycle.
Here’s my take on the whole “sell in May” strategy. Has it worked out in the past? Yes. But, I would never advise anyone to rebalance a portfolio simply by the date on a calendar.
It’s more important to ignore season tendencies and focus on what the market is giving us.
Because the market can ignore seasonal tendencies.
A good example was in 2008 when stocks sold off violently during the “Best 6 Months”. From November 2007 through April 2008, the Dow Jones Industrial Average lost 8%.
In 2000, during the “best 6 months”, the Dow was down 2.2%.
On the flip side, stocks did well during the “Worst 6 months” in 2016 prior to the U.S. Presidential election.
So, should we sell in May?
I don’t know. Maybe. But Seasonality shouldn’t be the reason.
And…this is where the technicals can become an investors best friend.
If you had no calendar, the questions you need to answer is..
- Are there more stocks in an uptrend than a down-trend?
- How many sectors are making new highs, how many are making new lows?
- If stocks are consolidating, are they resolving higher or lower?
The answers to these questions are much more likely to be part of a successful investment strategy then blindly following buying or selling based on a date on the calendar.
Of course, one of the reasons we believe so strongly in Relative Strength investing is that it allows us to find the sectors of the market that are still “strong”, even when the overall market is struggling to keep up.
To quote another old adage, “there’s always a bear market somewhere”, and when you start to break down the market into narrower and narrower sectors, you almost always find this to be true.
When we rank stocks and ETFs by relative strength, we compare them laterally to their peers, which allows us to find outperforming “winners”, often even before their major upward price action kicks off.
If you’re interested in taking a look at some of our Relative Strength based models, which rebalance to only contain the highest ranked sectors, don’t hesitate to book an appointment with one of our advisors.
Qualified investors with at least $500,000 of investable inventory are eligible for a completely free portfolio evaluation and risk assessment. This will allow you to quickly see how much Relative Strength your current portfolio is carrying, and how much you’ve really got on the line when the markets take a dive.
Click here now to see available appointment times.
As always, invest wisely.

Get Our FREE Guide
How to Find the Best Advisor for You
Learn how to choose an advisor that has your best interests in mind. You'll also be subscribed to ADAPT, Avalon’s free newsletter with updates on our strongest performing investment models and market insights from a responsible money management perspective.
