
Related Blogs
May 7, 2019 | Michael Reilly
Saturday, May 4th, marked the 144th running of the Kentucky Derby – dubbed the most exciting 2 minutes in sports.
This year’s running lived up to its billing and was not without its share of controversy. At the end of the day a horse named Maximum Security won the race – or so we thought.
For the first time in Kentucky Derby History, the winner was disqualified for interfering with another rider’s progress during the race. This proved to be a very costly mistake indeed.
And, just as horse and rider jockey for position as they round the 2 mile track moving from 7th place to 3rd…or 1st to 5th –
We’re reminded that the running of the Derby is not unlike watching a relative strength race between sectors, fighting for the top positions out of the 11 broad sectors that comprise the S&P 500.
As a refresher, our Core 4 U.S. Sector model (one of our most popular models) uses algorithms to rank all 11 broad U.S. equity sectors against one another.
We run this race the second Tuesday of each month and tally up the rankings – the 4 strongest sectors are declared that month’s winners and find themselves representing the Core 4 model.
Some months the same 4 sectors remain dominant and the portfolio remains unchanged.
Other months leadership changes and some sectors are replaced by new sectors that are strong enough to overtake the previous leaders, finding themselves in the winner’s circle.
The idea behind the model is simple – just like a horse race, the 11 broad sectors of the S&P 500 don’t all move up or down in unison.
Typically, some sectors are moving up, while others are moving down – either that or sectors are moving up by more or down by less than their constituents. Much like a race.
I’ve created a sector quilt to demonstrate the annual change of strong vs weak sectors.
Sector proxies are SPDR sector funds.
(Click Image to Enlarge)
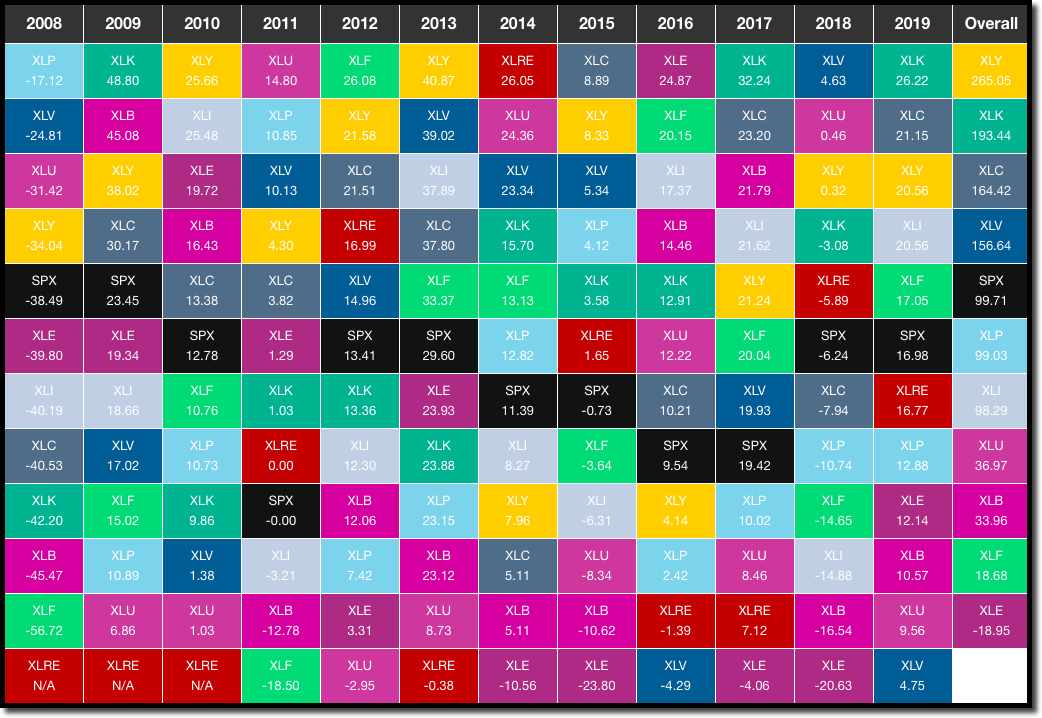
Each colored box represents one of the 11 sectors. The black box (SPX) illustrates annual performance of the S&P 500.
As you can see, SPX resides in the middle of the field – never finding itself at the top of the pack nor the bottom – that’s because SPX represents ownership “of the market”, or of all 11 broad sectors.
Therefore, SPX owns both strong sectors helping to run performance up and weak sectors forcing performance down. That’s what creates its average performance.
Why be average?
Take 2013 for example, a good year for the market with SPX returning 29.60%. But an investment in XLV (the SPDR Consumer Discretionary Fund) outpaced the return of SPX with a gain of 39.02%.
2017 saw SPX gain 19.42%, while investors who follow a relative strength process saw opportunity in XLK (SPDR Technology Fund), as it crushed the S&P 500 index, gaining 32.24%.
Even in 2011, a year where the market was flat and the S&P offered no return at all, XLU (the SPDR Utility ETF) gained 14.80%.
This year (2019) is no exception, as the Technology sector continues its dominance, with XLK gaining 26.22%, YTD, compared to the S&P 500’s gain of 16.98%.
We know that many studies have concluded that investing in the 4 strongest sectors and rebalancing periodically to avoid weaker sectors can provide market beating returns.
It makes sense, focus investment capital in areas of market strength and rising prices, sell holdings in weak sectors with falling prices, and rebalance at regular intervals to maintain a strong allocation.
It’s a bit more complicated than that, but this idea remains the foundation of momentum strategy.
If you’re an investor who finds themselves sticking to this “middle path” of traditional investing, it may be time to consider some more lucrative options…
For more information about our Core 4 portfolio or any of our other relative strength investment models, we invite you to contact us today, either by emailing us at info@rowewelath.com or by clicking here to book an appointment with one of our advisors.
An appointment with an advisor carries no commitment, you’re more than welcome to simply call in and ask us a few questions.
Qualified investors with a portfolio of at least $500,000 are also qualified for a completely free relative strength evaluation, which will quickly allow you to see points of strength and weakness in your current holdings, as well as assess your account’s overall risk.
Click here now to see available appointment times.
And, as always, invest wisely.

Get Our FREE Guide
How to Find the Best Advisor for You
Learn how to choose an advisor that has your best interests in mind. You'll also be subscribed to ADAPT, Avalon’s free newsletter with updates on our strongest performing investment models and market insights from a responsible money management perspective.
