
Related Blogs
April 22, 2019 | Michael Reilly
Over the weekend we had a major shakeup in sector rankings:
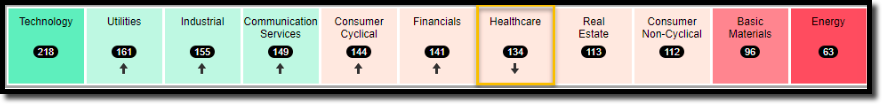
For the first time since August 14, 2018 Healthcare has dropped out of the top four strongest sectors of the 11 domestic sectors we track.
Not only was Healthcare pushed out of the top four, it fell off a cliff, plummeting…all the way down to #7.
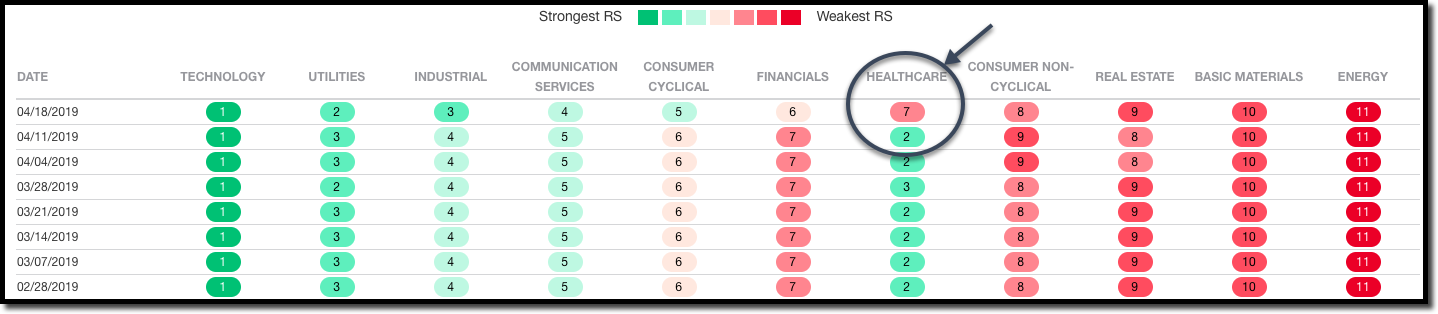
 Graphics courtesy of Nasdaq/Dorsey Wright
Clearly, investors should take note.
Savvy investors know that when it comes to investing in domestic equities, a strong case can be made for allocating investment capital to the four strongest market sectors, while minimizing exposure to weaker sectors.
Many relative strength studies indicate that following this strategy has provided investors market beating returns – (see last week’s Adapt discussing Momentum as a strategy).
So while Healthcare has lost its mojo – forcing relative strength models like ours to sell out of the healthcare sector, another sector has moved up to fill the void.
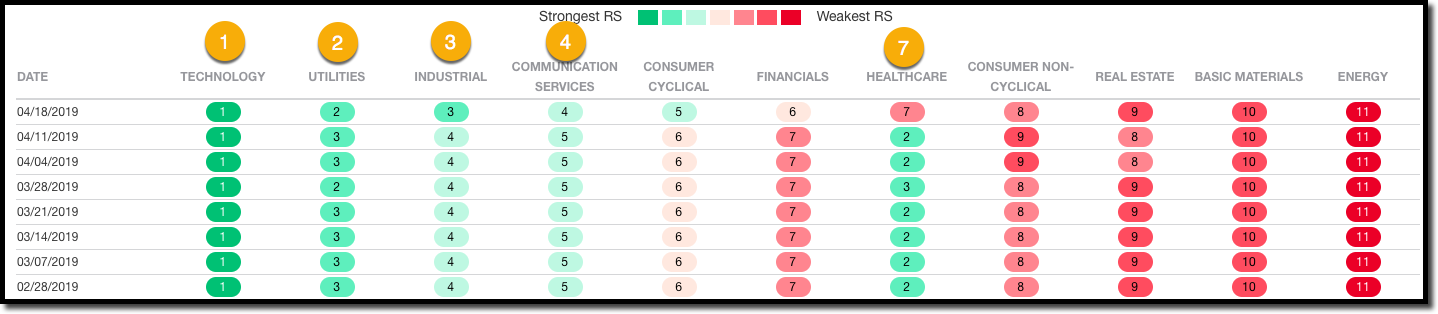 Graphic courtesy of Nasdaq/Dorsey Wright
Communication Services is making its first appearance in the top four for the first time since November 30, 2017 – joining Technology, Utilities, and Industrial as the top four strongest sectors on a relative strength basis.
If you follow a relative strength strategy for your investment dollars, here are 5 Communication Services ETF to consider for your portfolio.
- Invesco Dynamic Network Portfolio (PXQ)
- First Trust Cloud Computing Fund (SKYY)
- Invesco Dynamic Media Portfolio (PBS)
- First Trust Dow Jones Internet Index (FDN)
- Communication Services Select Sector SPDR Fund (XLC)
All 5 of these ETFs rank highly according to the proprietary scoring system that we employ here at RWM.
All 5 have moved well off the recent lows of December 24, 2018, right along with the S&P 500.
Many investors will read that prior sentence, believe they missed the biggest moves already, and throw up their hands in frustration. But before you do…
Remember what the data suggests:
If we peel back the all the numbers – the charts, lines, and indicators – and consider what the data really means, it comes down to something very simple. Price behavior.
That’s really what we focus on in technical analysis – changes in price.
And changes in prices are caused by one thing – changes in investor behavior.
Sometimes those changes are fast and furious, leaving long-term investors little time to disseminate the data – similar to what investors experienced last December. Other times these changes can result in long-term demand for or supply of stock in any particular market. It’s these long-term moves we want to be a part of.
Our goal is not so much to understand why investor behavior has changed (although that’s nice) – our focus is particularly on large institutional money, often considered the “smart money.” These are the investors with enough capital to actually move the needle and direction of the markets.
Track what the institutions are doing and you’ll know what they’re thinking. And right now, big institutional investors like Goldman Sachs and large hedge funds are showing their hand – selling Healthcare related securities in favor of Technology, Utilities, Industrials, and Communication Services stocks.
If we can apply technical analysis and track how the big institutions are deploying their capital, then we have an advantage – an investment edge.
Because this data can act as a compass, an investor armed with this knowledge is no longer blind in the market. Turn when the direction of the compass changes, sit tight while it points North.
This is precisely why we’ve designed many of our models to rebalance so they’re always taking advantage of the highest ranked relative strength sectors. After all, it’s really the institutional investors, the big money, that dictates major swings in the market, and relative strength rankings are a good indication of which direction this money is flowing.
By following these trends, you stand a good chance of capturing a lot of this institutional action yourself, which is one of the reasons studies consistently show that relative strength investing provides a good chance at outperforming the market.
If you’re interested in a closer look at some of our relative strength models, please don’t hesitate to schedule a consultation with one of our advisors today.
Qualified investors, with at least $500,000 of investable inventory, are eligible for a 100% free portfolio evaluation, which can allow us to quickly determine how much relative strength your current portfolio holds, and see if you’re missing out on the potential growth one of our models could provide.
Click here to see available appointment times now.
And, as always, invest wisely.

Get Our FREE Guide
How to Find the Best Advisor for You
Learn how to choose an advisor that has your best interests in mind. You'll also be subscribed to ADAPT, Avalon’s free newsletter with updates on our strongest performing investment models and market insights from a responsible money management perspective.
