
Related Blogs
January 8, 2020 | Michael Reilly
 For most of us, January 1 of a new year marks a time to reset, reevaluate and set goals for the new year. On the other hand, the markets could care less about an arbitrary change in the calendar.
Markets today continue to do what they did throughout 2019 – rise to new all-time or 52 week highs – in spite of headlines and geopolitical concerns.
We can see it in the price charts in the U.S. We can see it in Europe, Asia and Emerging Markets. And now even Canada is getting in on the action!
So, with the backdrop of strong global equity markets, today we’ll focus our attention on a strong U.S. sector that looks ready for a breakout year.
The chart below is a 10 year price chart of the SPDR Industrial sector ETF (XLI). XLI is often used as a broad sector proxy for industrials – so we won’t buck the trend (did you get it? “buck”… a “trend” – a favorite in technical analysis)….
Okay, moving on – see the chart below, I’ve highlighted two important areas of consolidation that have taken place in Industrial stocks.
The first takes place between 2014 and 2016, in the middle of the chart. The highlighted area is an almost two year period of sideways consolidation (04-01-2016 to 01-12-2018), as supply and demand wrestled for control over the sector.
(Click any image to enlarge)

Following the initial breakout, (call it July 1, 2016) the Industrials sector gained 47.14% until January 16, 2018.
Compare the gain in Industrials to the 32.49% return of the S&P 500 Index (SPX) over the same time frame.
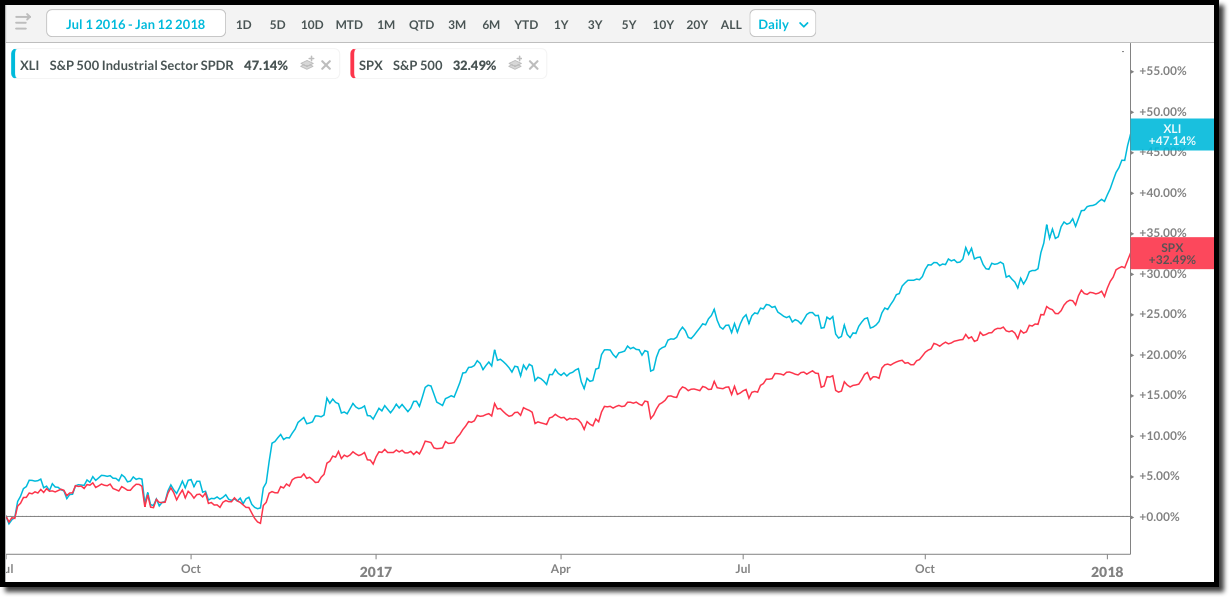
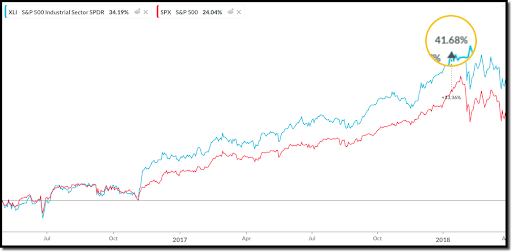
Industrials were a clear winner, as momentum offered up returns 41.68% greater than what the average stock market participant gained. We call that opportunity cost – or what you could have earned elsewhere.
Let’s put that in perspective for a moment. In real dollar terms, for anyone doing some quick back of the napkin math, that’s a potential payday that includes an additional $41,680 on a $100,000 investment.
The bottom line, and the crux of momentum/relative strength investing, is: why own the entire market (SPX) when, with a little know-how, you can find market beating opportunities like the one I shared above?
Now for some really exciting news. This article isn’t about how cool it would have been if you were “lucky” enough to have spotted the new trend in industrials back in 2016.
Investors want to know what is happening now. We write all the time about the importance of ADAPTING your investments to what’s working and avoiding what isn’t.
Well, check out the chart below – it’s the same chart of Industrial stocks (XLI) as above, but a shorter time frame – six months.
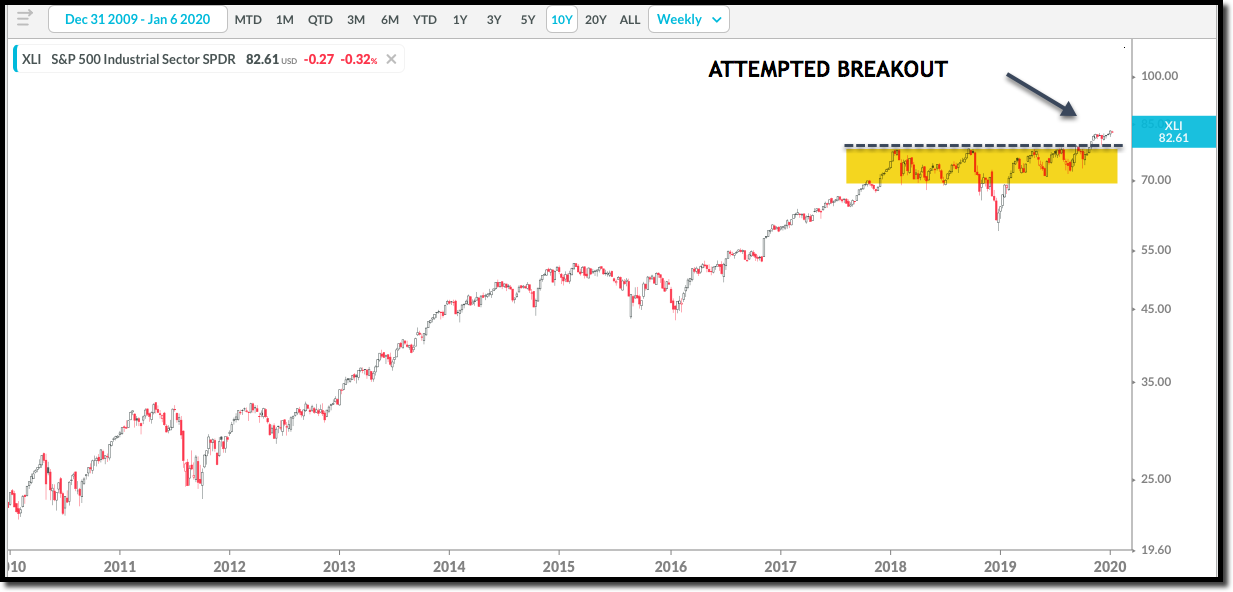
Look at the highlighted area, this represents XLI’s most recent (current) nearly 20 month consolidation. Now focus your eyes on the black arrow.
Could it be that Industrials are once again breaking out to the upside? If the breakout sticks, it could offer up some very attractive and perhaps market beating returns, just as it did following the 2016 breakout.
Now, as the disclaimer goes – investors must understand that history doesn’t always repeat itself. It’s possible industrial stocks skyrocket, and it’s possible they pullback and this will be a failed breakout. We simply don’t know yet.
The strategy is – Adapt to the changing investment environment and take advantage of opportunities as they present themselves.
To help along that line, I’m sharing three sector ETFs to look into and three individual stocks from the industrial sector to put on your radar.
Exchange Traded Funds:
Invesco Shipping (SEA), S&P SPDR Aerospace and Defense (XAR) and the Invesco Industrial Momentum Portfolio (PRN)
Individual stocks:
Triumph Group (TGI), Teledyne Tech (TDY) and Parsons Corp (PSN)
These are the stocks and ETFs you’ll want to keep tabs on in the near future. Of course, if you’re getting tired of micromanaging your own portfolio you may instead be interested in the advisor services Rowe Wealth offers.
We constantly monitor changing market conditions in order to keep our clients in sectors with high chances of breakout gains, like those discussed above.
If you’re an investor with a portfolio valued least $500,000 you’re eligible for a 100% free portfolio evaluation. This will allow you to accurately assess your level of comfortable risk and identify areas of your portfolio that need improvement.
Improvement might mean you’re exposed to too much risk, or it might mean you’re missing out on significant gains in stronger areas of the market.
If this sounds like something you may be interested in, call 866.711.2836 Ext 3 to schedule an appointment with one of our advisors.
Until next time – invest wisely.
MJR

Get Our FREE Guide
How to Find the Best Advisor for You
Learn how to choose an advisor that has your best interests in mind. You'll also be subscribed to ADAPT, Avalon’s free newsletter with updates on our strongest performing investment models and market insights from a responsible money management perspective.
