Related Blogs
February 14, 2020 | Michael Reilly
 The stock market’s been on an impressive run and investors are giddy. The S&P 500 index ended 2019 with a very impressive 28.88% gain.
It seems nothing could slow this market down. In the 4th quarter of 2019, SPX gained +9.77% and broke out to new all-time highs.
(Click any image to enlarge)
Equity markets barely paused long enough for investors to celebrate the new year before picking up January 1st right where it left off… surging over 4% in the first 42 days of 2020 – and this in spite of a crisis with Iran and the impeachment of a U.S. President.
Nothing seemed to slow this market’s momentum.
It’s probably not a surprise to many of you that the technology sector was a major contributor to the S&P’s record setting pace. On both a relative strength and absolute return basis, technology remained the strongest U.S. sector throughout all of 2019.
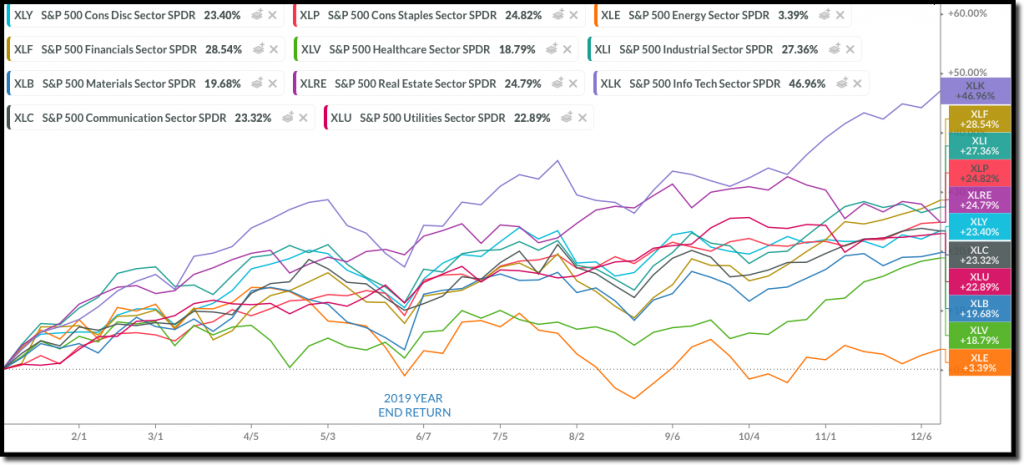
If you want to see what outperformance looks like, take a look at the sector performance graph below.
The S&P Technology sector SPDR ETF (XLK), considered a sector proxy, gained 46.96% in 2019. This was well ahead of any of the other 10 broad sector ETFs we track, and double the return of some of the lower performers.
SECTOR PERFORMANCE 2019:
Tech’s dominance is important, because the technology sector makes up nearly 20% (19.9%) of the entire S&P 500 index.
So any significant move in tech stocks can have a direct impact on the direction of the S&P 500.
Putting on our detective hats and digging a little deeper into the technology sector – we find that Apple (AAPL) represents a hefty 19.6% weighting of XLK.
And this billion dollar behemoth accounts for almost 5% (4.83%) of the S&P 500.
With such a disproportionate weighting of the S&P, any significant move down in AAPL could drag the market with it.
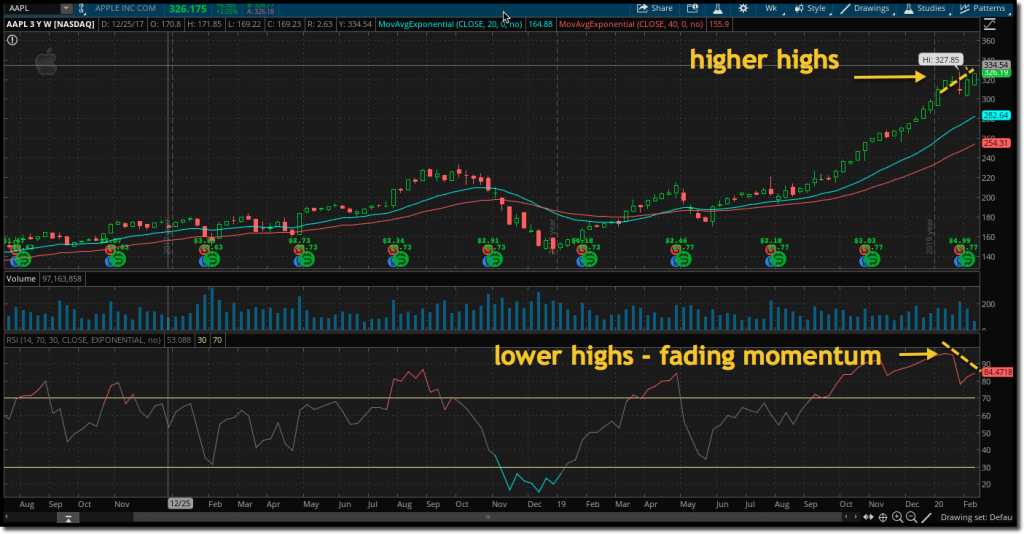
Which leads me to a potentially alarming signal I’m seeing in Apple’s price chart.
A “negative divergence”..
For those unfamiliar with divergences and a refresher for those who are: A divergence occurs when the price of a stock moves in one direction, while momentum is moving in the opposite direction.
What it means is the price movement of the security isn’t being confirmed by a momentum indicator like the RSI.
When this happens, it can signal a change in trend for the stock.
There are both positive (bullish) and negative (bearish) divergences. A bullish (or positive) divergence happens when prices are in a downtrend, making lower lows, but the RSI is making higher lows (see illustration) – with momentum picking up steam ahead of a corresponding rise in price – it’s often just a matter of time before price moves higher.
Conversely, a bearish (or negative) divergence is created when a stock’s price continues higher while the RSI (momentum) reflects lower highs – indicating momentum for this security may be fading and prices could soon fall.
That’s what we are seeing with Apple right now – a negative divergence.
And with Apple representing nearly 5% of the entire S&P 500 index, a negative divergence is flashing like a yellow light at a 4 way intersection – investors should proceed with caution.
Because if the price of Apple shares reverses and begins to fall, it could drag the S&P down with it.
Although the negative divergence we are seeing in Apple is important, it is only one piece of evidence in the weight of the evidence/relative strength analysis we apply to the markets everyday.
A negative divergence in a major market participant like Apple shouldn’t be ignored. But also should be evaluated in the context of the overall market.
I’ll have more about current market conditions as a follow up to today’s Adapt.
I hope to have something out over the next few days.
But I wanted to get this out pronto quick!
Until next time,

Mike Reilly
Director of Risk Management, Rowe Wealth
P.S. Rowe Wealth management is currently accepting new wealth management clients, and is offering completely free portfolio evaluations to investors with portfolios valued at least $500,000. If you’re interested in a free evaluation that will allow you to quickly evaluate your portfolio’s overall strength and risk levels, please call 866.711.2836 Ext 3 today to book an appointment.

Get Our FREE Guide
How to Find the Best Advisor for You
Learn how to choose an advisor that has your best interests in mind. You'll also be subscribed to ADAPT, Avalon’s free newsletter with updates on our strongest performing investment models and market insights from a responsible money management perspective.


