
Related Blogs
February 21, 2020 | Michael Reilly
Markets are fluid, and success often demands a willingness to adapt or risk being on the wrong side of a trade.
 Because relative strength relationships and inter-market relationships between asset classes change – we pay attention.
We’ve been watching breadth in stocks deteriorate, especially since mid-January. The majority of stocks are down over that period, while bond prices are ripping to new all-time highs. This is one of those inter-market relationships we want to identify.
(Editor’s note: Investor time horizon is always critical to determining if a change is necessary or immediate action is required. As always, I remind our readers, if you’re a trader, then you likely move in or out of positions based on short term changes in relative strength, while a longer term investor may not see the need.)
Bonds aren’t the only group experiencing rising prices and improvement on a relative basis.
Although evidence remains mixed in the Precious Metals space – prices, momentum, and relative strength (which carries the heaviest weight) continue to point to higher prices for one particular commodity, on both a relative and absolute basis.
The commodity I’m referring to is GOLD.
Here’s Gold priced in US Dollars breaking out above 1,560-1,600 on the weekly chart (highlighted).

If prices are above that range of support, Gold can look for a retest of all-time highs over the coming quarters and years.
We see ongoing demand for Gold in two of the ETFs we track.
The SPDR Gold Trust (GLD), was the first and largest Exchange Traded Fund, investing in gold and backed by the actual metal.
Demand took control of GLD from June to September 2019 (column of X’s). It then reversed down in October 2019 (column of O’s).
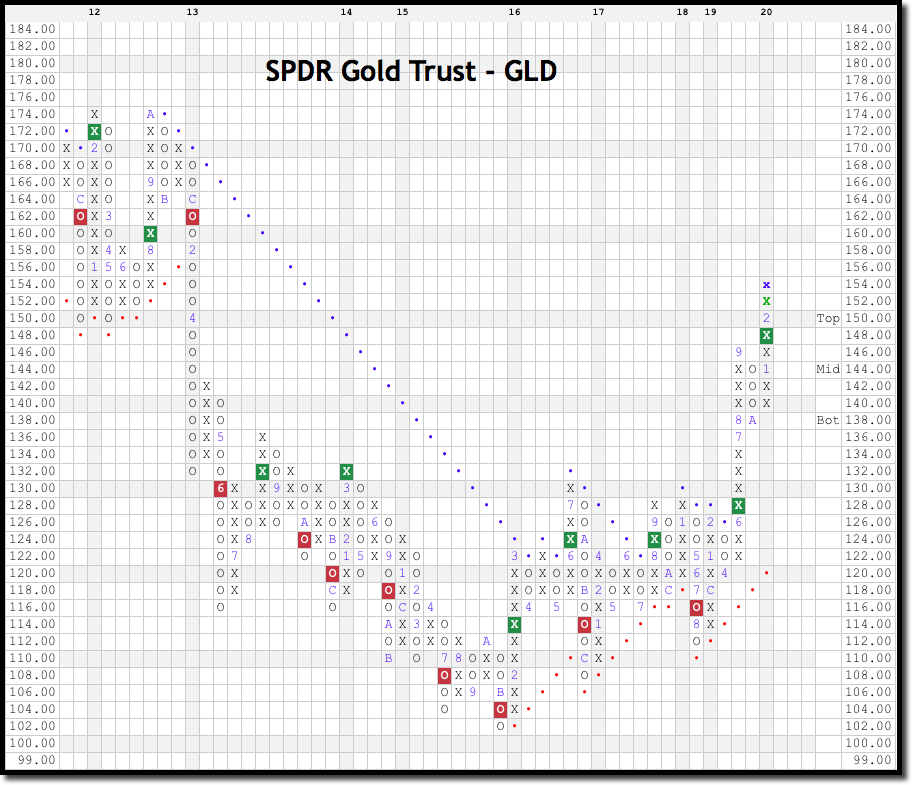
Here we are today and GLD cleared 146 on its chart, while forming a double top breakout at 148 on its Point and Figure chart.
Further evidence of investor demand for Gold vs. stock can be found in the VanEck Vectors Junior Gold Miners ETF (GDXJ).
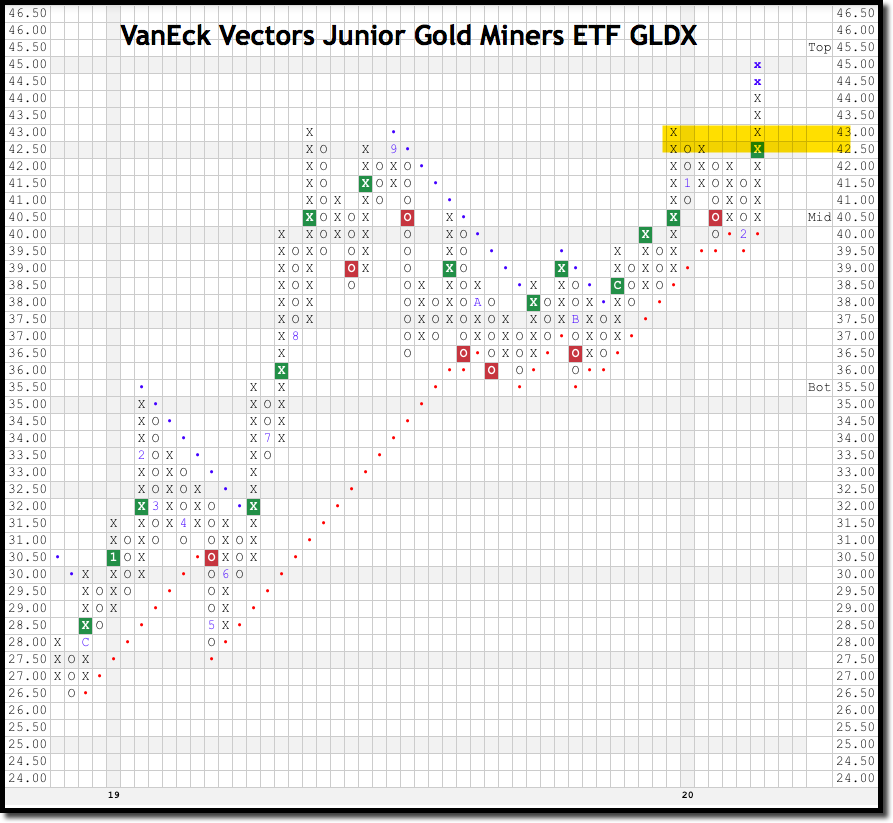
The Juniors have been bumping up against resistance at 42.50-43 before breaking out as demand took control. If money is flowing into Gold and the Gold miners, it’s coming from somewhere – and right now, it looks as though that somewhere is equities.
As long as equities- as an asset class, continue to experience selling pressure and weakening breadth – then the inter-market relationships we track will continue to favor alternatives, including Gold.
A note about relative strength – Relative strength analysis is the foundation of our rules-based money management process – It’s what allows us to remain unemotional and focused in our buying and selling decisions, allowing our algorithms to help navigate the markets.
All our model portfolios are rules based and designed to remain invested in the strongest asset classes and the strongest sectors found within the strongest asset classes, wherever they are found across the globe.
If you’re interested in using relative strength to grow your portfolio, give us a call at 866.711.2836 Ext 3. Investors with portfolios valued at least $500,000 are eligible for a completely free portfolio evaluation that will quickly identify areas of weakness and elevated risk within your current holdings.
As always, invest wisely.
Tags

Get Our FREE Guide
How to Find the Best Advisor for You
Learn how to choose an advisor that has your best interests in mind. You'll also be subscribed to ADAPT, Avalon’s free newsletter with updates on our strongest performing investment models and market insights from a responsible money management perspective.
