
Related Blogs
August 31, 2018 | Michael Reilly
Today, I want to share how one simple strategy has the potential to earn investors four to five times the 2018 returns of the Dow Jones Industrial Average (DJIA).
And the great thing is, once learned, this same strategy can be applied to almost any investment portfolio.
But first, a little context..
Most investors are probably unaware that the Dow Jones Industrial Average (DJIA) has registered its longest stint in correction territory in nearly 60 years.
That’s right, technically, the Dow Jones Industrial Average had been in correction territory for nearly seven months.
Meaning it’s taken the Dow 139 trading days to retrace 10% of its earlier 2018 losses.
That doesn’t mean investors in the index have gained 10% this year – unless you were lucky or brave enough to have invested in the index on March 23, 2018 – at its lowest level of the year.
And seriously, how many investors can say that!
Here’s what it does mean. If, on January 1, 2018, you invested equally in all 30 Dow stocks, you gained 7.68% by January 26th (Hurray!).
Then, only 13 days later (February 8th), you would have given it all back…and then some (Boo!).
And waited 139 days for gains of 5.44% thru August 28, 2018 (Snooze!).
The DJIA still hasn’t matched its record high made way back in January (Boring!).

On the other hand, investors who follow us and understand how to apply a simple relative strength analysis to the 30 Dow stocks are enjoying some serious bragging rights this year.
That’s because, instead of owning all 30 members of the Dow, the savviest investors only own a select few.
You see, applying a relative strength analysis to the 30 Dow stocks would rank each stock against each other – from strongest to weakest.
Investors armed with this knowledge could then own just the strongest stocks, avoiding the rest.
Here’s a list of all 30 Dow stocks and the date they were added to the index. But the list alone isn’t enough to create an investment edge – and we want to give you an edge.

The edge comes from the results of the relative strength analysis.
At its core, RS is designed to track price behavior, and stock prices change based on supply and demand.
It’s the buying and selling of the big institutional money – often referred to as the “smart money” that moves markets, not your average retail investor.
Institutions are moving hundreds of millions of dollars – and where they move matters.
So, track what institutions are buying and selling, and you’ll have a real investment edge.
If institutions are buying, prices rise. If institutions are selling, prices will fall.
Of the 30 Dow stocks, the following are the strongest right now on a relative strength basis:
These are the stocks that are seeing institutional demand.
And these are the stocks that our Dow 30 relative strength analysis have said to own this year.
In no specific order:
- Microsoft +30.57% ,
- United Health +22.63%,
- Visa +96%,
- Nike +32.79%
- Boeing +20.87%
Editor’s note:Apple (AAPL) is one of the newest members of the Dow, joining the index in 2015. On a relative strength basis AAPL is one of the strongest stocks in the Dow, and boasts YTD returns of 31.31%. I intentionally excluded it from the RS matrix, simply to make the point that there are other companies besides Apple (AAPL) that are providing savvy investors market beating returns.
Had you invested equally in these five stocks on January 1st, you could be boasting about returns of nearly 27% (26.96%).
And not only can relative strength analysis point your investment dollars towards potential market beating returns, it’s equally adept at avoiding market laggers.
Meaning, investors can use relative strength analysis as a risk tool as well – keeping investors away from potential losses in lagging stocks or sectors.
For comparison purposes, the bar chart below – available at StockCharts.com , includes both the 5 strongest Dow components on a relative strength basis and the 5 weakest stocks on a relative strength basis.
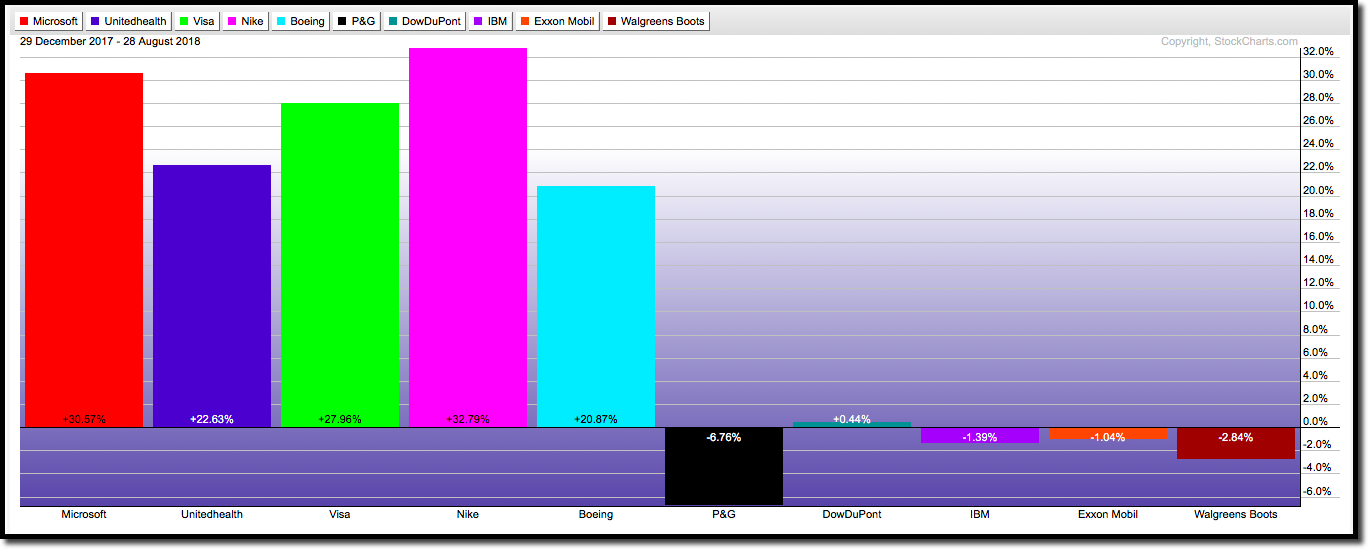
So, five stocks institutions are buying and five stocks institutions have little interest in right now.
The 5 weakest stocks on a relative strength basis are:
- Proctor & Gamble (-6.76%)
- DowDuPont (+0.44%)
- IBM (-1.39%)
- ExxonMobil (-1.04%), and
- WalgreensBoots (-2.84%)
The differential in possible investor performance by owning a top performing Dow stock, Nike +32.79% or owning one of the weakest Dow components, P&G (-6.76%) currently sits at +39.55%. Almost 40% difference in returns and that’s not even a full year!
Although no investment strategy is “perfect”, at its core, relative strength investing is all about keeping you out of weak markets, sectors, and investments, and directing investment dollars toward the strongest…until that trend changes.
If you’d like more information about Relative Strength investing, feel free to schedule a consultation with one of our advisors.
Qualified investors are eligible for a 100% free consultation. We can also quickly analyze your existing portfolio to see if it’s currently balanced to take advantage of relative strength trends, or…if you’re holding positions with low relative strength, which could indicate future problems.
Click here now to see available appointment times.

Get Our FREE Guide
How to Find the Best Advisor for You
Learn how to choose an advisor that has your best interests in mind. You'll also be subscribed to ADAPT, Avalon’s free newsletter with updates on our strongest performing investment models and market insights from a responsible money management perspective.
