
Related Blogs
March 22, 2022 | Avalon Team
 Technical analysis is all about seeing what IS happening in the market, not what MIGHT happen in the market.
I’ve never met anyone who made money based on what might be… just what is.
That’s a big reason why we focus our efforts on technical analysis. I’d rather find something that’s working. Why complicate it?
And let’s not forget why technical analysis works.
Because we know, for a fact, that markets trend. So let’s check out some trends…
What’s trending now? Well, pretty much the same kind of securities that have been trending for quite a while now.
Don’t roll your eyes at me… Read on please, I promise you won’t be disappointed.
I know you’d rather hear all about the S&P or Tech stocks breaking out… I get it.
And yeah, sure, last week’s moves in the S&P 500 and the NASDAQ are eye-popping, to say the least, and I’m not suggesting they should be discounted.
But are they the kind of trends we want to buy?
It depends on your time frame… and because the intermediate-term time frame is more in our wheelhouse, we’ll stick to that perspective.
The intermediate perspective continues to point to Value over Growth.
You can fight that if you want… it’s your money, but Value over Growth continues.
Here, we can see the relationship between Small-Cap Value stocks and Small-Cap Growth stocks to the Russell 2000 index – using IWM as a market proxy.
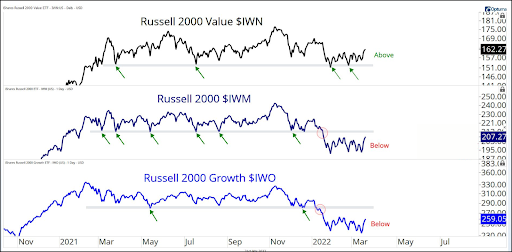
The Russell 2000 index (IWN) was unable to hold above key levels of support in early 2022, showing it to be vulnerable and weak. Today the index remains below those previous areas of support.
The Growth stocks of the Russell (IWO) moved pretty much in lock-step with the index.
And remember the concept of polarity – support becomes resistance and vice-versa.
So I wouldn’t expect the index or Growth to suddenly break through without some kind of resistance. Not that it can’t happen, but typically we see a test of resistance before a move higher.
But Small-Cap Value stocks (IWN) have done something the Russell 200 index and Russell Growth stocks were unable to do – they held above those previous levels of support indicating strength in Value stocks.
So, why fight it? Makes sense to me to find investment ideas in the areas that are trending higher, not lower.
As I got to thinking about value areas, I was thinking about what we’ve discussed recently… and some areas we haven’t talked about lately.
We’ve hit on Energy stocks and Oil. And dedicated commentary to Commodities – a lot.
So, let’s change it up a bit today and zero in one sector that’s been overlooked by many investors, but that may prove to be a costly mistake…
Industrials. Exciting, right?!
Industrials are the most diverse sector of the S&P and have the highest correlation to the overall market – likely because they are so broad in holdings.
The Industrial sector has a little bit of everything. You can find everything from airlines, building products, machinery, professional services, and aerospace and defense contractors all in this one sector.
Let’s check out the price chart of Industrials using the sector ETF XLI.
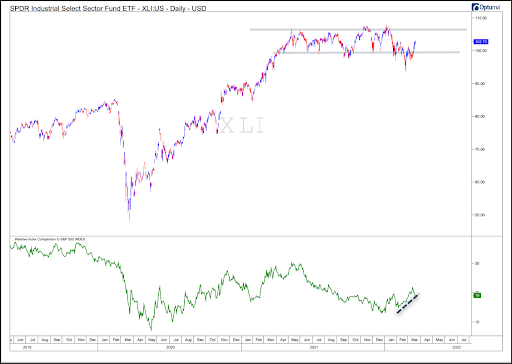
What stands out at first on the price chart is how XLI has done nothing for over a year, trading within a pretty tight range.
To be fair, industrials weren’t alone as they consolidated…
But what’s interesting is what you see in the lower pane, which is Industrials versus the S&P on a relative basis. The rising line indicates Industrials have been showing Relative Strength versus the broader market.
We can also see this Relative Strength in the form of absolute performance in the chart below. Industrials are down -2.5% year-to-date, while the S&P 500 is down twice that at -5.14%.
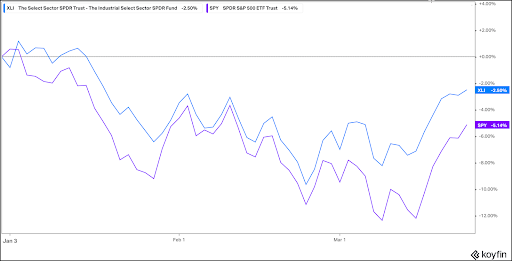
Down is down, even if it’s by less… but that’s the nature of Relative Strength relationships: Up by more or down by less.
But don’t let the negative returns of the sector dissuade you.
Remember I said earlier that the Industrial sector is the most widely diversified sector of the S&P?
So it stands to reason if Industrials are showing relative strength versus the broader market, there must be some stocks carrying the weight.
Here, we’re plotting year-to-date performance on the vertical axis and the percentage that the stock represents of XLI plotted on the horizontal axis.
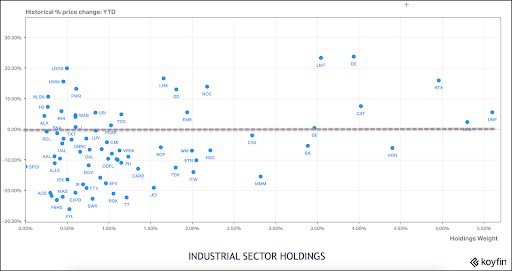
Holdings are widely spread between performance and holding percentage, but we want to focus our attention on holdings north of zero.
I’ve pulled together some of the positive performers from the Industrial sector below, while also putting in context the performance of the S&P 500 and the Industrial sector.
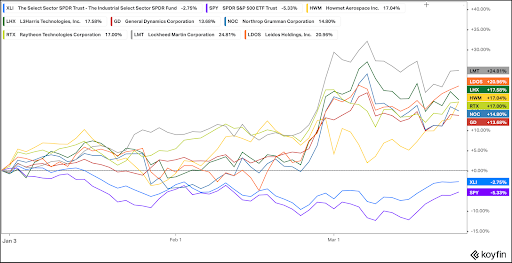
Take a look at some of the returns offered up in a sector that is still showing negative year-to-date returns, but positive strength versus the broader market.
- Lockheed Martin +24.81%
- Raytheon +17.00%
- Northrop Grumman +14.80%
- Leidos Holdings +21.00%
Have a process to determine what’s working in the market and work down from there, just like we did here today.
We confirmed Value over Growth. We looked at a value sector showing relative strength versus the market – Industrials. We dug deeper into holdings and found potential investment ideas.
And remember, just as markets trend, so do sectors and stocks, so don’t make the mistake of assuming you’ve missed the ride in the holdings above.
The biggest lie on Wall Street is to buy low and sell high. It’s much better to buy high and sell higher!
If you have any questions or have been considering hiring an advisor, then schedule a free consultation with one of our advisors today. There’s no risk or obligation—let's just talk.
Tags

Free Guide: How to Find the Best Advisor for You
Get our absolutely free guide that covers different types of advisory services you'll encounter, differences between RIAs and broker-dealers, questions you’ll want to ask when interviewing advisors, and data any good financial advisor should know about you and your portfolio.
