
Related Blogs
September 11, 2019 | Michael Reilly
A very reliable technical indicator says yes.

Monday marked an important day for the stock market. That’s because, with Mondays market movement, the Bullish Percent for the NYSE, A.K.A. the NYSE-BPI, reversed back up into a column of Xs.
This means more and more stocks that trade on the New York Stock Exchange have been moving higher. In fact, so many stocks have reversed higher on their respective price charts that it’s caused one of our most important and reliable market indicators to reverse higher – signaling that demand is once again in control of the market.
We use the NYSE-BPI as our primary participation indicator, measuring the percentage of securities in the NYSE that are on a point & figure buy signal.
As investors we want the wind at our backs. We want to buy stocks in an uptrend, those breaking above previous resistance levels – while taking a more cautious stance when stocks break below previous support levels.
And to help identify those important shifts between supply and demand/support and resistance we turn to the NYSE BPI – as its columns of Xs and Os mark areas of change in control between supply and demand.
Entering January 2019, after last years 4th quarter rout, the NYSE reversed higher as strong demand for stocks sent the NYSE-BPI rising from a low of 16% all the way up to 58% in April (#1 on chart below).
In May, amid heightened volatility and fear, the NYSE-BPI reversed lower once again (#2) indicating supply had seized control of the market. August saw further declines in the BPI, as selling dropped the BPI to 38% (#3 on NYSE BPI chart).
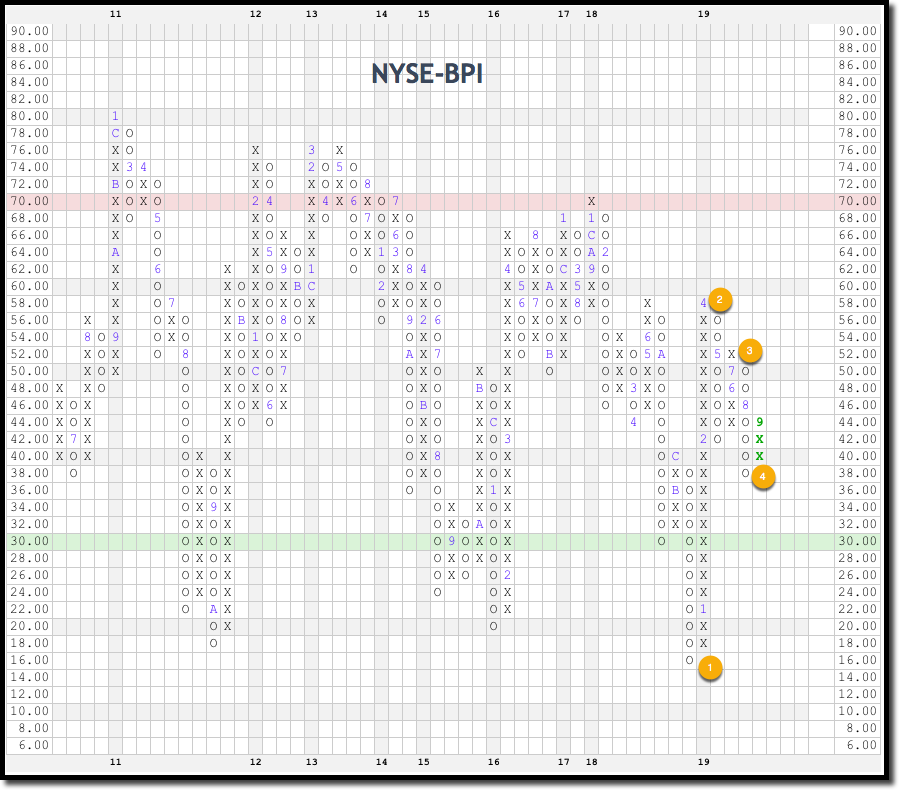
(Chart courtesy of Nasdaq Dorsey Wright)
And that’s where it remained, with supply in control – until now.
Monday’s positive reversal puts the chart in a column of Xs (#4), meaning that we are back on “offense” and focused on those areas of the market exhibiting high relative strength – more about this later.
We’re not surprised by this reversal – to the contrary, we’ve been anticipating it.
That’s because two other short-to-intermediate term indicators we track regularly, the %10-week and the %30-week of the NYSE, have both previously reversed up and into a column of Xs as demand began to reassert itself.
That foreshadowed what we see today in the BPI of the NYSE… the confirmation we’ve been waiting for.
The NYSE-BPI follows the direction of these two technical indicators, as the same forces of supply and demand that cause them to shift between Xs’ and Os (supply or demand) are the same forces that trigger a status change in the NYSE-BPI.
The arrival of demand is welcome news to a market that has been churning sideways to down since May, as traders evaluated everything from Fed policy and inverted yield curves to the impact of trade tariffs.
I was asked last week if I thought the ongoing trade tensions between the United States and China would result in a recession here in the United States.
My answer – maybe… just not today.
Our focus and energy must remain on what is happening – not on what might happen.
Investment success comes when we invest based on what is happening now and adapt to market changes as they emerge.
And right now, we have the New York Stock Exchange showing demand in control with rising stock prices.
We also have three key market indices – the S&P 500 index, the DJIA, and the Nasdaq 100, all breaking higher after holding right around both their 2018 and 2019 highs.
That’s a lot of collective strength pointing towards a market that looks to move higher and adding to the probability of success.
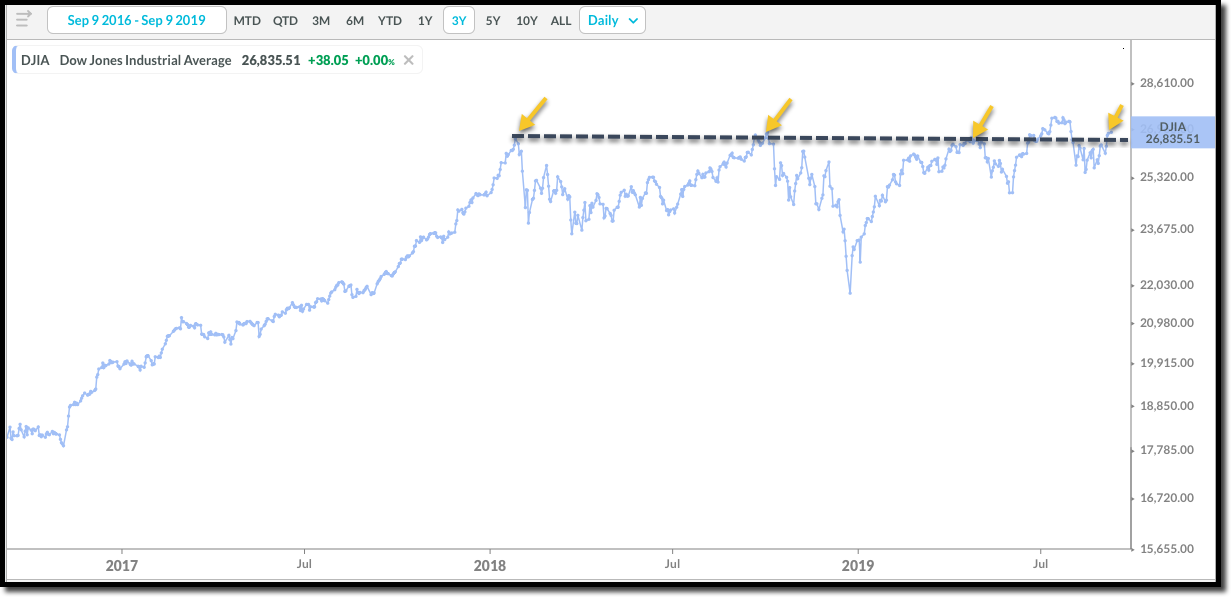
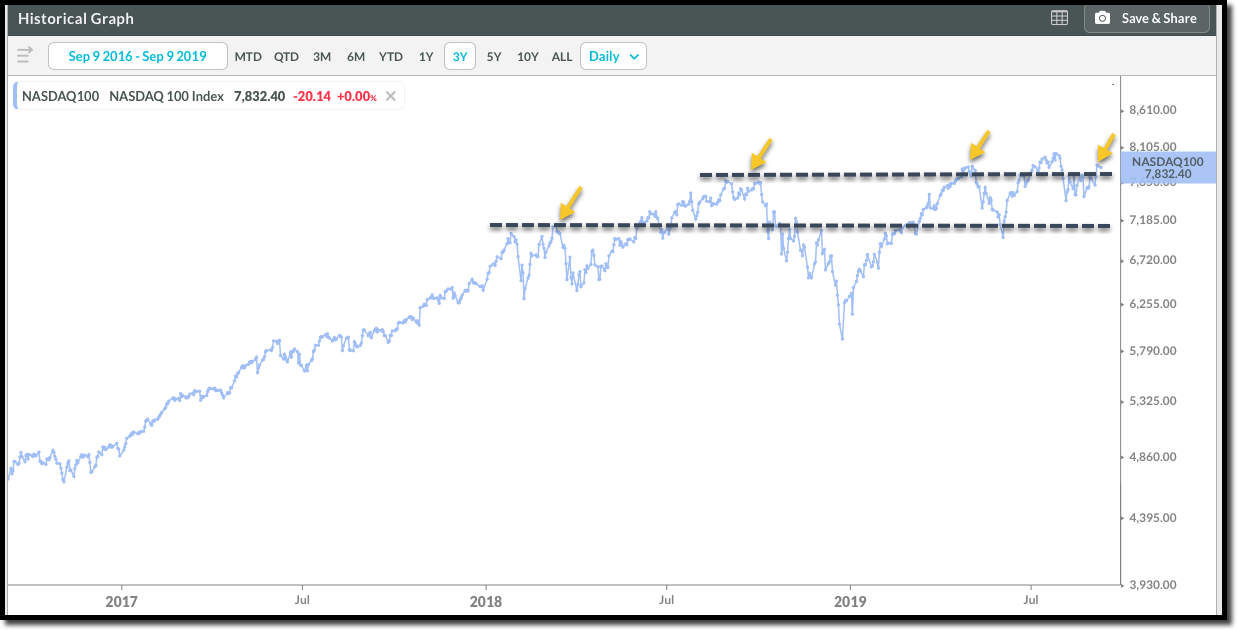
The charts are below – I’ve highlighted areas on each chart where the market hit or matched previous highs dating back to early 2018.
For example, the S&P 500 hit or matched its high four times and now looks as though it’s setting to break out.
The S&P 500 Index:

The DJIA:
It’s a similar picture here in the DOW – as the index is hitting right up against previous highs. The question is, will demand be strong enough to punch through to new highs?
The Nasdaq 100:
The third index, the Nasdaq 100, is pushing its way higher as well.
Now, I’m not suggesting the coast is clear, that it’ll all be smooth sailing from here and volatility is behind us – but there is a lot of momentum building at these levels and investors should take note.
We always stress to put the probabilities of success in our favor. That’s why we spend so much time tracking price behavior of markets and individual stocks that trade on them.
It’s the best way we know to get in the minds of the traders that are responsible for the biggest market moves. If we can see what they’re thinking – and the moves they’re making, well, that’s an edge that can lead to bigger profits.
It’s often said that technical analysis is more of an art than a science. And that there is no way to know for sure if our interpretation of price charts is correct until after the fact.
Based on the chart of the NYSE BPI, the price charts of the S&P 500, the DOW, and the Nasdaq 100, it appears the path of least resistance is higher.
So lets drill down and look to sector strength here in the U.S.
As most of you are aware, we isolate the strongest sectors of any market, as these leadership groups tend to outperform the broader market over the long-term.
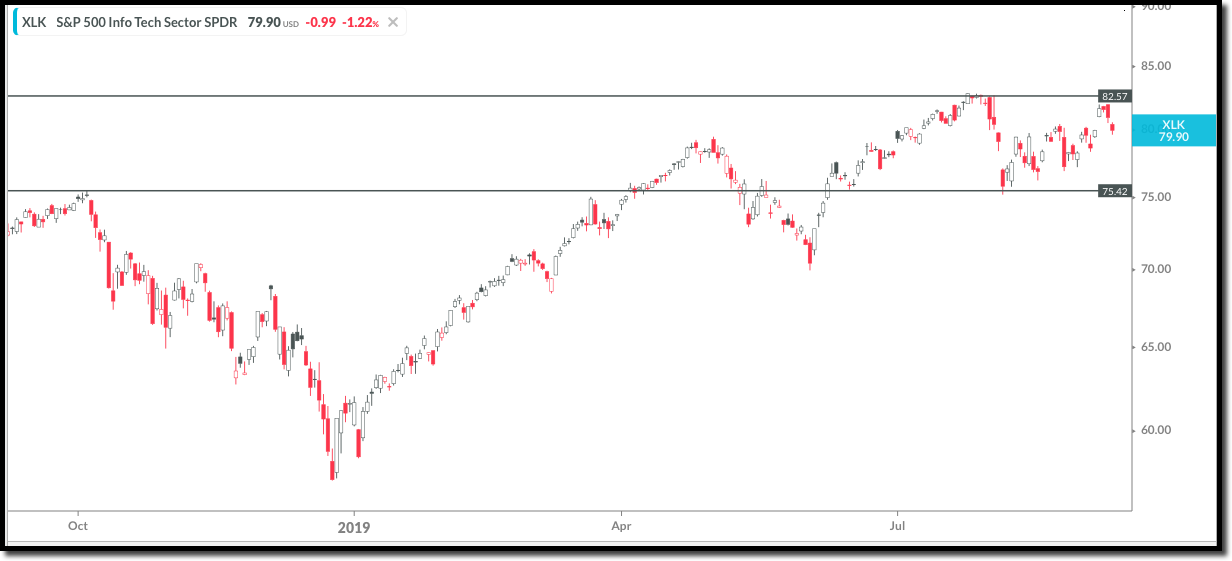
Currently, Technology, Utilities, Industrials, and Communications Services are the 4 strongest broad sectors of the 11 U.S. sectors we track regularly.
I’m including both a price chart and the trend chart below.
 (Chart courtesy of Nasdaq Dorsey Wright)
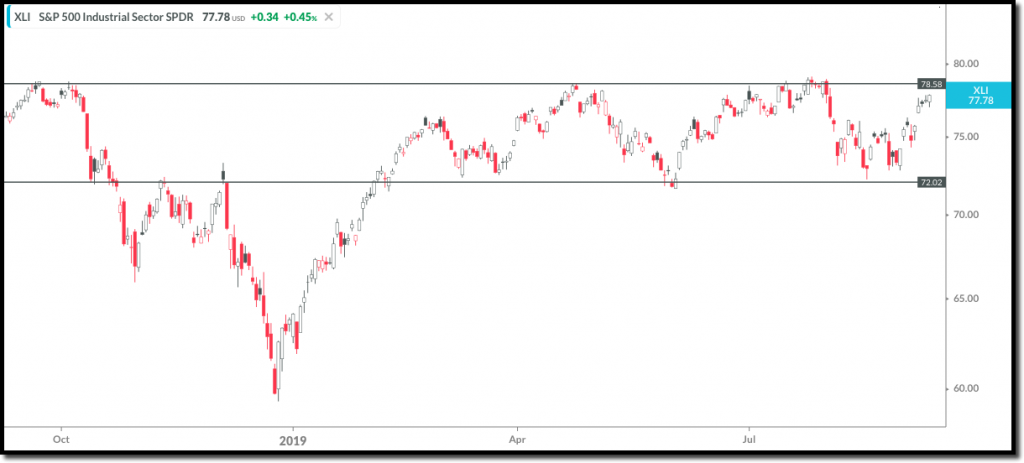
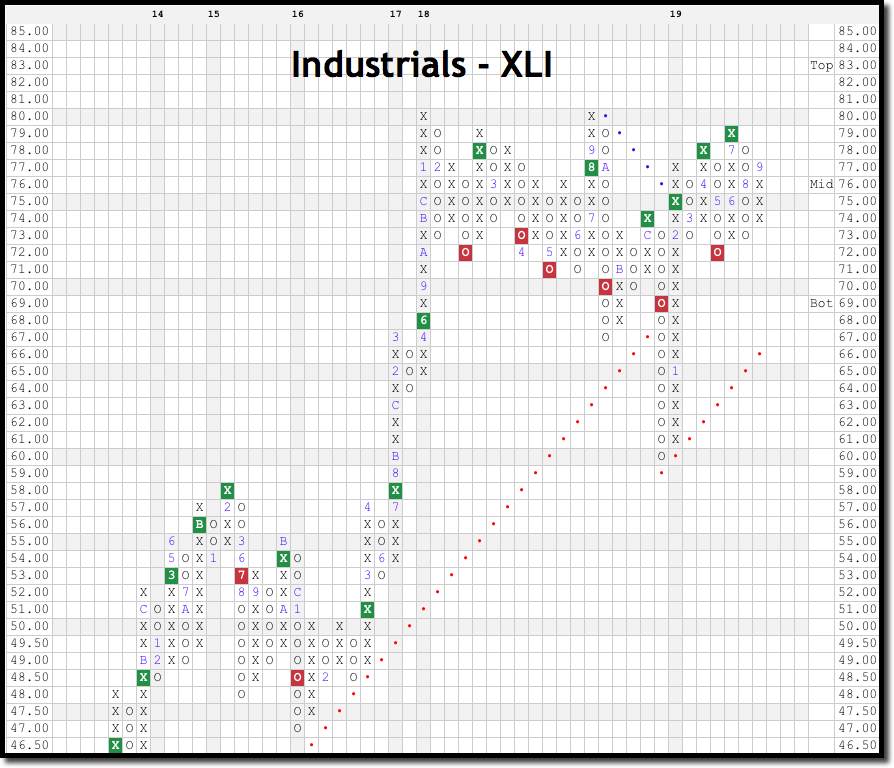
Industrials:
 (Chart courtesy of Nasdaq Dorsey Wright)

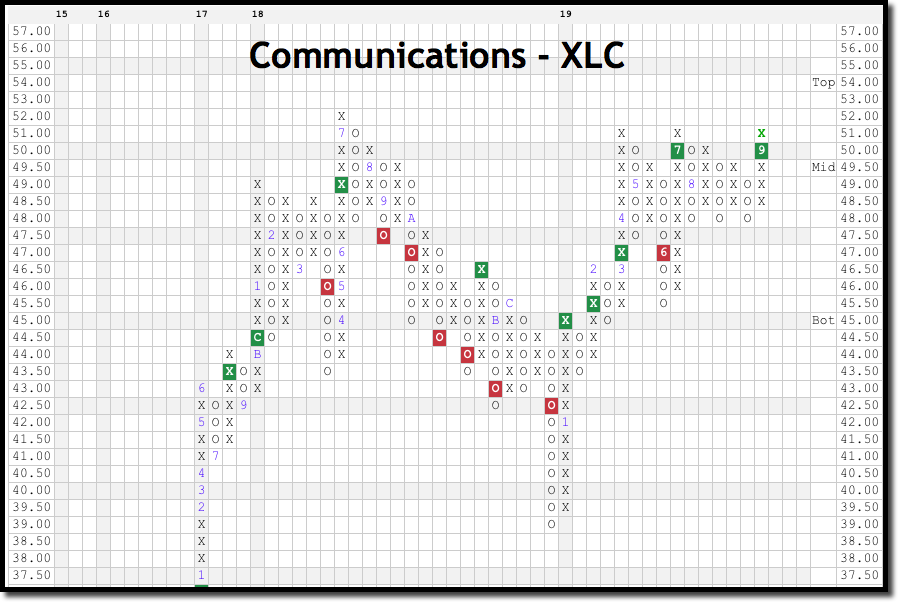
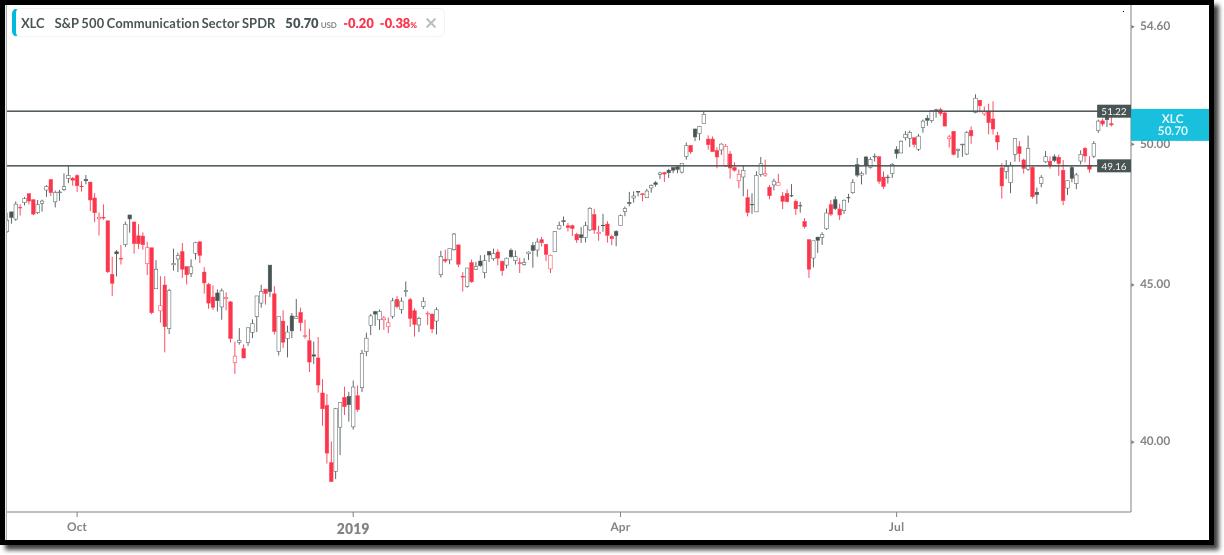
Communiciations:

 (Chart courtesy of Nasdaq Dorsey Wright)
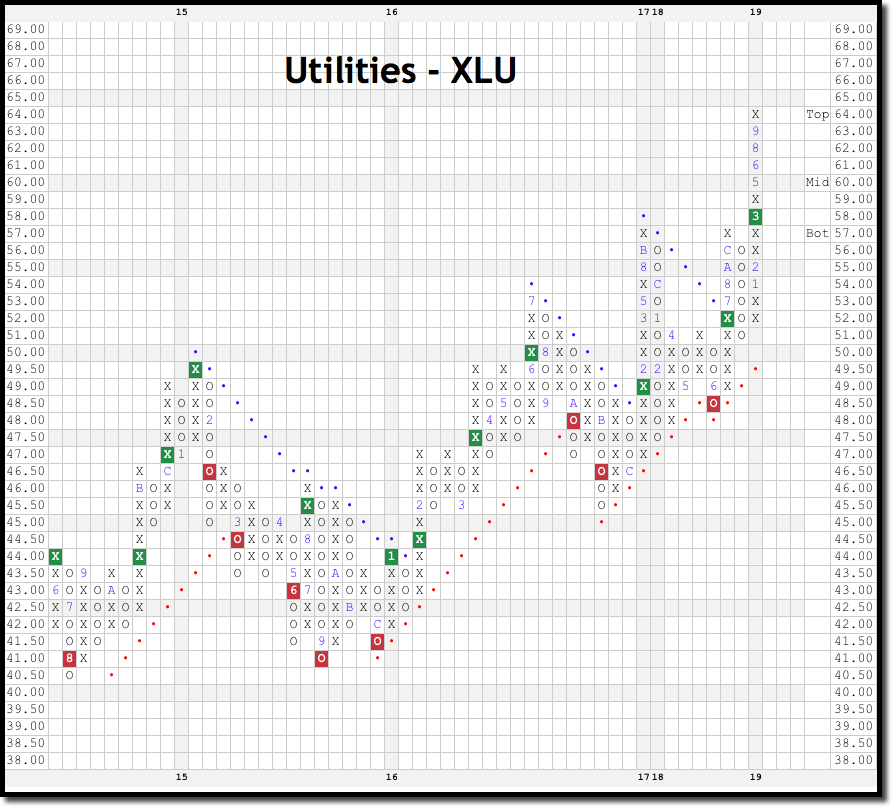
Utilities:
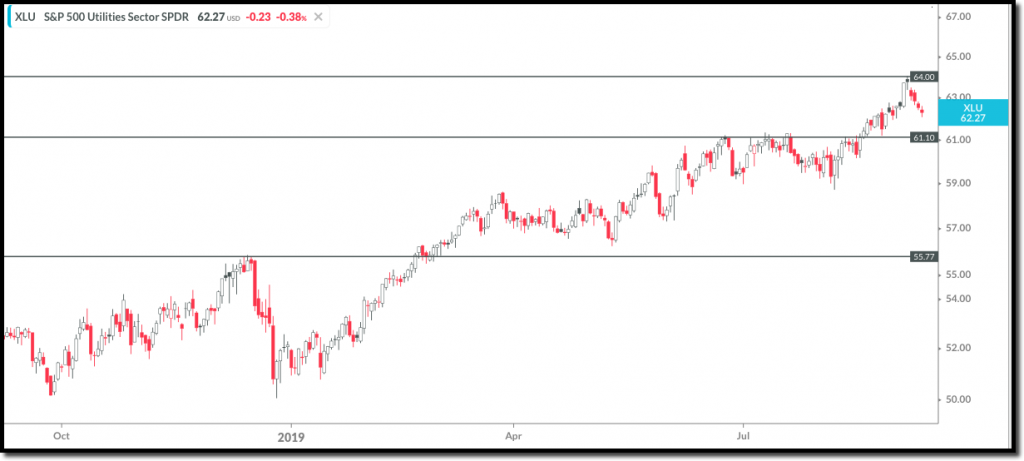
 (Chart courtesy of Nasdaq Dorsey Wright)

The charts of all four sectors share something in common – they are in a column of Xs indicating demand is in control. Also, all four have remained close to historic highs on their respective price charts.
So, here’s what we have in front of us today. We have three major indices battling to clear overhead resistance in order to breakout to new highs. Our major participation indicator – the NYSE BPI, just signaled the demand has taken back control of the market. And as the saying goes “leaders lead” and that’s what we are seeing from our four strongest relative strength sectors.
As an investor, if you regularly re balance your portfolio to contain securities from the top scoring sectors you stand a much better chance of outperforming the general market. In fact, that’s exactly how we construct some of our models for clients of Rowe Wealth Management.
If you’re an investor with a portfolio valued at least $500,000 you may be interested in our completely free portfolio evaluation and stress test. Using our state of the art software we can quickly analyze any portfolio to identify areas of strength and weakness, and correct them if need be.
Click here now to see available appointment times.
As always, invest wisely.


Get Our FREE Guide
How to Find the Best Advisor for You
Learn how to choose an advisor that has your best interests in mind. You'll also be subscribed to ADAPT, Avalon’s free newsletter with updates on our strongest performing investment models and market insights from a responsible money management perspective.
