
Related Blogs
January 31, 2023 | Avalon Team
On this last day of January, U.S. stocks are up around 5% month-to-date ahead of the Federal Reserve’s decision on interest rates Wednesday.
This has been the strongest start since 2019 and the 16th best in the last 95 years…
Does a strong start lead to a good year for U.S. stocks?
Here are a few insights.
There is a term for this idea (strong January returns leading to strong annual returns) called “January Barometer.”
This concept stemmed from a 1967 book called Stock Trader’s Almanac by Yale Hirsch and continues to be present in a number of people’s trading strategies.
The idea was if the month of January delivers positive MOMENTUM, the data “supported” that the remainder of the year will probably rise as well.
Looking at the data from the past 95 years, the results look a bit inconclusive…
Although it is correct 68% of the time (65 out of 95 years), the results differ greatly in years where January is “down” versus “up” in return.
January up months lead to positive returning years 83% of the time (48 out of 58 years).
January down months lead to negative returning years 51% of the time (19 out of 37 years), which is no different from a coin toss.
So although the positive returning Januarys seem to support this idea, we should be aware that U.S. stocks are up generally speaking 66% of the time (63 out of 95 years)…
Historical data is great at providing CONTEXT, but we should not view it as predictive.
Even more impressive than the U.S. stock market’s recent performance has been the performance of international stocks and bonds of both developed and emerging market countries.
More than $1.1 billion has POURED into emerging market stocks and bonds EVERY DAY since the start of 2023.
And global high-grade bond markets are on track for the BEST JANUARY EVER.
Why the sudden interest in bonds?
Follow the Money
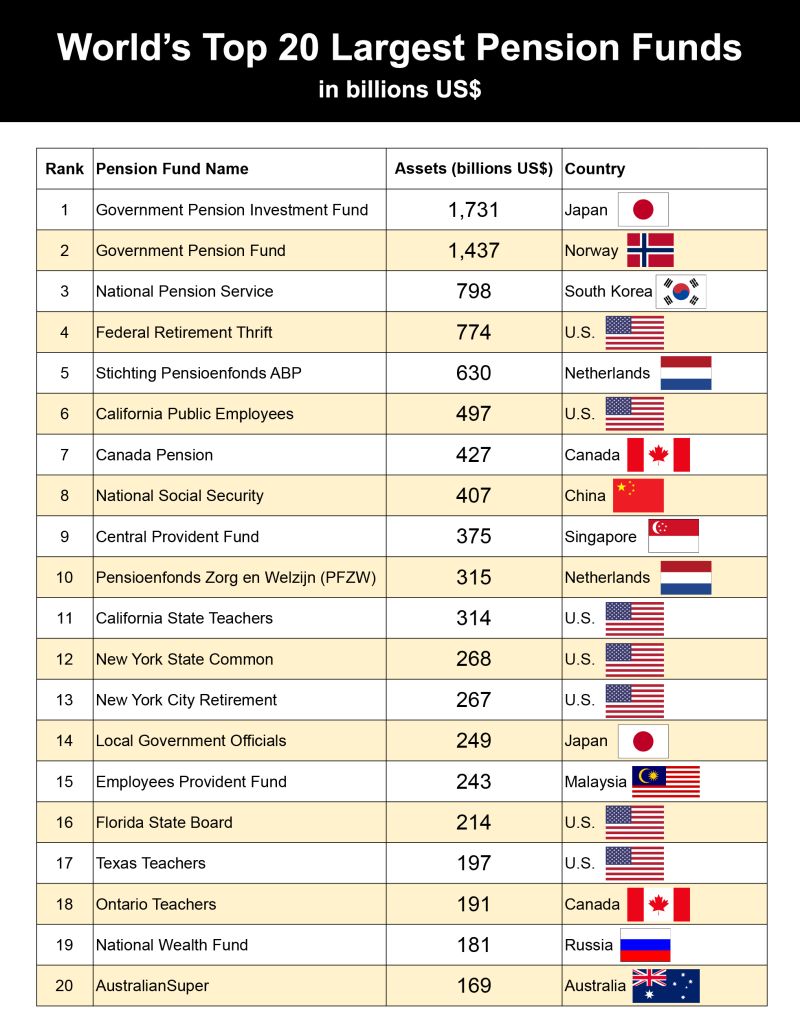
The answer lies within pension funds. The top 300 pension funds globally control $23.6 trillion.
In recent weeks, pensions have been derisking by buying more bonds.
Derisking for pension funds means allocating more to bonds and less to stocks and lowering their investment risk as a result.
In the past decade, with interest rates being so low (so returns for bonds were muted), pension funds had to chase returns by allocating more to stocks.
Not anymore.
With interest rates at their highest level since 2008/2009, pension funds can meet their “conservative” investment return of about 6% by investing in more bonds than stocks.
That is likely a reason why we’ve seen bond markets RALLY so hard in the first three weeks of 2023.
Although US stocks are up +6% so far in January, bond returns are looking really strong with high-yield bonds +4.2%, investment grade bonds +4.1%, and even government bonds +3.5%.
Fund flows in January into stocks ($5 billion) vs bonds ($13 billion) were the most LOPSIDED we’ve seen since last July.
Understanding Emerging Market Debt
Over the past three years, emerging markets (EM) stocks have been overlooked by Global investors who instead have preferred large-cap US and DM Europe. Emerging market underweights have now reached levels.
This means that there could be a lot more money to be allocated to these markets should investors decide to weight their allocations closer to more historical levels.
What makes emerging market debt attractive is that emerging markets have historically and continue to pay high real rates.
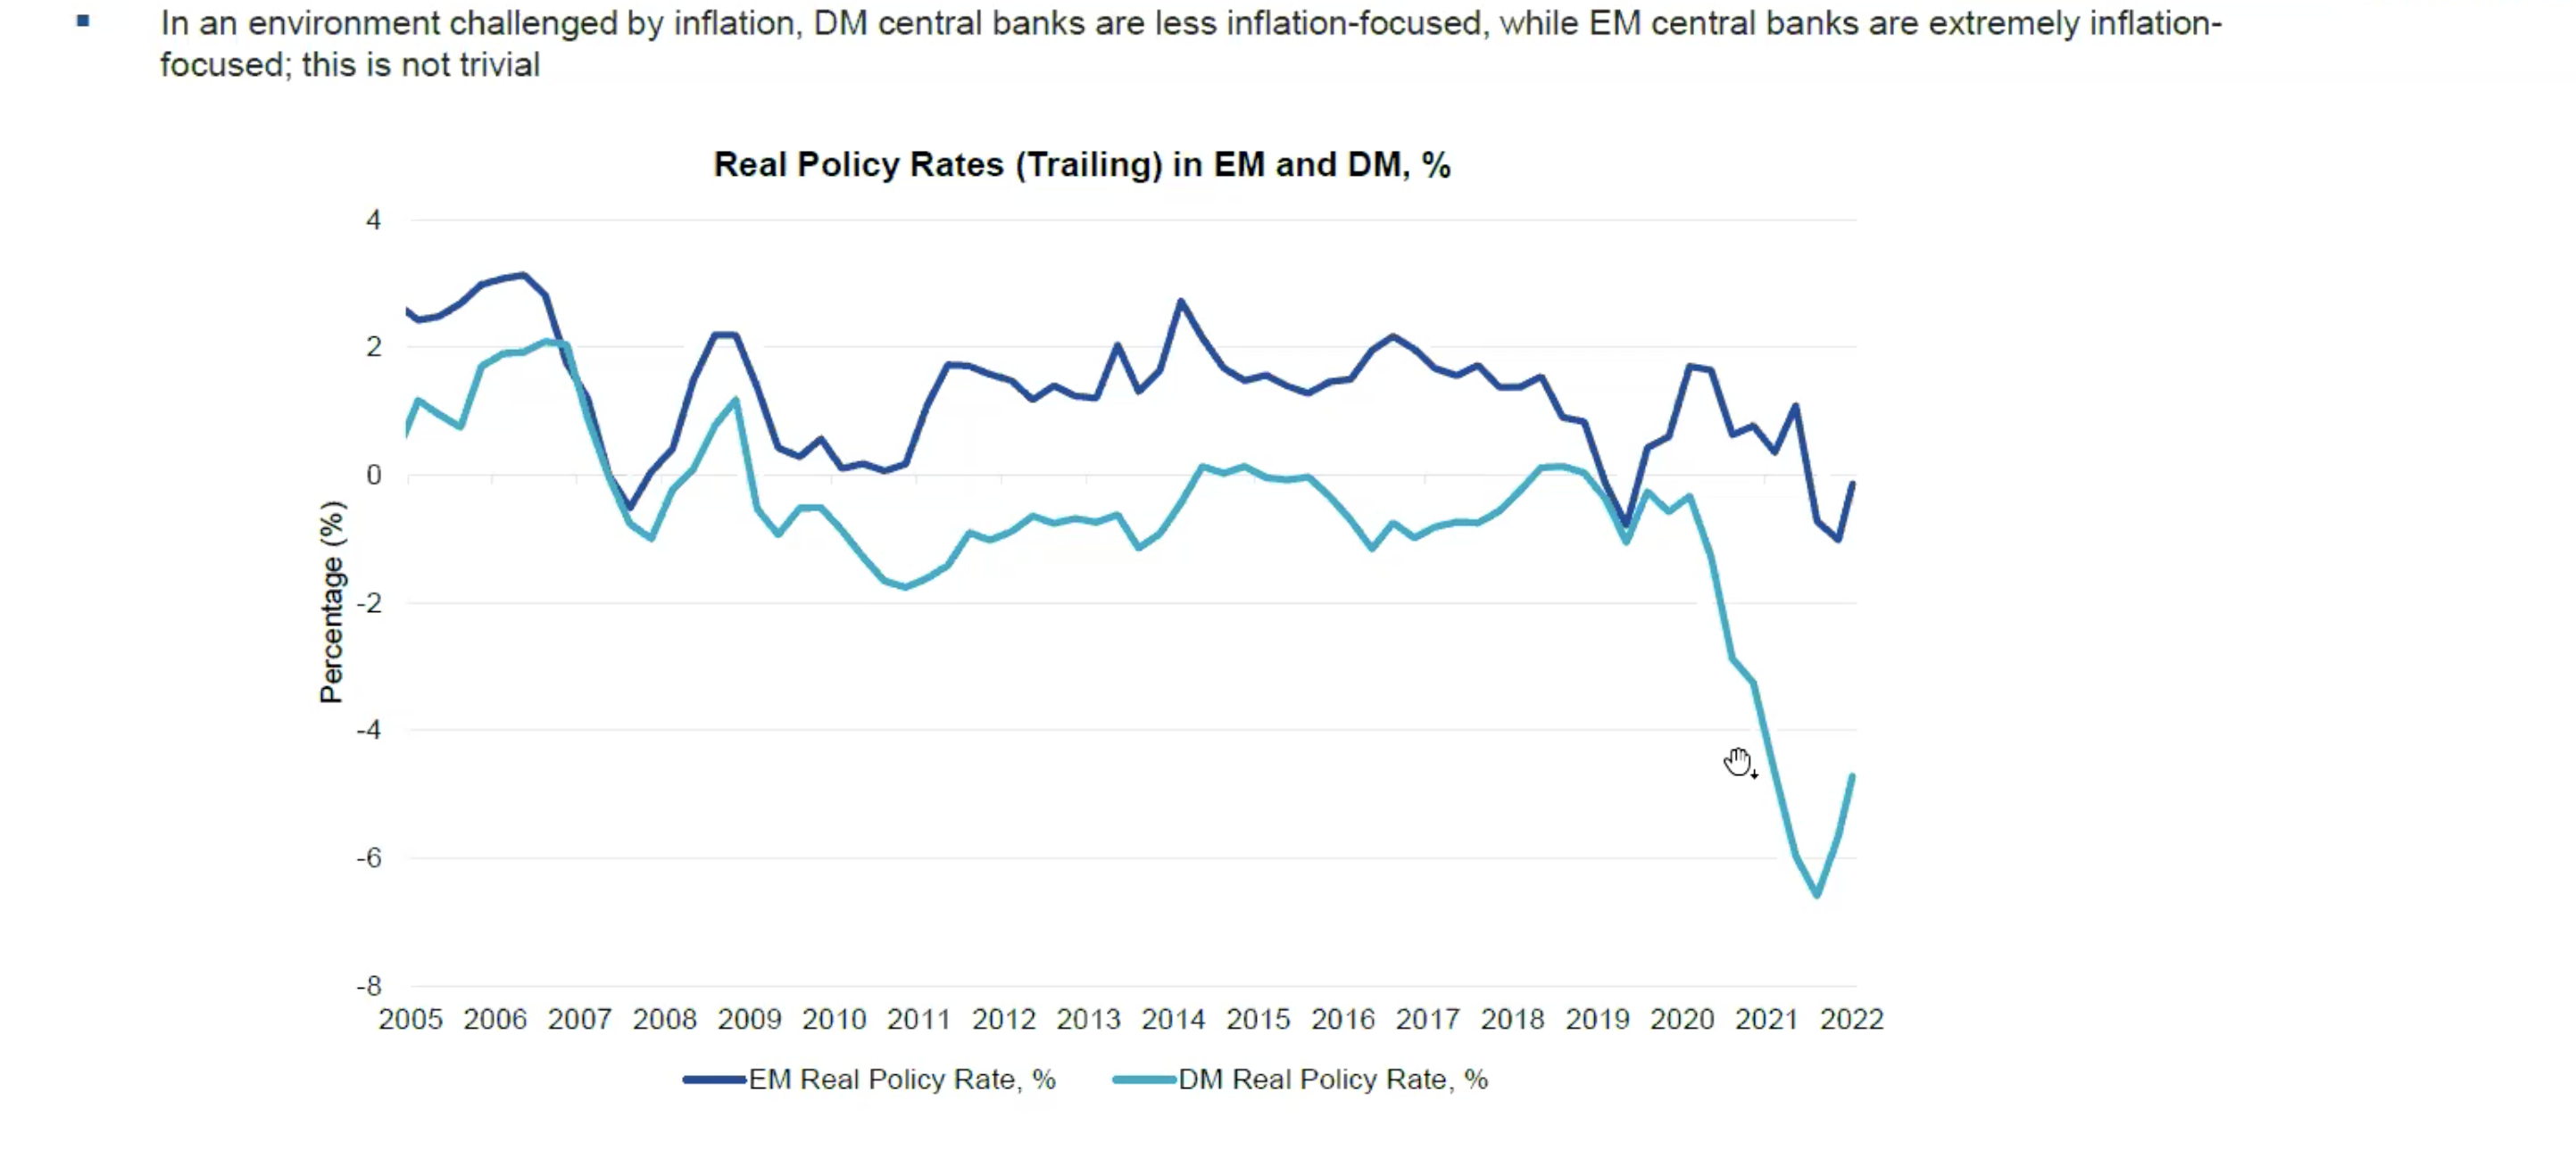
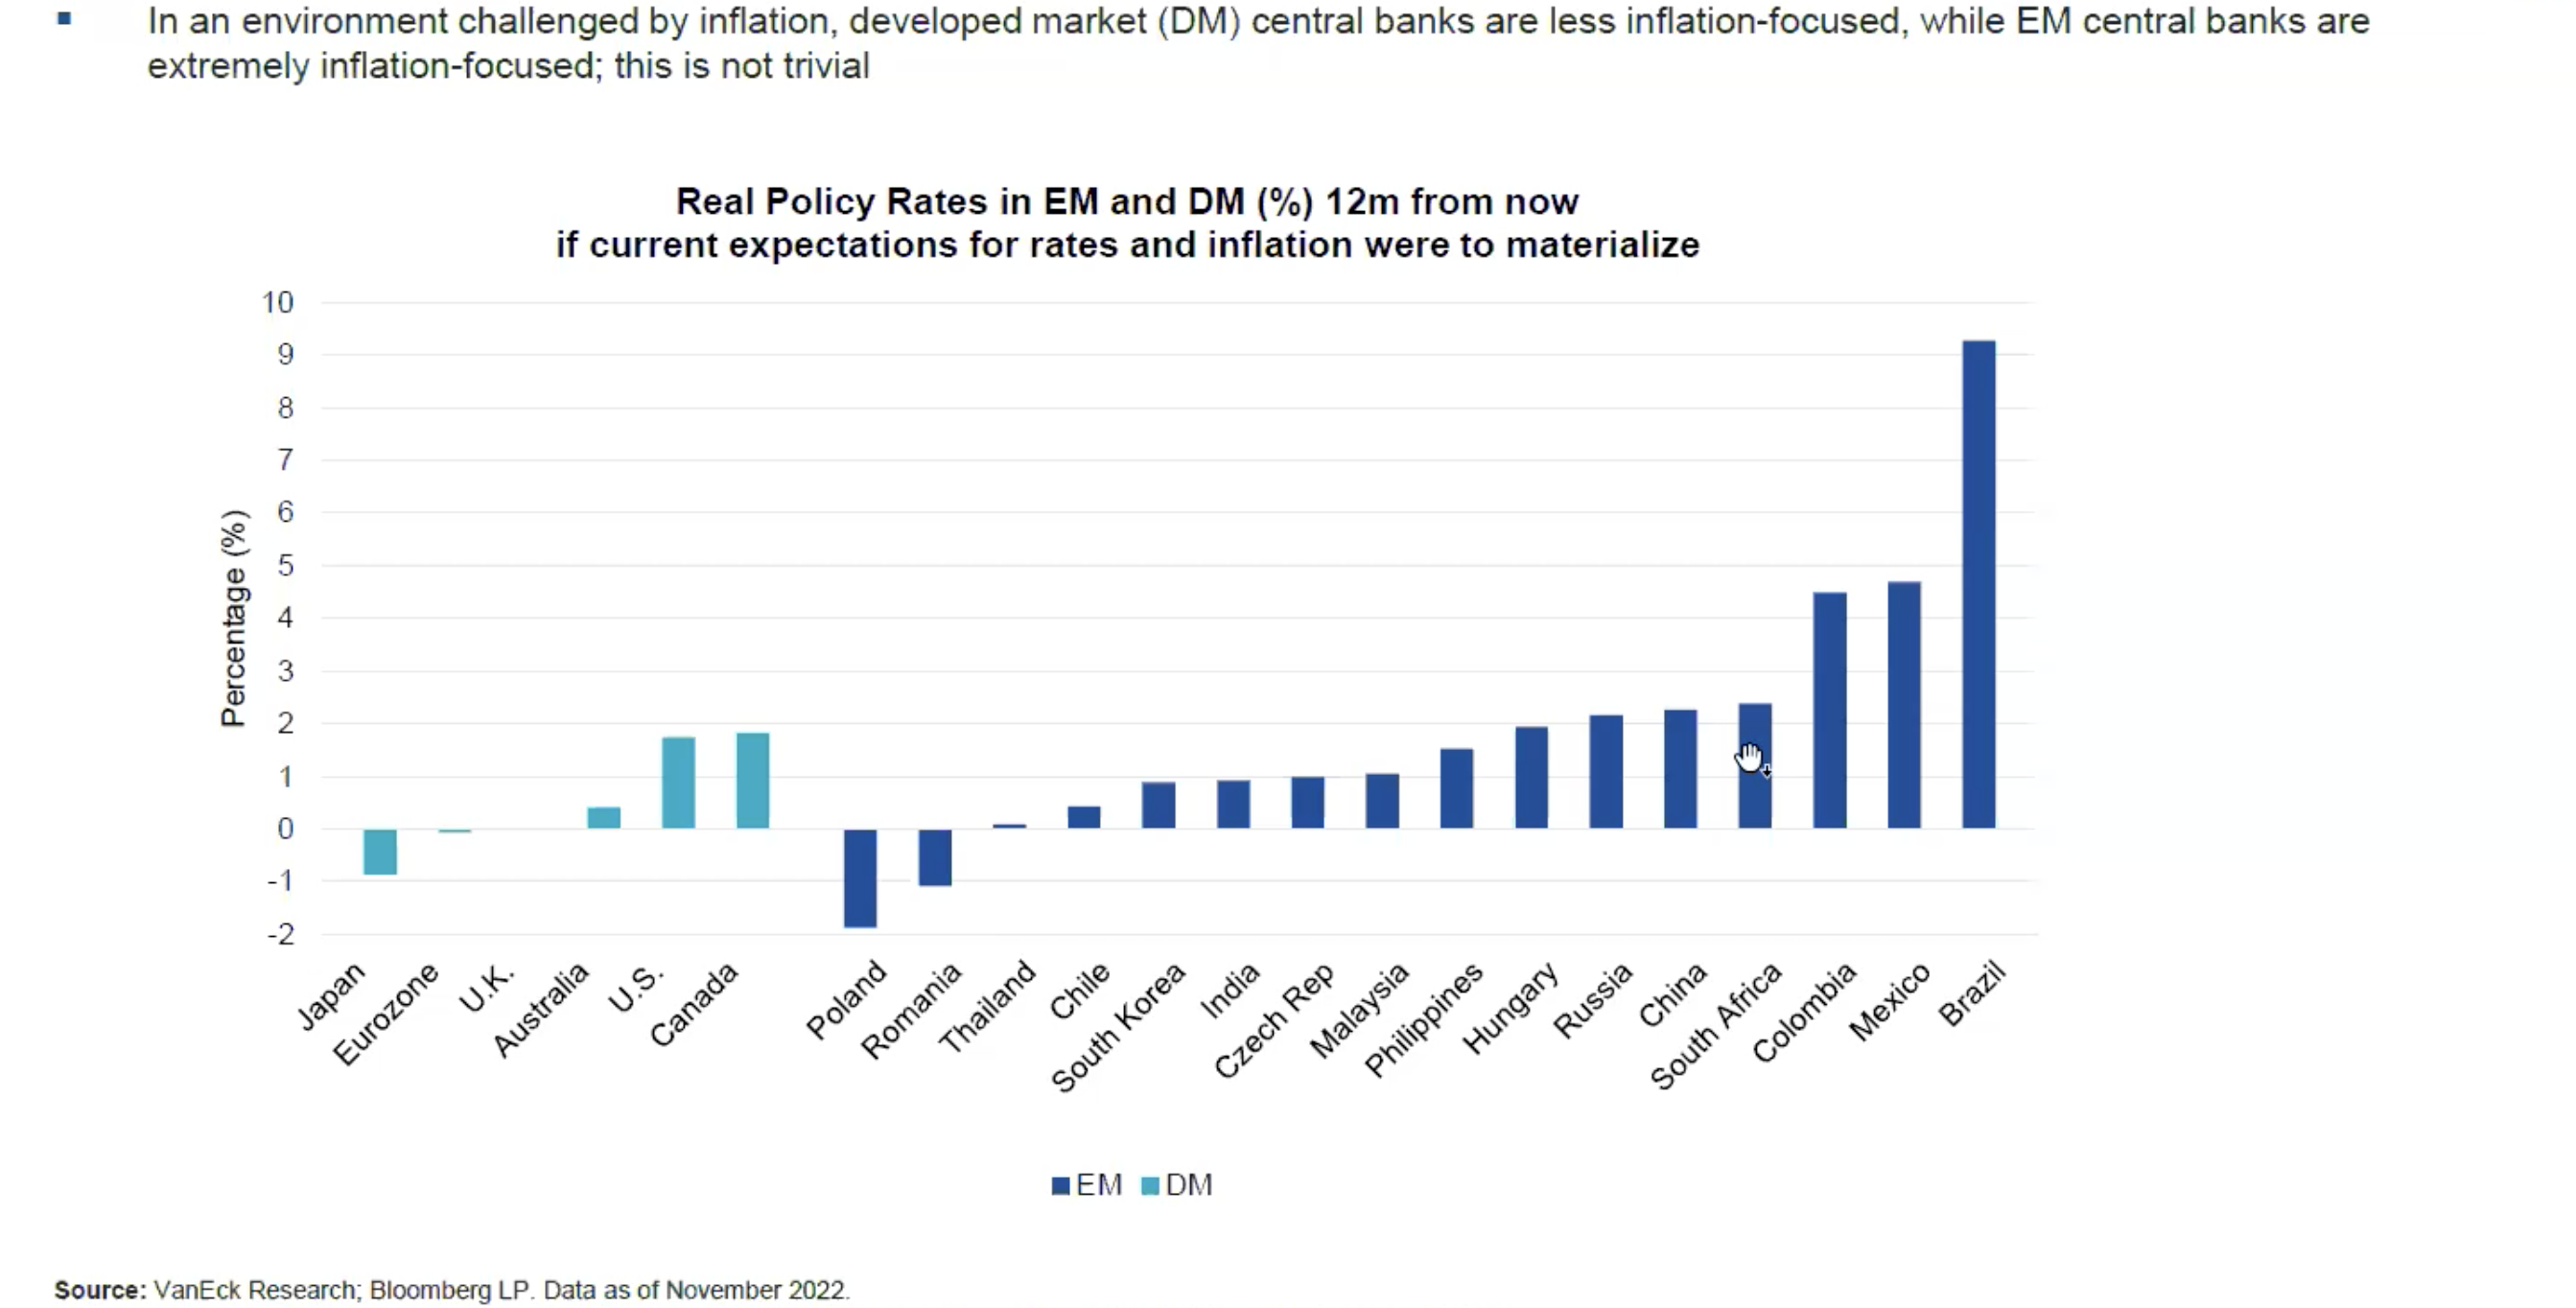
It’s important to remember that emerging market countries have their own banks and thus create their own policies. The banks have had to learn to fight inflation as a matter of survival.
Collectively, the banks of emerging countries have been much quicker to react to inflation by increasing rates. Thus, nominal rates (real rates + inflation) are very high when compared to the interest rates of developed countries, as the following chart shows.
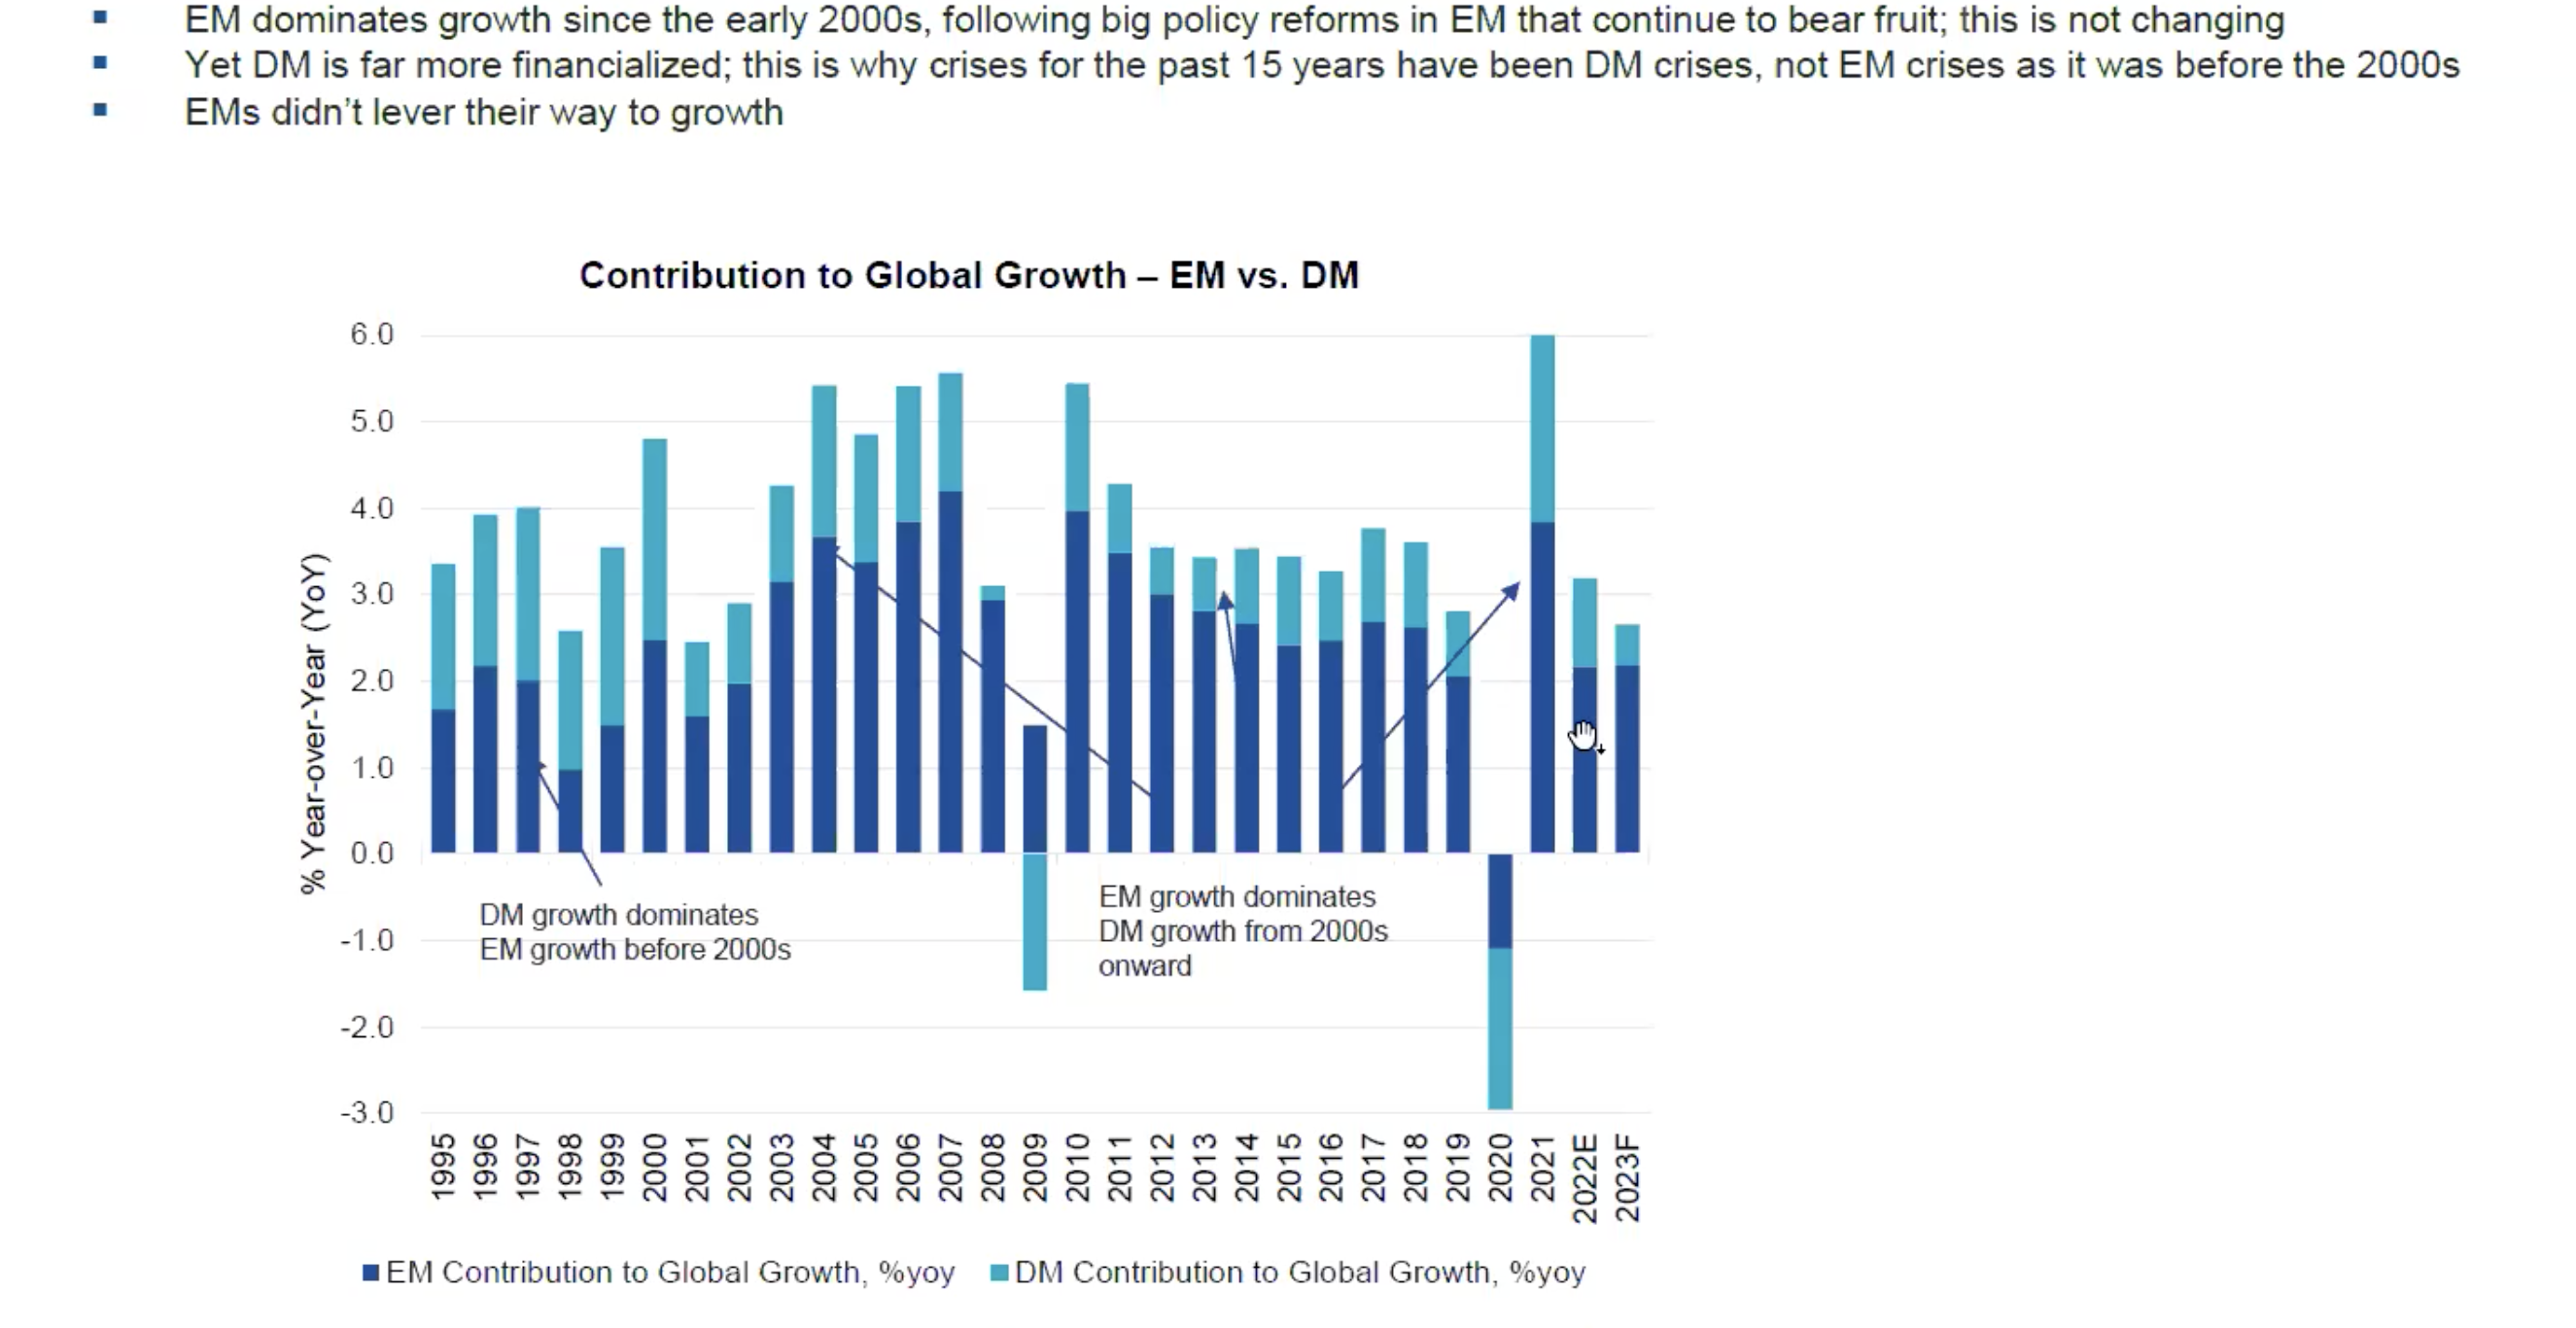
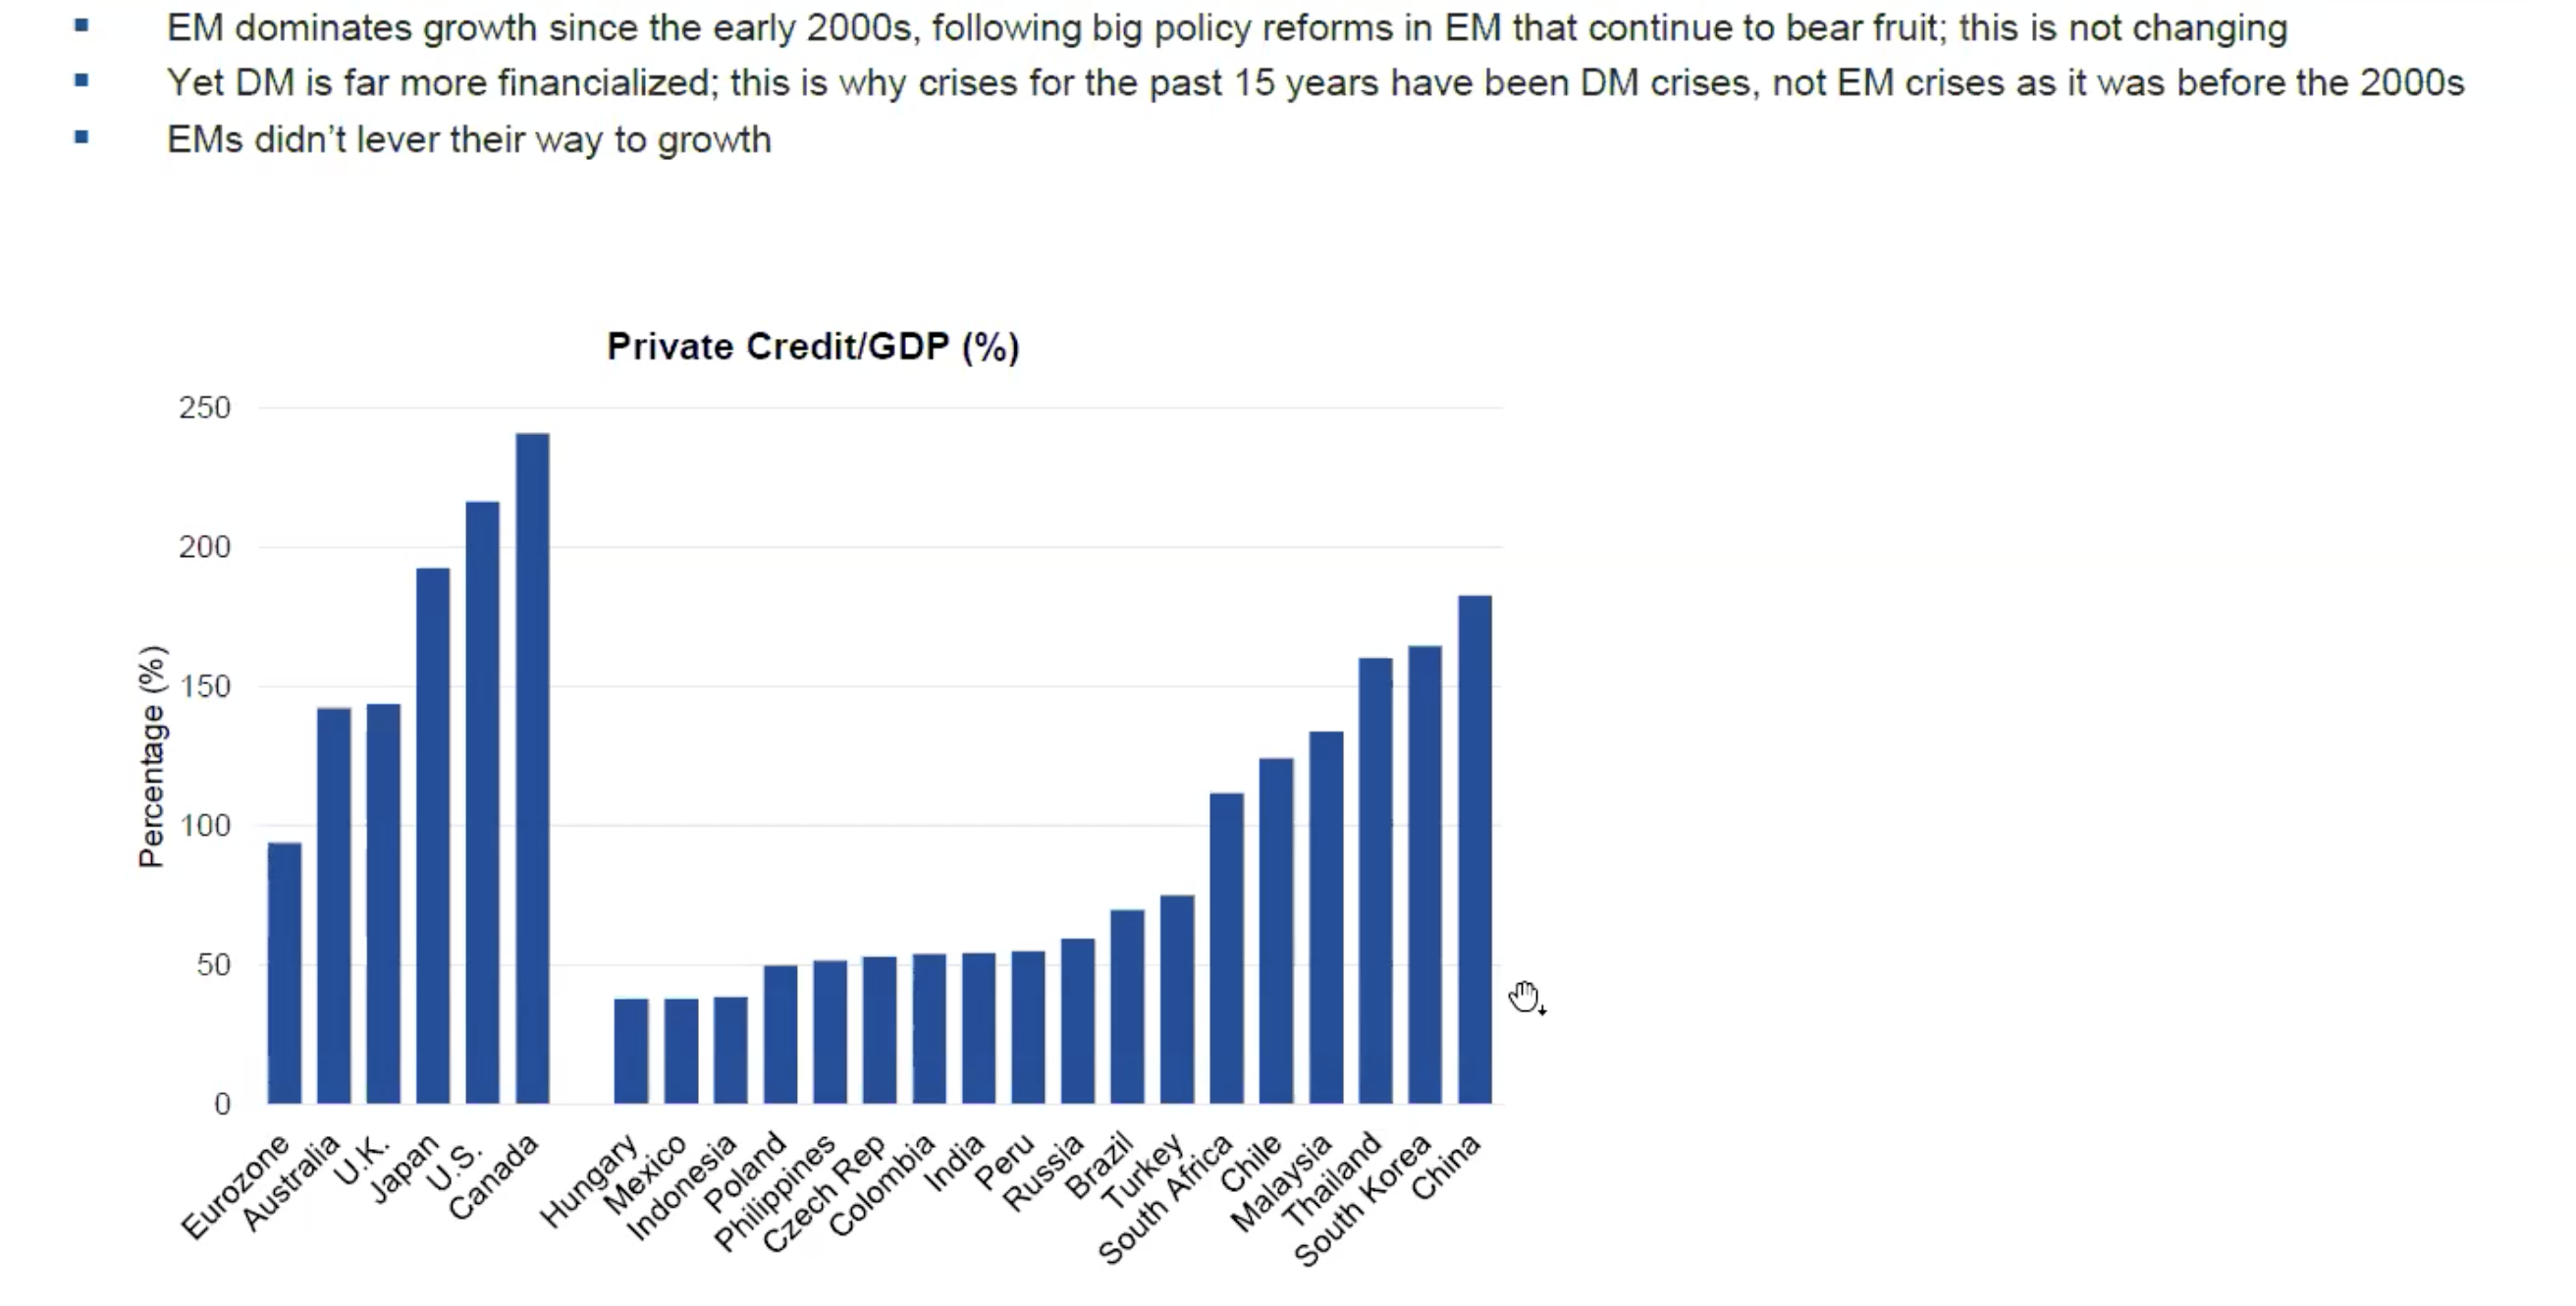
What is more, is that emerging markets are contributing more to global growth than developed countries and are doing so without leveraging their balance sheets and burdening their countries with mountains of debt.
As the following chart illustrates, the U.S. and Canada have the highest amount of debt relative to GDP than any other countries.
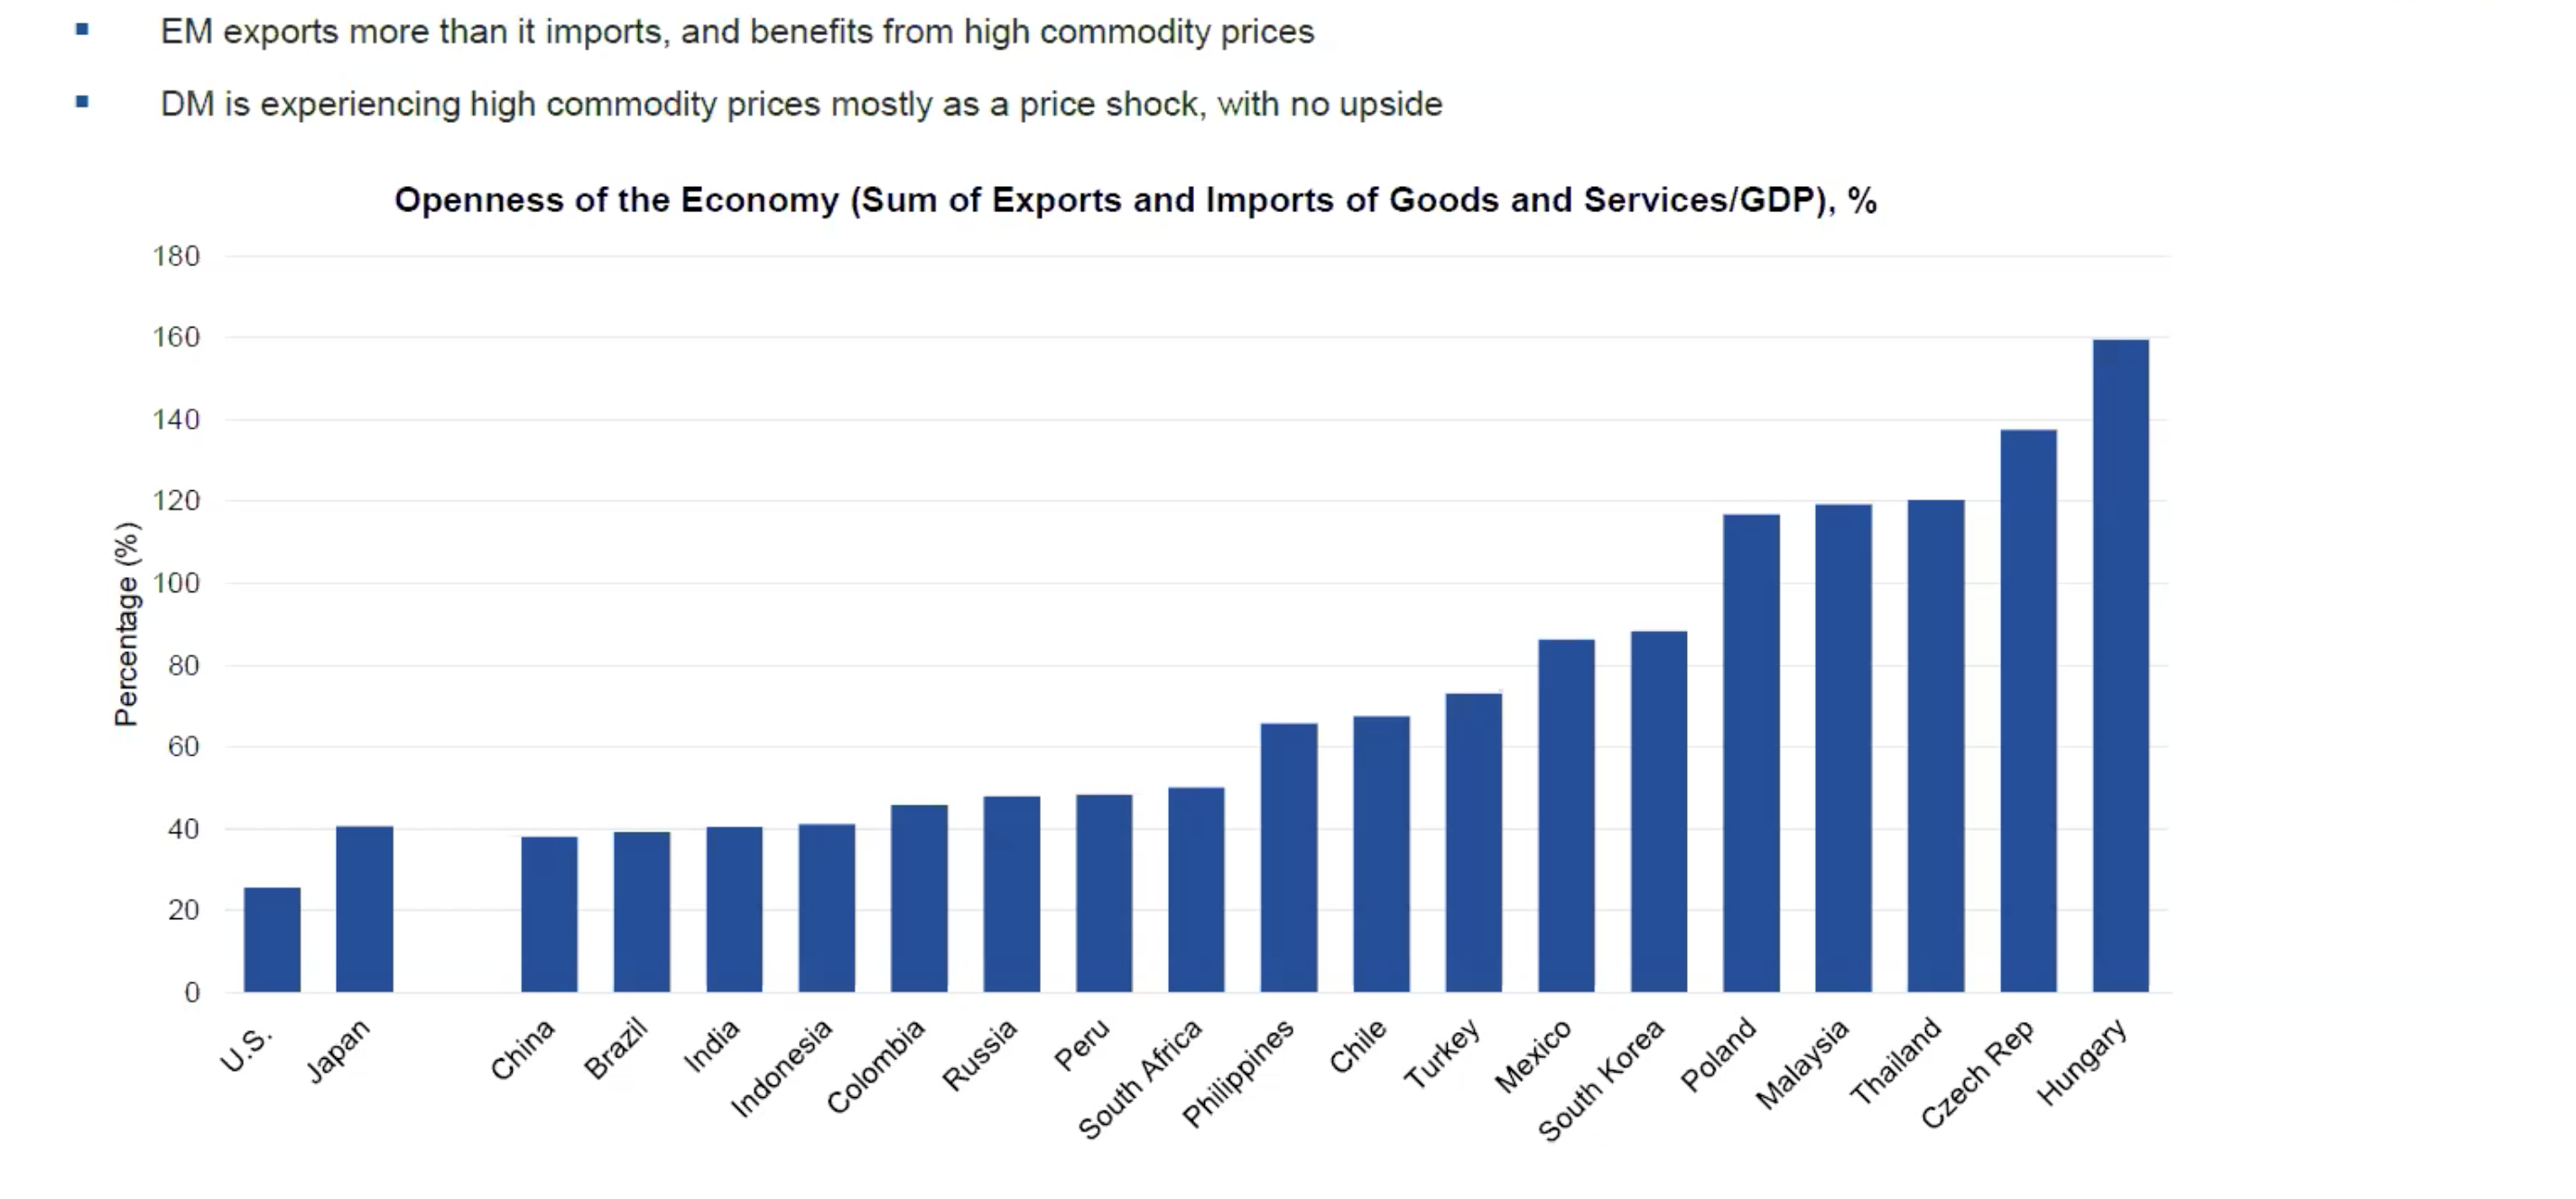
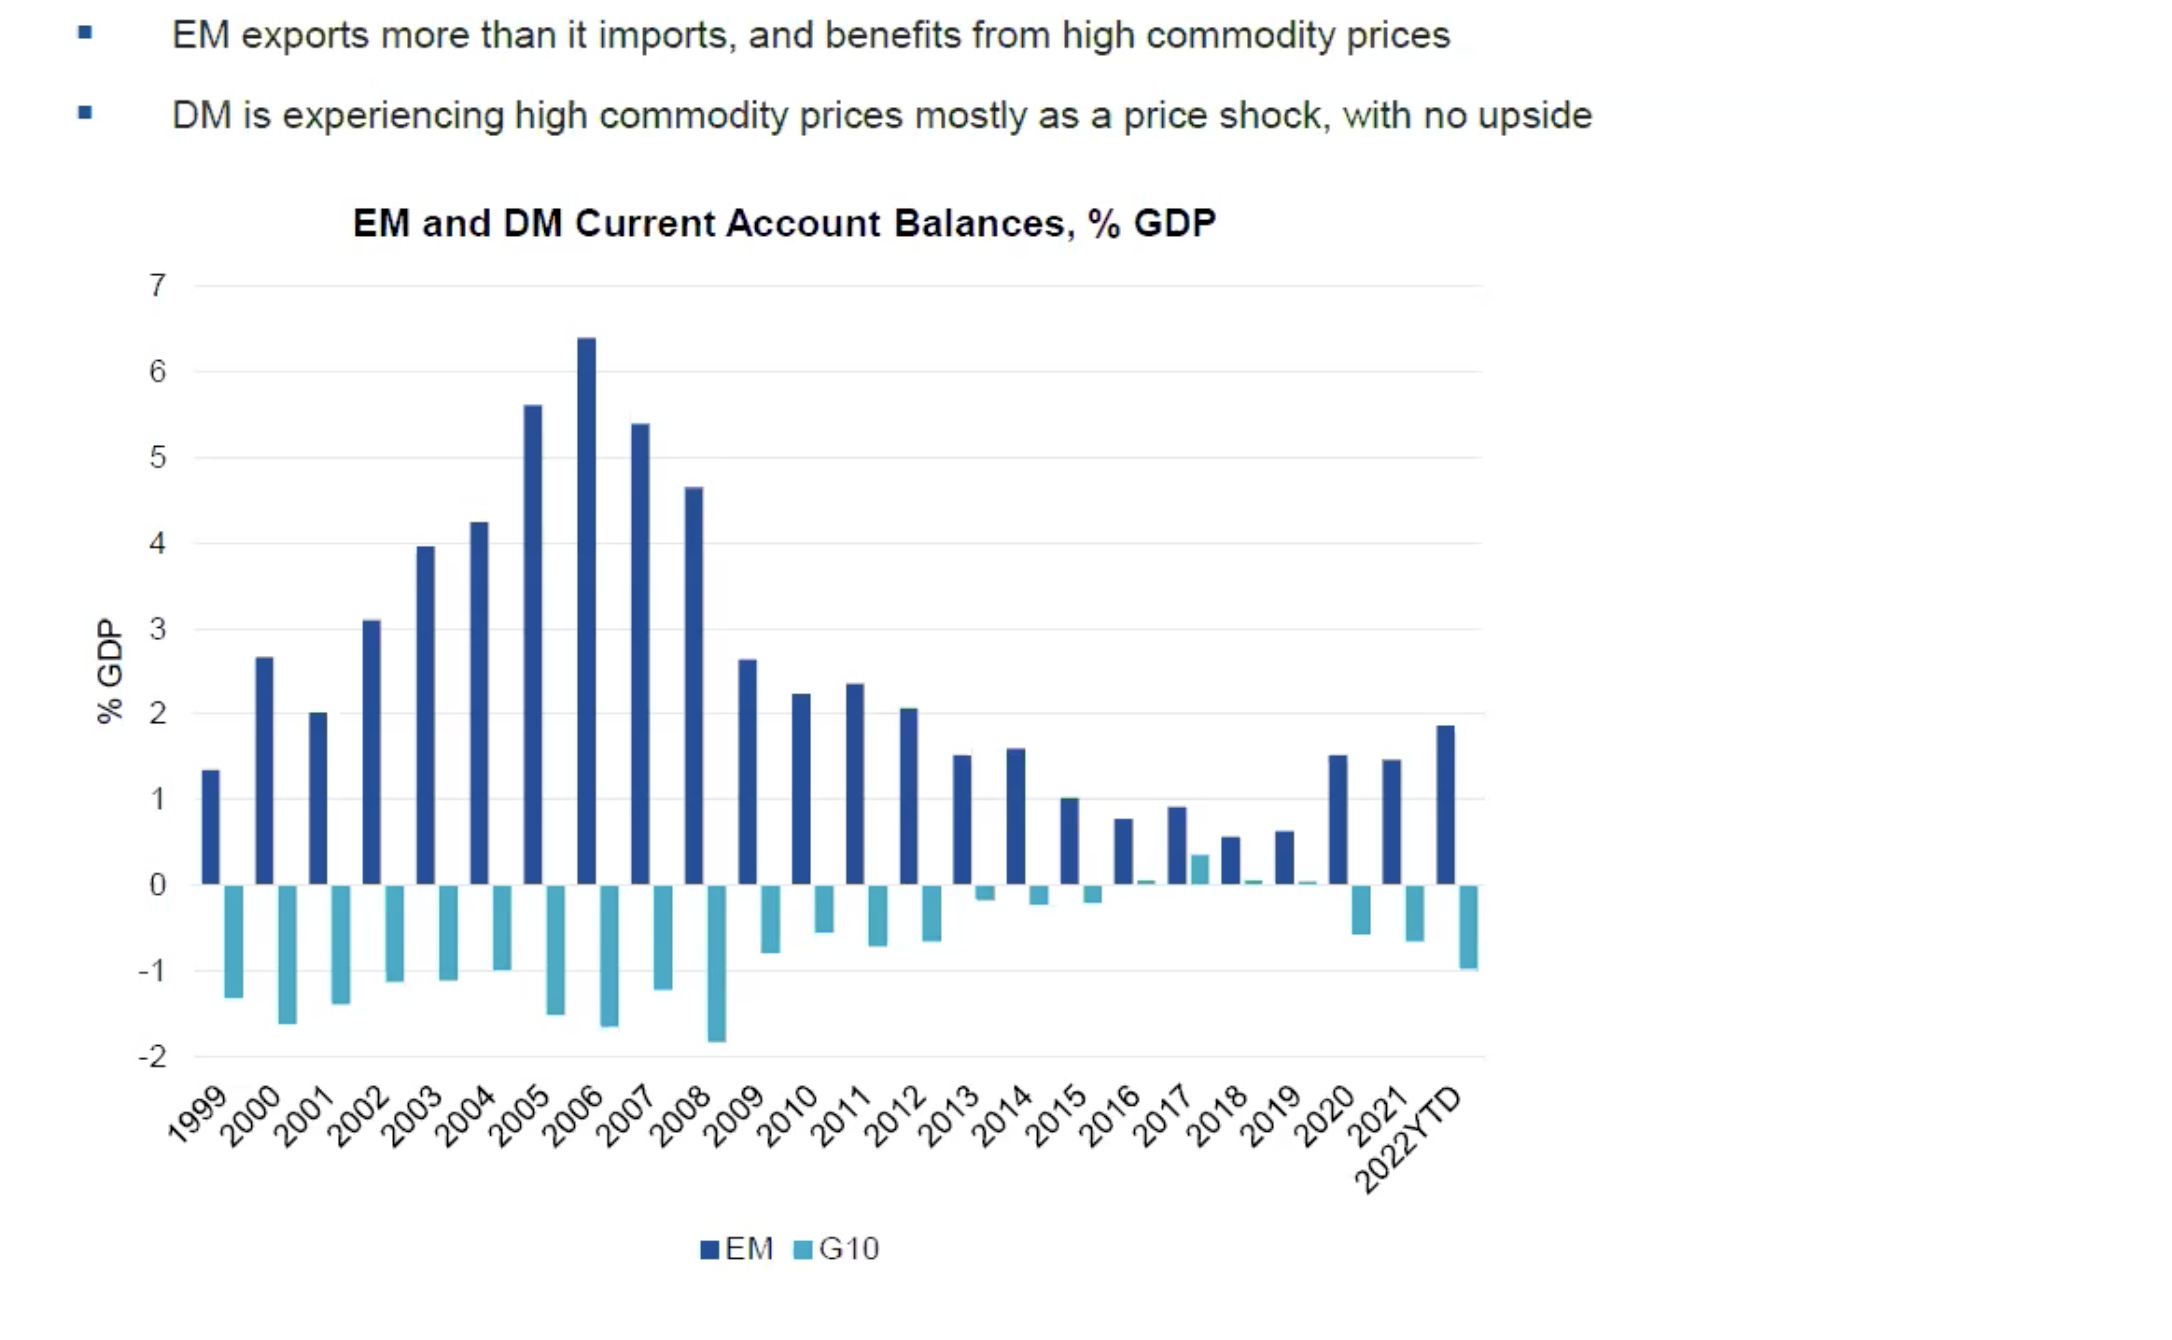
And finally, emerging markets benefit from inflation instead of being harmed by it, which is different from the situation in developed countries.
The issuers of emerging market debt are many countries and respective companies that export commodities.
It is important for investors to understand that emerging market debt is typically issued in local currency and not U.S. dollars. This makes the emerging market debt less attractive during periods of a rising dollar but more attractive during periods of U.S. dollar weakness.
After peaking in mid-October, the USD has been falling steadily.
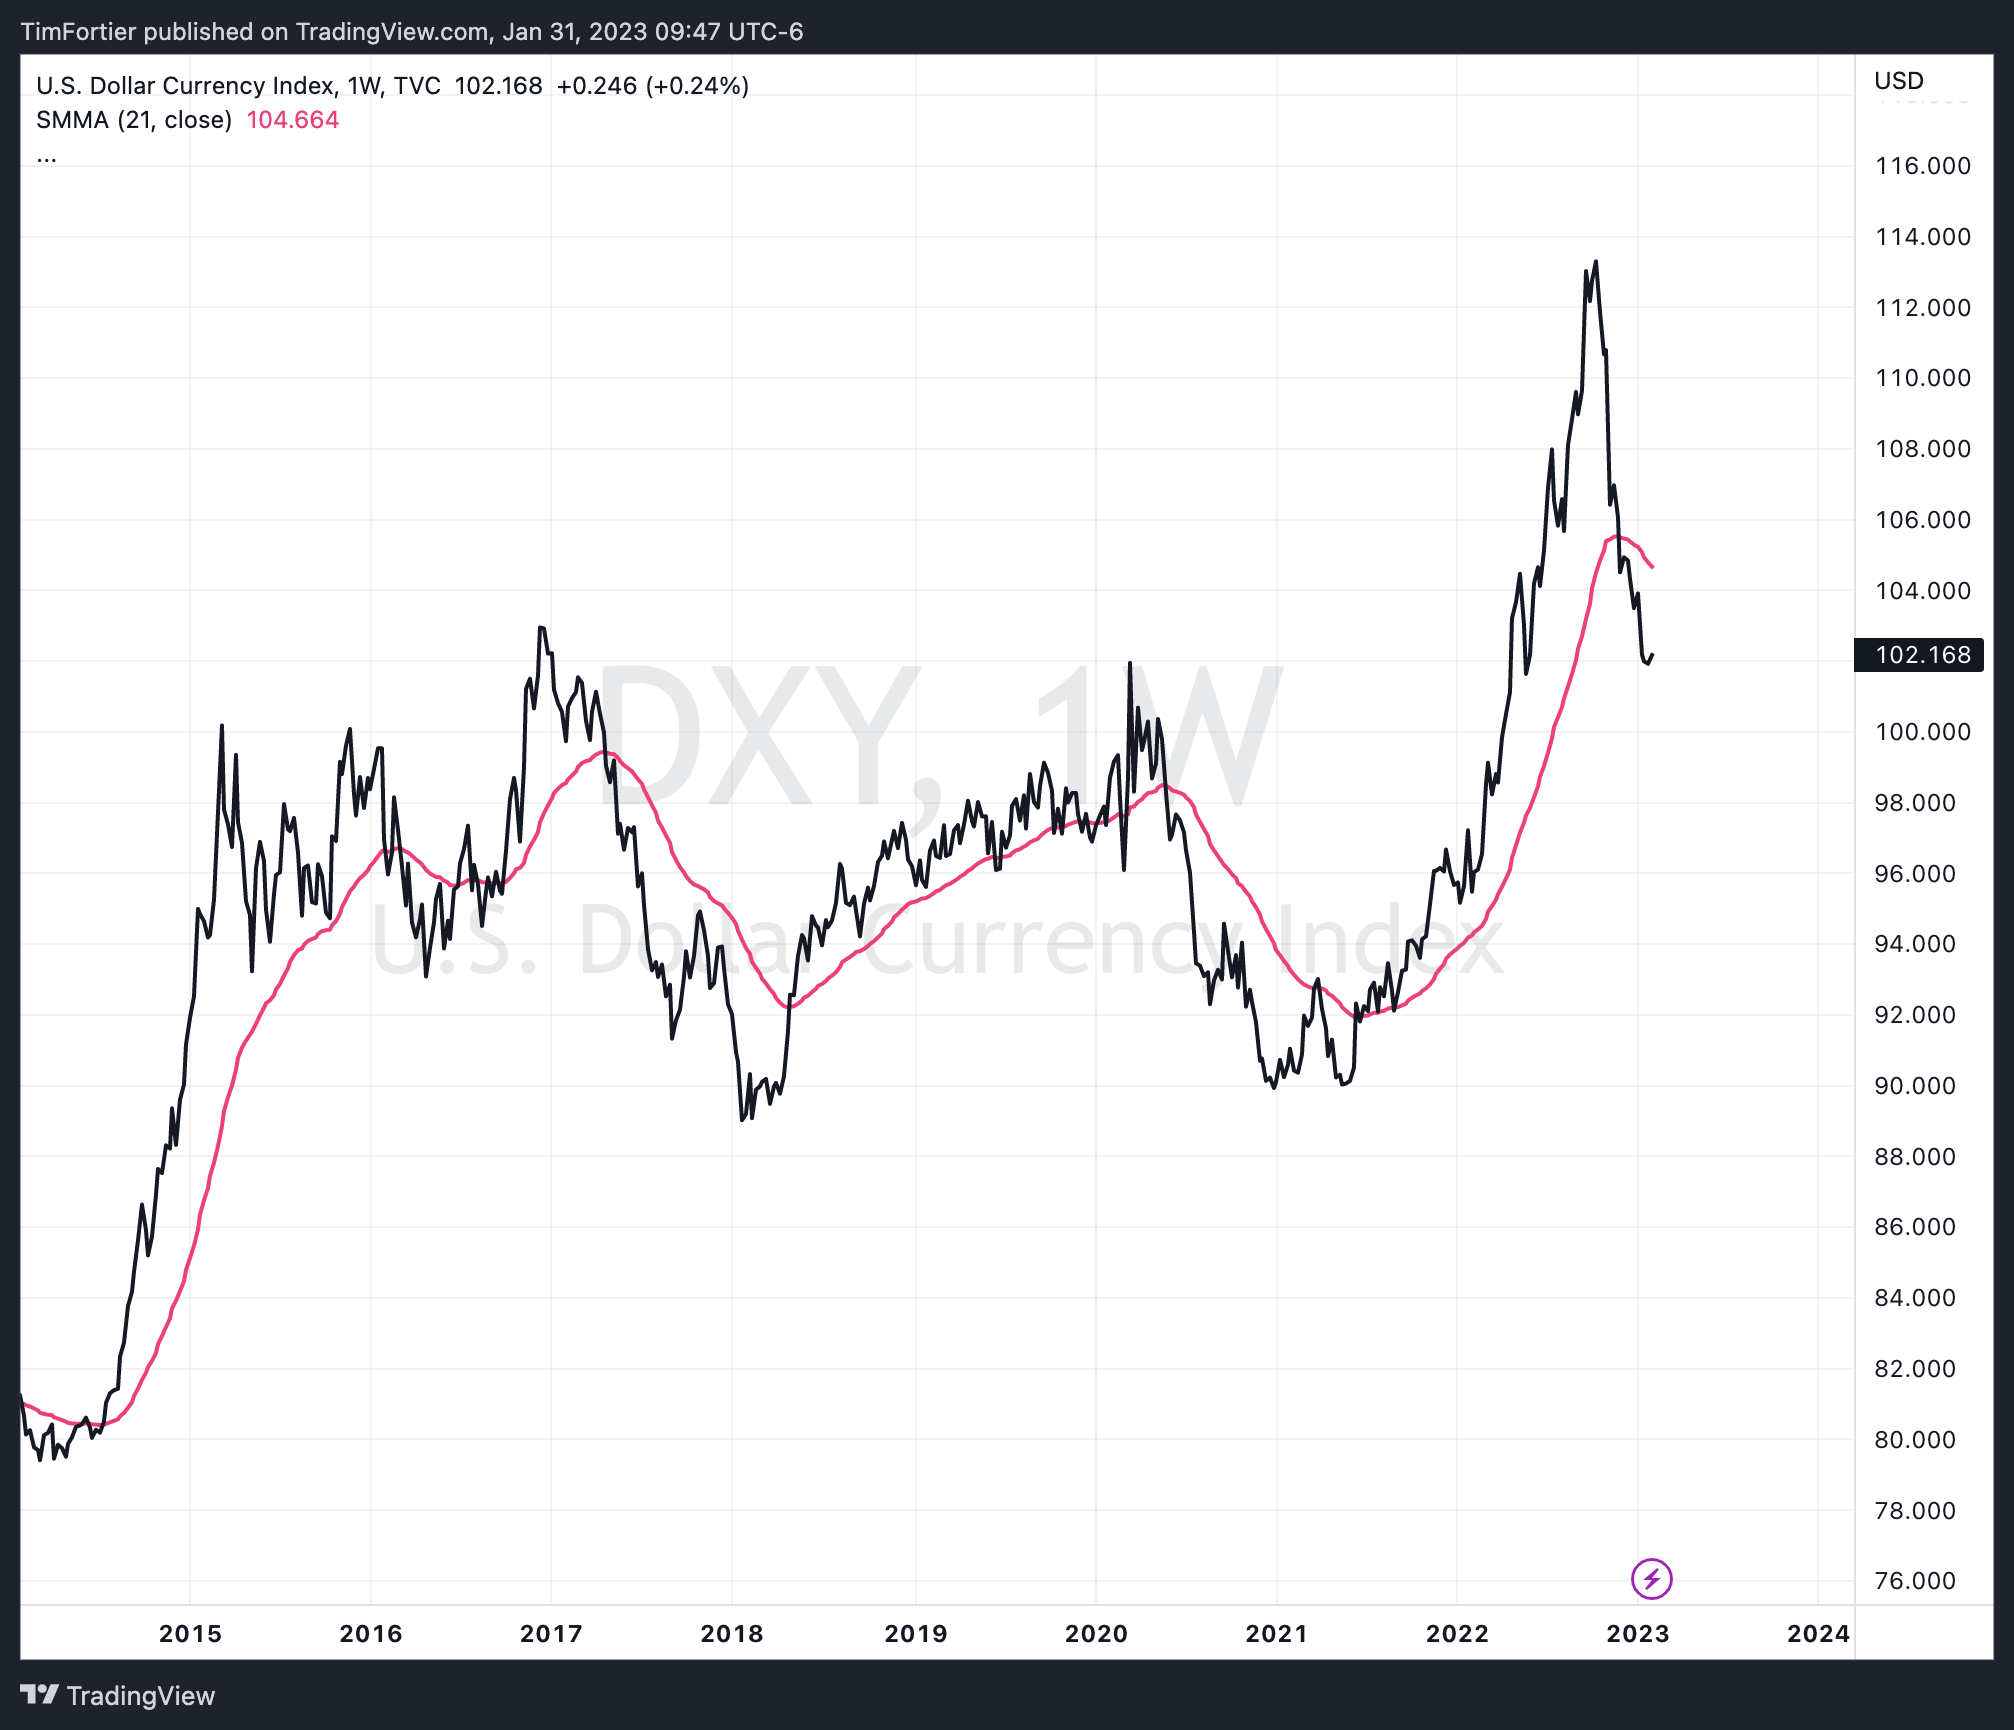
With the growing U.S. debt now over $31 trillion and the continued need to issue even more debt, there is a growing concern that this is going to cause a period of sustained weakness in the USD and undermine confidence.
Just recently, Saudi Arabia announced that it is open to discussing settling trades in other currencies. The implications of this could be profound.
For investors seeking to hedge some of their dollar exposure, the timing may be good to consider emerging market debt.
If you have any questions or have been considering hiring an advisor, then schedule a free consultation with one of our advisors today. There’s no risk or obligation—let's just talk.
Tags

Free Guide: How to Find the Best Advisor for You
Get our absolutely free guide that covers different types of advisory services you'll encounter, differences between RIAs and broker-dealers, questions you’ll want to ask when interviewing advisors, and data any good financial advisor should know about you and your portfolio.
