
Related Blogs
September 21, 2018 | Michael Reilly
For most investors, watching the S&P or the DJIA is the same as watching “the market.”
But…we know that these indices rarely tell the whole story.
Today, we’re going to pull back the curtain and take a closer look at one sector that’s not only helping push these indices to record highs, but is also crushing “market” returns.
One of the big stories recently is Healthcare’s re-emergence as a relative strength standout.
This indicates Healthcare is one sector not to be overlooked.
Because we use sophisticated algorithms to track price behavior of the 11 broad sectors that comprise the U.S. equity market, we have a birds-eye view of the “true market” – in this case, the 11 broad sectors that comprise our U.S. Domestic equity markets.
Our birds-eye view enables us to see which sectors are showing strong price improvements and which sectors are showing weakening demand and lower prices.
We’ve been watching as Healthcare moved up the sector rankings, all the way up to the #4 broad sector, based on relative strength.
That’s pretty significant, because this sector began 2018 as the #6 ranked sector and well out of contention for any serious consideration for investment dollars.
As recently as April of last year, Healthcare was on life support, ranking 10th. At that time only Real Estate ranked lower.
Healthcare hasn’t been a member of what I’ll call the “core 4” in nearly 3 years (January 21, 2016).
The “core four”, are the 4 highest ranked broad sectors on a relative strength basis.
These are the 4 sectors showing the strongest institutional demand and greatest price improvements when compared to all other sectors.
Investment in sectors that rank in the top 4 have historically resulted in market beating returns. But as we all know, past performance is not a guarantee of future results.
With that said, what is sure is that the healthcare sector and related ETFs have been among the best performing plays this year.
Healthcare’s strength relative to the market (the S&P 500) can be seen using a relative strength chart like the one below.
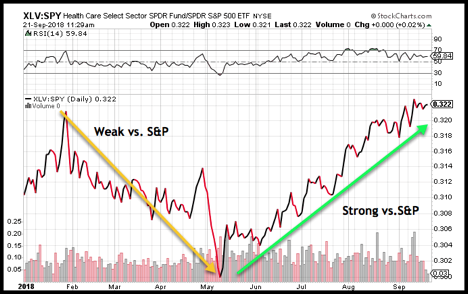
Available at stockcharts.com, a simple relative strength chart will quickly illustrate price strength or weakness comparing two stocks, ETF’s, or markets.
In our comparison I am comparing XLV to SPX – this chart is created by inputting “XLV:SPX” into the symbol search box.
The line chart below compares the relative strength of the Healthcare sector – represented by the SPDR Healthcare Select ETF (XLV). We use XLV as it’s one of the largest Healthcare ETF’s by assets compared to the S&P 500.
Healthcare was weak relative to the “market” (S&P 500) between February and May 2018 – represented by the downward sloping line on the relative strength chart. This indicates the S&P 500 offered superior performance to XLV during that time.
But, since mid May, XLV and the Healthcare sector it represents has shown strong relative strength to the record setting S&P 500 Index.
It isn’t just broad sector funds like XLV that are beating the pants off the S&P this year.
I promised we’d pull back the curtain and take a closer look at the Healthcare sector. So let’s look.
Healthcare can be broken down into its smaller sub-sectors. Consisting of:
- Healthcare providers
- Biotechnology
- Pharmaceuticals
- Medical Products
Investors can choose to either invest in Healthcare broadly or drill down into the sector to find the best performing sub-sector.
Take a look at the bar chart below and the performance of the S&P500 index, to Healthcare and ETF’s that represent Providers, Medical Products, Pharma and Biotech ETFs. The gains of Healthcare and particularly sub-sector performance can’t be ignored.
(Note, we’ve made the chart as large as we can for this article, if you’d like to follow along with a full-sized version, click here)
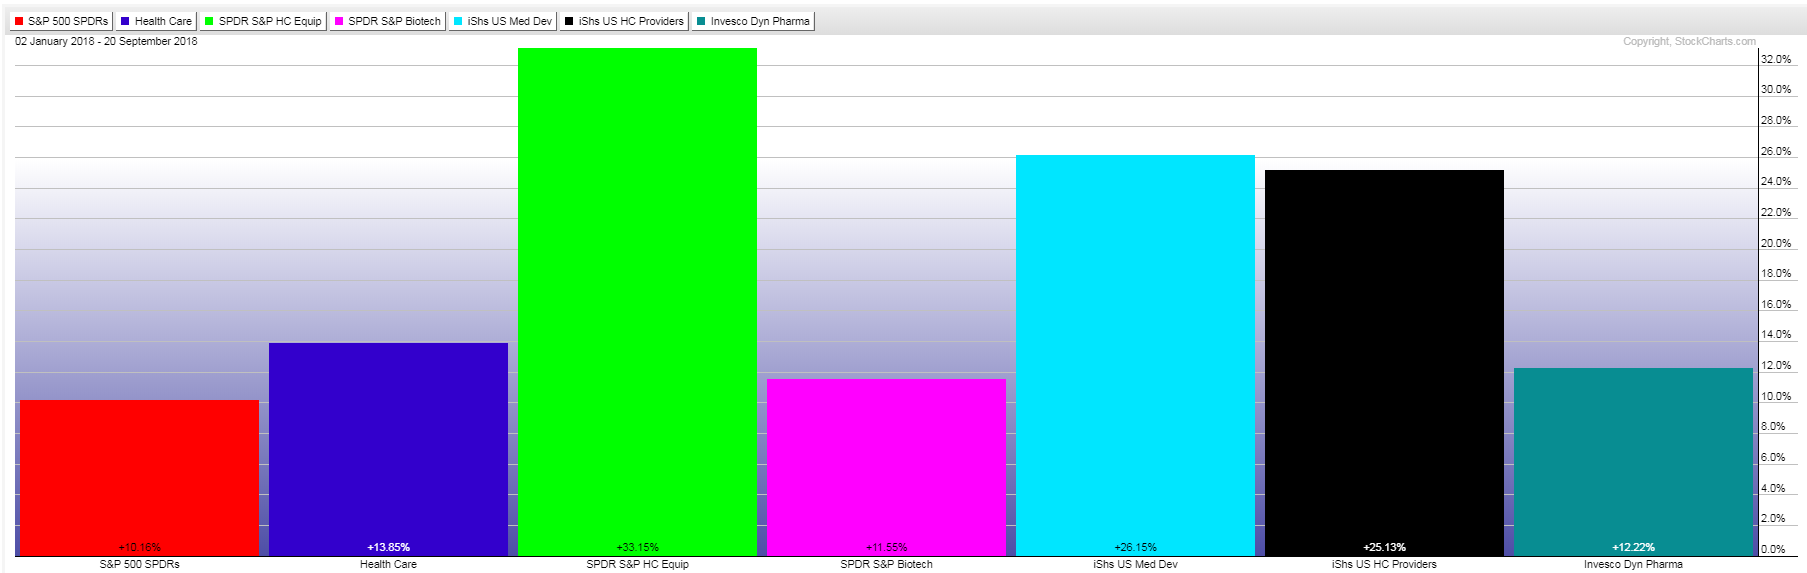
While the S&P (shown in red) has gained 10.16% thus far in 2018, the Health Care Select Sector SPDR (XLV, shown in purple) has advanced 13.85%.
The SPDR HC Equipment ETF (XHE, in light green) has jumped a whopping 33.15%, iShares Medical Devices Fund (IHI, in light blue) is up 26.15%, iShares HC Providers ETF (IHF, shown in black) has gained 25.13%, with Biotechnology (XBI, shown in pink) and Pharmaceuticals (PJP, in teal), up 11.59% and 12.22%, respectively.
For investors looking for additional alternatives, both the Invesco S&P Small Cap Healthcare ETF (PSCH) and the Invesco DWA Momentum ETF (PTH) have offered invested gains between three and four times what the S&P 500 index has in 2018 – with year-to-date gains of 43.74% and 33.97% respectively.
And don’t make the mistake of thinking you’ve missed the ride. Momentum trends usually stick around a long time – these trades can last 18 months to several years.
So, as we can see, Healthcare’s rise through the Relative Strength rankings is significant, and indicates that there’s opportunities for outperformance.
Further drilling down into the sub-sectors allows us to pinpoint ETFs and stocks that may be behind this momentum, and are therefore strong candidates for additional gains.
At Rowe Wealth, we look at each sector in a similar manner, identifying areas showing the strongest relative strength, and then applying technical analysis to determine what’s going on “behind the scenes”.
If you have any further questions about the strength we’re seeing in Healthcare (or any other major sector) don’t hesitate to make an appointment with one of our advisors.
Qualified investors, with portfolios worth $500,000 or more, are eligible for a completely free evaluation. We can use our technical analysis tools to quickly assess the overall strength of your accounts and ensure they’re positioned to take advantage of momentum in the market.
Click here to see available appointment times.
As always, invest wisely.

Get Our FREE Guide
How to Find the Best Advisor for You
Learn how to choose an advisor that has your best interests in mind. You'll also be subscribed to ADAPT, Avalon’s free newsletter with updates on our strongest performing investment models and market insights from a responsible money management perspective.
