
Related Blogs
September 28, 2018 | Michael Reilly
Here in New England, Fall ushers in the annual change of seasons, bringing cooler temperatures and the reds, yellows, and oranges of Fall foliage.
Like fall in New England, each year the stock market tends to repeat certain seasonal trends. These seasonal trends affect both individual stocks and the stock market as a whole.
By understanding how these trends work, investors can often gain an advantage when it comes to trading and investing.
You see, some months are historically better performers than others.
For example, according to the Stock Trader’s Almanac: since 1950, November, December, and January have traditionally been the three consecutive months that reward investors with the highest gains.
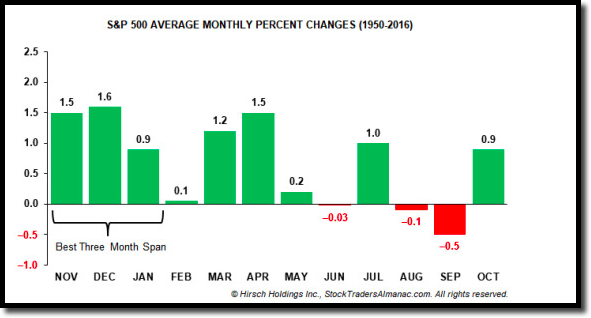
Over the last 67 full years, the S&P 500 has gained an average of 4.1% during the three consecutive months of November, December and January.
The DOW and NASDAQ have also gained an average of 4.0% and 5.9% respectively during the same three month span.
Over the long-term, these have been the best three consecutive months to be long in the market.
Of course, not every year is positive, but they have been a consistent source of gains in the past.
Armed with this information, some traders might decide to invest more heavily in the months of November – January, believing this is the best season to invest boldly…however, this is not a strategy we endorse.
Other market participants often choose to invest only during the six month period of November through April, because it is considered the best six months in the market.
It’s where the old investment adage, “Sell in May and go away” found its roots.
So, while the chart above provides gains or losses on a month to month basis, what investors may find even more helpful are the two charts below.
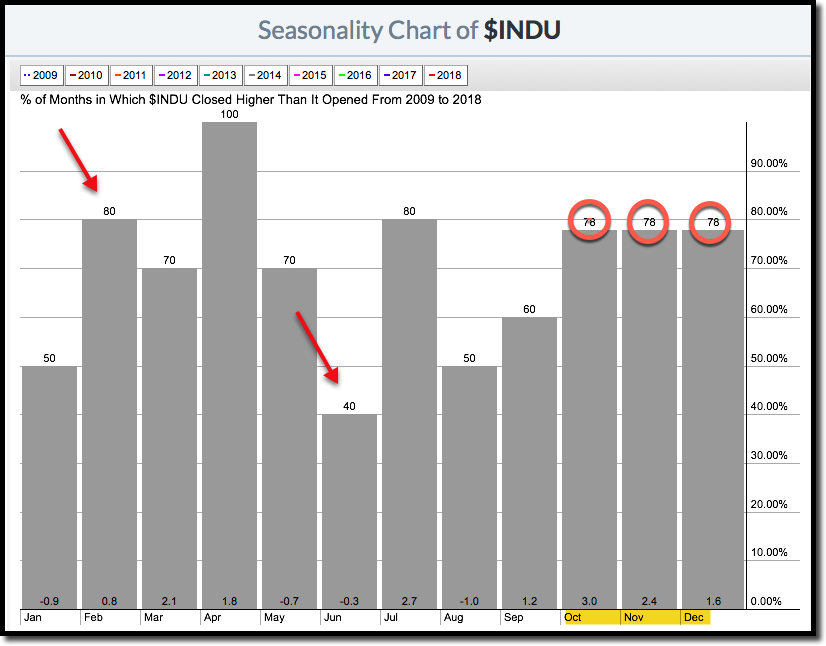
These charts illustrate the percentage of time the S&P or the DJIA ended the month higher than where it began – in other words, what’s the probability of success in any given month.
For example, looking at the DOW (2009-2018), the month of February has had positive returns 80% of the time over 10 years – amounting to pretty good odds for traders.
…While investing in the DOW in June is significantly less attractive, gaining ground only 40% of the time over the past decade.
The arrows below designate these two months, while the circled numbers signify the optimal “three month span” we talked about earlier.
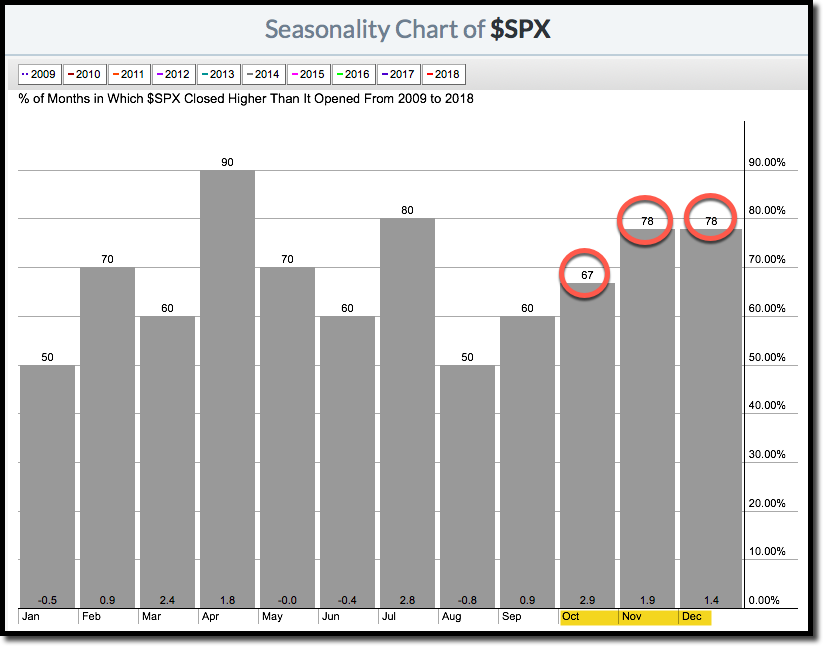
The S&P 500 has shown a similar seasonal bias since 2009, with gains in February 70% of the time – 60% of the time in June.
Research of the previous decade indicates October, November and December have historically been the most consistent months for investing in either the Dow or the S&P 500.
This three month period has turned in positive returns nearly 80% of the time (78%). Pretty good odds, wouldn’t you say?
Editors note: The month of October sees an exception to the 78% avg. in the S&P, turning in a historically lower win rate of 67%.
Our ability to apply relative strength analysis goes far deeper than just calendar year trends – and that’s especially handy right now.
In case you’ve somehow missed the endless barrage of commercials by candidates vying for your vote – we are in a midterm election year.
And election cyclicals (mid-term and Presidential) effect financial markets.
Many investors are not aware that since 1950, the midterm election year has often been the weakest of the four year Presidential cyclical.
While the best performing year in the 4 yr. cycle is the pre-election year.
And 2019 is a pre-election year!
So, investors have two things in play right now.
First, we’re coming to the end of the historically weak mid-term year.
Second, we’re entering what is historically the strongest year of the 4 year Presidential cycle – the pre-election year.
In the past, October through December of the midterm election year has marked the beginning of the seasonal up-swing, a time when some of the strongest gains have been made.
Take a look at the chart below and focus on the rise of the black line – representing midterm years and compare that to the rise of the red line -representing all years.
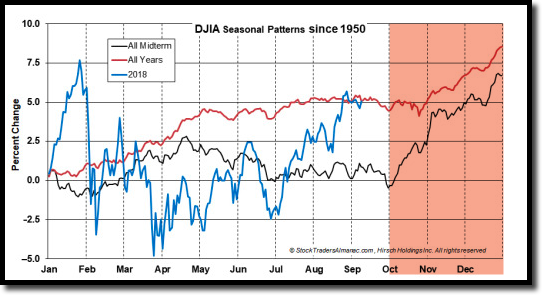
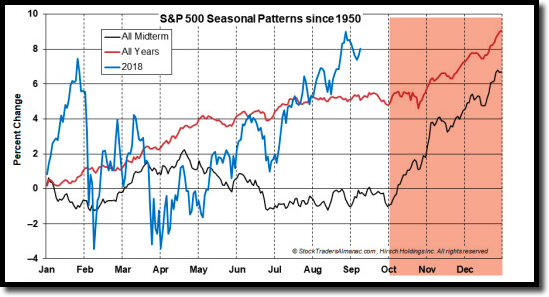
So while both lines rise, the black (midterm year) line rises more dramatically beginning in October (highlighted).
Astute investors will see this as a potential opportunity to profit from this historical seasonal trend.
Although there is no guarantee that history will repeat itself again this year, now is a time we remind our followers to refer back to their relative strength analysis and investment rules to determine when to hold and when to fold.
As a reminder, we find it best to invest only in the strongest sectors, found within the strongest global asset classes.
Today, U.S. Equities remain the #1 asset class by a wide margin.
Technology, Financials, Industrials and Healthcare are the four strongest broad sectors on a relative strength basis.
It’s possible to drill even further down into sub-sectors, which is something we do when constructing models and building our client’s portfolios.
If this is something you’d be interested in learning more about, don’t hesitate to schedule a call with a member of our team. Our advisors would be happy to discuss our models with you.
Qualified investors (with investable assets totaling at least $500,000) are also eligible for a free portfolio analysis, which will allow you to determine if you’re missing out on exposure to specific, high strength sub-sectors.
Click here now to see available appointment times.

Get Our FREE Guide
How to Find the Best Advisor for You
Learn how to choose an advisor that has your best interests in mind. You'll also be subscribed to ADAPT, Avalon’s free newsletter with updates on our strongest performing investment models and market insights from a responsible money management perspective.
