
Related Blogs
June 7, 2019 | Michael Reilly
Most seasoned investors know you don’t fight the DJIA.
And it’s wise to remember the market isn’t always trending up, or trending down.
It doesn’t always have to be a top or a bottom.
Most of the time, it’s just in the middle. And sometimes – like it has been since early 2018, the trend is actually sideways.
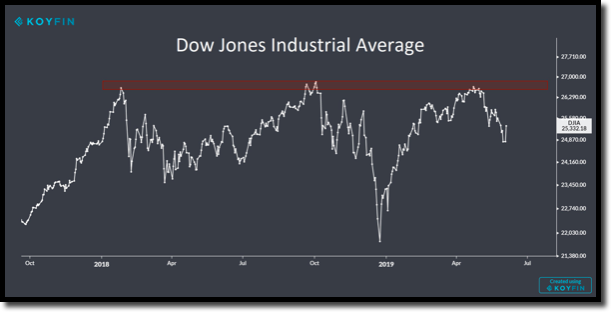
Here is the chart of the Dow… after rebounding off December 2018’s rout, the DJIA moved back to its January and October 2018 highs, before again failing to breakout.
So what I’m saying is, investors in the Dow are in about the same place they were 18 months ago – sideways consolidation.
The reasons don’t much matter. You can blame the Federal Reserve, Donald Trump or Trade Wars. It’s all noise.
And usually none if it is useful when it comes to really understanding market direction.
But what can be useful is understanding the difference between the what and the why of the market’s current movement.
We find the what much more helpful when it comes to making investment decisions.
And what is really happening in the U.S. Stock Market, including the DOW, is incredibly simple.
Demand for stocks over the past 18 months has yet to absorb the amount of supply near these levels (see chart, levels highlighted in red).
In other words, there are more sellers than buyers once the market hits these levels. That’s what has caused the market to sell off recently.
When you get right down to it, it’s simple, for every buyer there is a seller and for every seller there is a buyer.
But the key here is that there aren’t an equivalent number of buyers and sellers at every price, which is why stocks move up and down.
In the case of the Dow, it has taken 18 months and still no breakout, telegraphing to investors that at these prices, there are still more sellers willing to sell than buyers willing to buy.
That’s what causes consolidations – and these are a normal occurrence for markets digesting big moves like the one we’ve just witnessed.
Ultimately, consolidations get resolved. They either break out or they breakdown.
And when looking at the overall relative strength of U.S. equities vs, every other asset class (U.S. equities remain the #1 strongest asset class) – we still think that ultimately the resolution from this consolidation will be higher.
Most technical investors have been taught “The bigger the base, the bigger the breakout”. So be prepared.
How long will it take? Who knows? I certainly don’t.
The market will tell us. When buyers step in at higher levels – to absorb this overhead supply, then and only then can the market breakout. And that hasn’t happened yet.
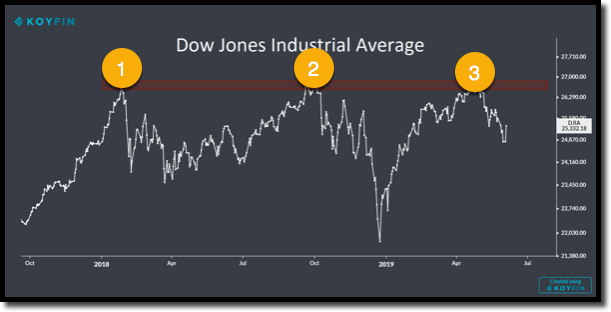
The Dow has tested those levels 3 times now. For convenience, here is the Dow chart again.
Dig up a chart of the Nasdaq or the S&P 500 and you’ll see the charts look similar.
Will a 4th test of overhead supply be the one? Will it take a 5th test before stocks breakout?
The more times a level is tested, the higher the likelihood that it breaks. Why?
Think about it, with each test of supply, more and more willing sellers will have already sold.
Eventually there comes a point where anyone willing to sell will have already sold. And that’s when you get “the breakout”.
In the meantime, we’re looking for stocks showing relative strength in the strongest asset classes – U.S. equities.
When the selling pressure lets up, and these stock indexes break out, it’s the high relative strength stocks, the ones already showing signs of institutional accumulation, that will most likely be the leaders.
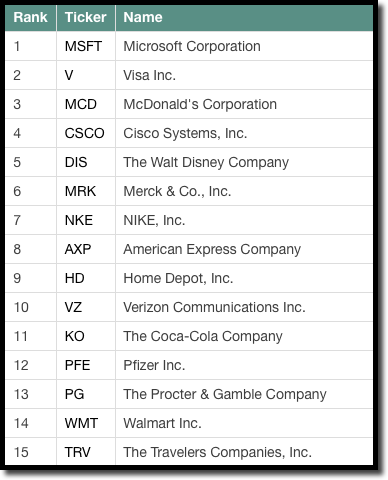
Below is a snapshot of the strongest 15 stocks of the Dow 30, listed in order of relative strength – strongest to weakest.
Investors can use this partial list as a good place to find high relative strength names or confirm their own Dow stocks make the grade.
Of course, if you want the work done for you, you may want to contact us at info@Rowewealth.com or schedule a consultation with one of our advisors to inquire about our models that automatically rebalance to contain the highest scoring relative strength sectors. We have multiple models available depending on your personal investment style and desired level of risk.
Click here now to see available appointment times.
And, as always, invest wisely.

Get Our FREE Guide
How to Find the Best Advisor for You
Learn how to choose an advisor that has your best interests in mind. You'll also be subscribed to ADAPT, Avalon’s free newsletter with updates on our strongest performing investment models and market insights from a responsible money management perspective.
