
Related Blogs
June 11, 2019 | Michael Reilly
If diversification is so good, then why have Consumer Discretionary stocks crushed the performance of the S&P 500 since 2008?
XLY, the SPDR ETF that invests in consumer discretionary stocks, has delivered investors an eye popping 254% gain since 2008.
That’s more than 2.5 times the return of the S&P 500 index fund SPY and its gain of 96.74%.
So should you really listen to Wall street’s mantra of “diversify, diversify, diversify?”
I’m not suggesting diversification doesn’t have its place. But most investors could probably benefit from a healthy dose of relative strength, and too much diversification can be detrimental to long term performance.
Consider this quote about diversification from one of the most prolific investors of all-time:
“Diversification is a protection against ignorance. It makes very little sense for those who know what they’re doing.” – Warren Buffett
Conventional wisdom says to diversify, you hear it all the time – invest in various asset classes and sectors so that stronger areas can protect you from weaker areas.
But, have you ever really considered this from the other side of the proverbial coin?
I’m of the school of thought that believes diversifying into weaker areas, simply for the sake of diversification, is killing your performance.
Two forces are at work here – the first; opportunity cost – money allocated to weak sectors isn’t invested in stronger sectors.
And second, weak sectors often produce weak returns. And weak returns are pulling down higher returns from stronger investments – that results in average returns for investors.
Is that what you want? Average returns? If all you want is average returns then ok, invest in an index fund (like SPY) and don’t look at it for 10 years – be happy with what you get.
To me, diversification guarantees you one thing – you’re gonna own something that looks bad right now.
Let’s take the S&P 500 for example. Investors can’t buy directly into the index, but you can invest in an ETF that’s supposed to track its performance.
By investing in SPY (an ETF that tracks the S&P 500), you most certainly will be diversified.
An investment in SPY provides exposure to all 11 broad sectors that comprise the S&P 500 Index.
That sounds pretty good right? Well, maybe not…
Because it’s unlikely that all 11 sectors are moving up at the same time. And even if they were, some sectors are likely moving higher than others.
According to Nasdaq/Dorsey Wright Associates, the average annual dispersion between the best performing sector and the weakest is 36.40%.
For example, in 2017, the SPDR Select Technology ETF (XLK) finished the year with a hefty gain of 32.24%, while the SPDR Select Energy ETF (XLE), lost -4.06%.
How would you feel being on the wrong side of that trade?
The dispersion between XLK (best sector) and XLE (worst sector) in 2017 was 36.30%.
So, why would anyone want to invest in weak performing sectors when that capital can be allocated to stronger, better performing sectors?
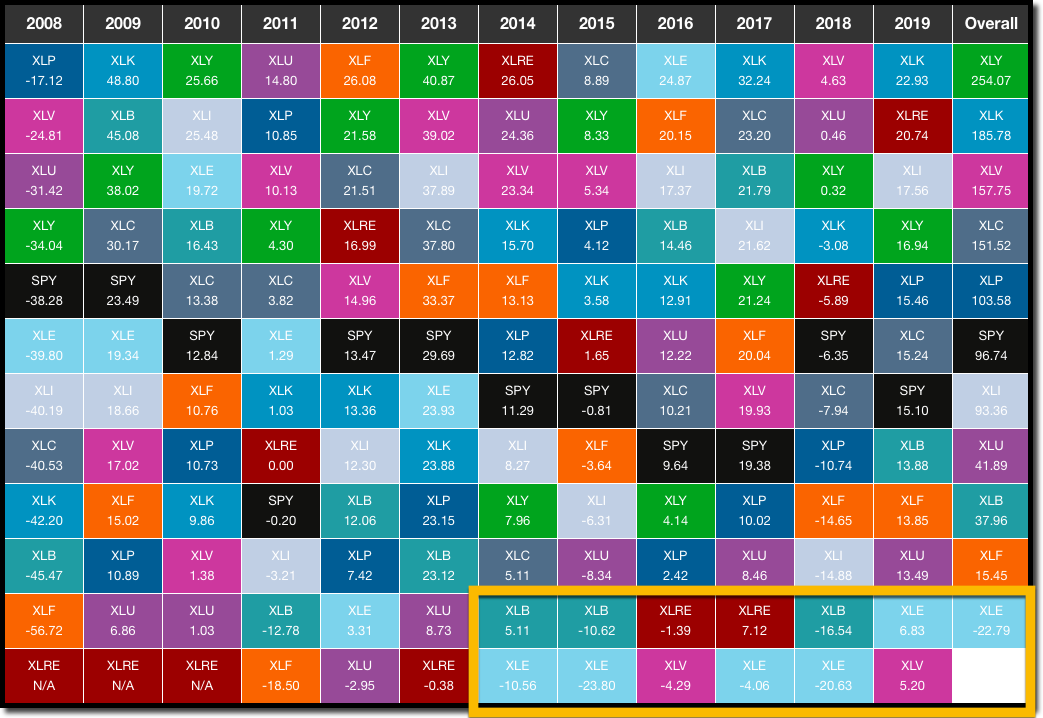
Take a look at the sector quilt below, it illustrates the annual performance of the 11 broad sectors that comprise the S&P 500 Index – considered the “market” by many investors.
Each colored box represents 1 of the 11 sectors – with SPY (black box) acting as a proxy for the S&P 500.
Here’s how to read the quilt. Within any year, the strongest, best performing sector is listed on top of the yearly column, while the weakest performing sector is at the bottom.
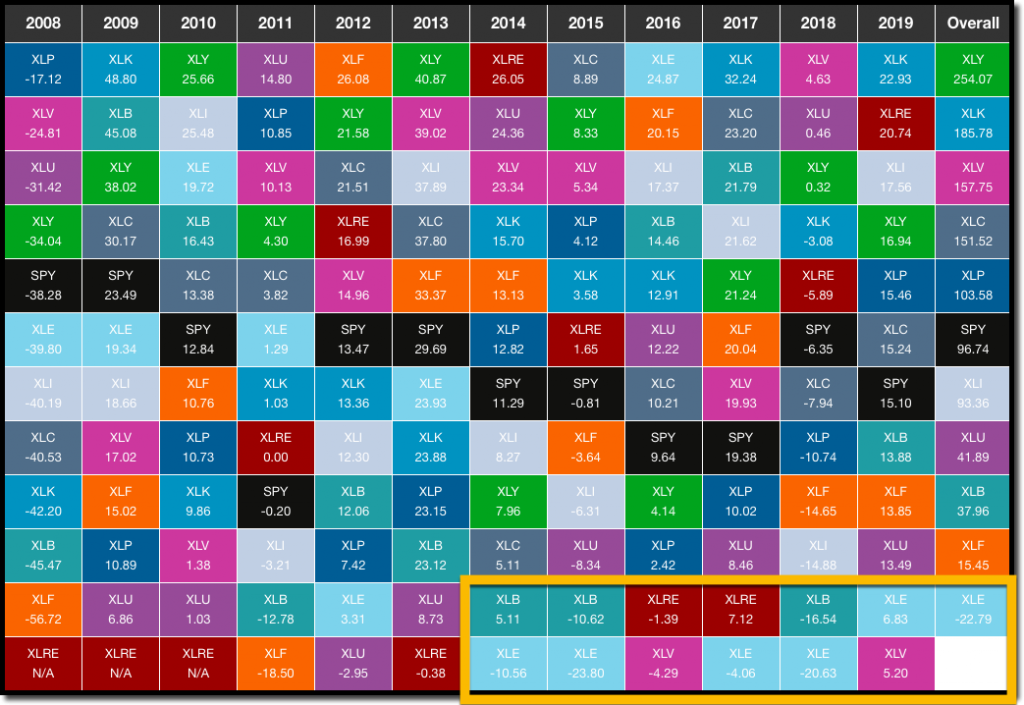 Chart provided by Nasdaq/Dorsey Wright.
Note: We’re using SPDR Sector ETFs as our proxies.
Using our earlier 2017 example, XLK (technology) was the best performer, while XLE (energy) was the weakest.
The column to the far right is for reference and provides long-term returns of each sector (since 2008).
As you can see, the consumer discretionary sector XLY has performed the best, gaining 254.07%, while SPY – our S&P 500 index proxy has gained 96.74%.
Over the duration, investors in the Energy sector ETF (XLE), have languished with negative returns of -22.79%.
And then there’s the S&P 500 index fund (SPY) – the black box in the quilt. It usually resides somewhere in the middle of the pack. The reason… you guessed it! Because its performance is based on the average return of all 11 broad sectors of stocks trading on the S&P 500. Including weak sectors.
By diversifying blindly in all sectors, regardless of their relative strength or weakness to one another or other markets, a significant amount of your money is being invested in weak sectors – like energy and materials. See the yellow box surrounding the bottom of the quilt in years 2014 – 2019 (present).
As you can see, diversifying in all sectors usually means a chunk of your money is underperforming – badly.
Wall Street preys on those who mindlessly buy diversified ETFs. Part of your money is spent buying areas of the stock market that Wall Street hates, so they’re more than happy to short those shares.
They take the proceeds earned from shorting weak sectors – the sectors you’re buying – and then buy stocks in outperforming sectors.
They make a fortune and then preach to us about diversification.
Look, you don’t get a choice when you buy shares of a diversified ETF like SPY. It’s not as though you can call your broker and say “buy 500 shares of SPY, but only buy the top 4 or 5 sectors and skip the rest.”
It isn’t like going to Burger King and ordering a Whopper and asking them to hold the pickles and onions because you don’t like them.
But, with the proliferation of sector ETFs, investors have the ability to pinpoint investments to specific sectors – the strongest sectors on a relative strength basis.
So, skip what Wall Street is pitching. There’s no reason to own the entire S&P 500 index, not when you can be very selective in your ownership.
And that means saying “no thank you” to weak sectors – like energy and basic materials.
You know the expression, “every dog has its day”? Well sectors do too – and when XLE and XLB begin to outperform again, then add them to your portfolio.
In the meantime – Stick with what is working until it doesn’t work any longer.
If tracking the strongest sectors and rebalancing your portfolio regularly sounds like more work than you’d like, you may be interested in one of Rowe Wealth Management’s relative strength models.
We have several models that rebalance to contain the highest scoring sectors based on relative strength. That way, you can relax and let our proprietary systems do the work for you.
For more information on our models, feel free to email us at info@rowewealth.com, or click here to schedule an appointment to get more information directly from one of our advisors.
We look forward to hearing from you.


Get Our FREE Guide
How to Find the Best Advisor for You
Learn how to choose an advisor that has your best interests in mind. You'll also be subscribed to ADAPT, Avalon’s free newsletter with updates on our strongest performing investment models and market insights from a responsible money management perspective.
