
Related Blogs
November 30, 2021 | Michael Reilly
News that a new COVID-19 variant has surfaced in South Africa spooked global equity markets this past Friday causing a frenzied sell-off.
The question coming into Monday’s open was whether that sell-off was an overreaction and an opportunity – or the beginning of a much deeper, panic-driven sell-off.
My thinking was – if global markets continued to panic and sell-off and it’s discovered the new variant poses less risk than first thought, a major global rally could follow.
And as Monday’s trading session got underway, that’s exactly what we saw, as both the S&P 500 and broad sectors rebounded from Friday’s sell-off.
So, although it appears equity markets have calmed and selling pressures have subsided, at least temporarily, there is still the question of what data investors should keep an eye on for future clues as to the overall direction of the markets.
Let’s start with where investors shouldn’t look for market guidance.
Do yourself a favor – avoid searching media outlets looking for financial advice, which proved to be absolutely worthless during the height of the 2020 pandemic.
Seriously, gain clarity and sanity by stepping away from the financial news network programs. You’ll be glad you did.
Instead, investors should spend their time focusing on what Wall Street is doing with their money.
Follow the money – focus on price trends.
In a previous ADAPT Weekly article, I wrote about small-caps’ attempts to finally break out of a range that they’ve been stuck in since February.
They didn’t. The attempt failed with Friday’s sell-off, which given the circumstances, probably shouldn’t have come as a big surprise.
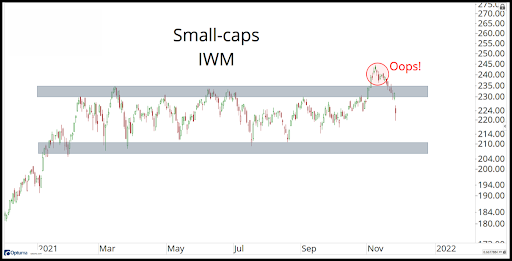
You see, when investors get nervous and head for the exits, it’s typically small-cap stocks that get sold first, while the established household names are held the longest.
As of Friday’s market close, small-caps found themselves back in familiar territory, trading at levels they’ve been stuck in since February.
So, if the risk-off trade were to accelerate, expect small-caps to continue to sell-off.
On the other hand, if Friday’s sell-off was a knee-jerk reaction to the covid news, then small-caps could make another run at a breakout – indicating risk-on is back.
That thesis is still valid as we move into the trading week.
One day doesn’t a rebound make. The media isn’t done with their newest headline and neither are the global equity markets.
Small-cap stocks are only a part of the narrative this week…
A lot of investors haven’t even noticed the relative weakness of small-caps this year because they focus so heavily on large-cap stocks – think Apple, Microsoft, Google, and Tesla.
Check out this chart of the S&P 500 (SPX). The two areas outlined have been important price levels in the past – and we say that price has memory.
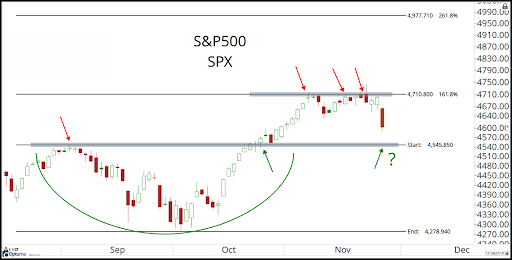
The 4545-4500 level is going to be important. A break below that level, which is also the September high, would not be a good look for what’s to come. A move back to the 4700 level would show improved demand for large-cap stocks and reaffirm the risk-on thesis.
And what about the DOW? On a positive note, the Dow Jones Industrial Average held up pretty well in the face of Friday’s sell-off.
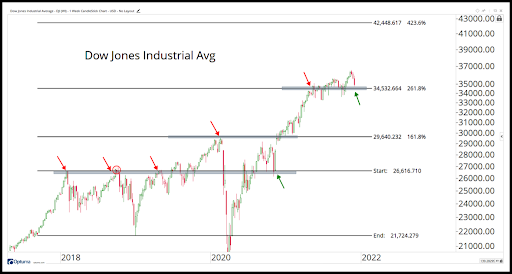
A hold above the 35000 level is the short-term line in the sand. A significant break below that level would indicate that even the biggest of the big are getting sold off – meaning risk-off is the prevailing theme.
So what’s the bond market telling us about stocks?
If stocks are getting sold off as part of the fear trade, that money is going somewhere. That somewhere is often a flight to the relative safety of Treasury Bonds…
That’s why we saw bond yields plunge on Friday. Bond prices rallied and the yield on the 10-Year Treasury moved sharply lower.
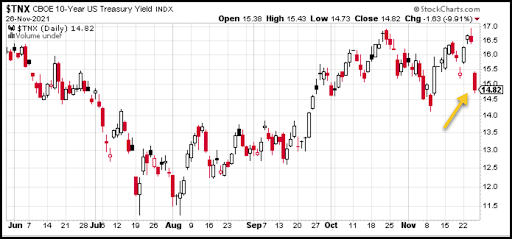
This is another area to watch over the coming days…
Will yields continue to fall as more and more investment capital flees the stock market in search of safer harbors or will the trend quickly reverse as money flows out of bonds and back to risk-on assets at what looks like bargain prices?
Well, Monday’s trading is a perfect example of what I mean… check out the same chart of TNX after Monday’s close.
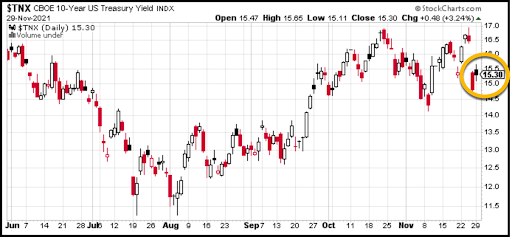
That’s a huge reversal in yields… it says institutional money – the money we track here at Rowe Wealth Management – is moving out of the safety of the bond market and back to growth assets.
Will it stick or is it just a temporary reversal?
What are we seeing on the sector level is what investors like you should keep in mind.
All 11 stock sectors lost ground during Friday’s sell-off. But which sectors are performing best can give us insight into how the biggest investors in the world feel about risk.
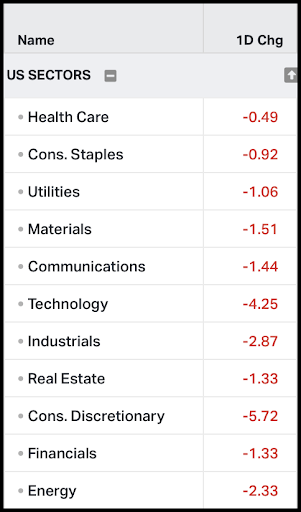
Friday’s market action saw defensive sectors like Healthcare, Consumer Staples, and Utilities hold up better than the more risk-on growth sectors.
While the growth sectors, Consumer Discretionaries, Technology, and Energy suffered the biggest losses.
As markets opened yesterday morning the question was: Will defensive sectors continue to lead as this market reassesses the prospects of future growth – or will the growth sectors reemerge as the leaders?
Here’s what sector performance looked at Monday’s close.
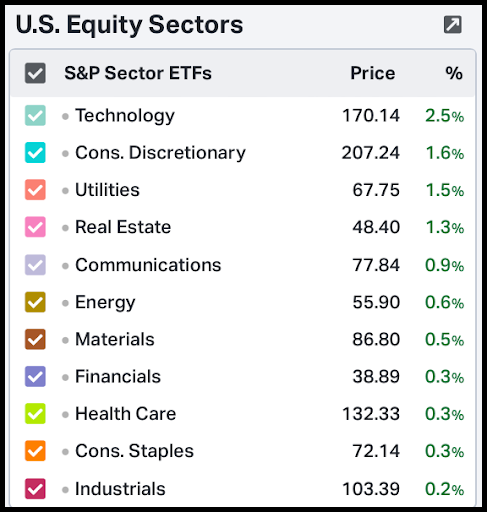
Technology and Consumer Discretionary stocks lead the market higher. These are the risk-on stocks that are growth leaders.
Interestingly enough, Utilities caught a bid, rising 1.5% on the day. Although Utilities are more defensive in nature, the reason they may have jumped today was the move from bonds back to equities – utility stock dividends replacing bond yields.
So, there you have it, some important areas for you to review as you navigate this week’s markets.
These are the same price charts we’ll be keeping a close eye on to interpret what’s happening at both the index and sector level for any clear signs of a directional bias – risk-on versus risk-off.
So stay tuned for more, and remember…
Follow the price action and always trade based on what is happening, not what might happen.
Until next week, invest wisely…

PS: Want these kinds of insights applied directly to your portfolio as they’re seen? To make the whole investment process easier, give us a call. We’re opening our doors to new investors who have portfolios valued over $500,000. If you’d like to schedule a free 1-hour consultation to review your portfolio, click here.
Tags

Get Our FREE Guide
How to Find the Best Advisor for You
Learn how to choose an advisor that has your best interests in mind. You'll also be subscribed to ADAPT, Avalon’s free newsletter with updates on our strongest performing investment models and market insights from a responsible money management perspective.
