
Related Blogs
December 7, 2021 | Michael Reilly
A week ago investors were sure the sky was falling…
Today, it’s investment euphoria as indexes stage a dramatic rebound from last week’s headline-driven sell-off.
A word to the wise… don’t let your emotions rule prudent decision-making.
Not everything is rosy. Slow down, breathe, and “read” the markets.
One way to measure the risk appetite of the market is the Stocks vs. Bonds Relative Strength Ratio.
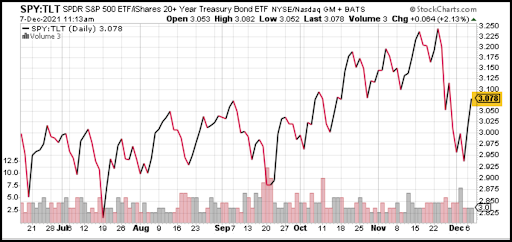
As part of last week’s ADAPT, I included a ratio chart comparing the S&P 500 to 20-Year Treasuries (SPY:TLT).
The value of this ratio chart to investors is in its simplicity. As investors, we always want to have the wind at our backs.
We can do that by understanding if stocks are stronger than bonds or bonds are stronger than stocks on a relative basis.
Think about the implications…
If bonds are stronger than stocks or stocks are weak relative to bonds, it’s happening in an investment environment where stocks (risk-on) are getting sold in favor of the relative safety of bonds (risk-off).
And if that is happening, ask yourself, is it prudent to load up on growth stocks? Probably not.
Last week I outlined our line in the sand and told investors a breakdown in the SPY/TLT ratio would be a warning to investors that the risk to stock ownership was increasing, and a more defensive posture may be warranted.
A quick look at the chart and we can see that stocks failed to hold and broke below our line in the sand.
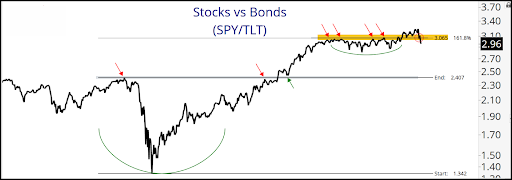
The question now is: Can stocks move back above that all-important 3.10 ratio or will they find themselves falling further vs. bonds?
If stocks can reclaim their upper bounds (highlighted), Relative Strength favors stocks and other risk assets over Treasury Bond ownership.
But if stocks fail here, bonds would be favored over them, and we could expect markets to come under further selling pressure.
If that environment persists, investors may want to think more defensively.
As of this morning, the SPY:TLT ratio sits right at that important 3.10 level.
We’ll have to wait and see if stocks can climb decisively above this level.
This is not a one-day event… it’s more of a process to be watched closely.
Until this ratio resolves, there is simply no directional edge between these asset classes over any significant timeframe.
So what else might investors look to for clues this week? All eyes are on interest rates.
If you want to know what’s happening in the stock market, keep an eye on the largest market in the world – the bond market.
The 30-year Treasury Yield has been falling recently.
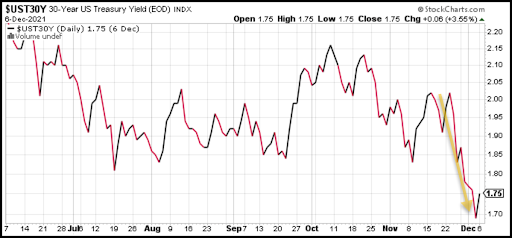
Remember, yields fall as bond prices rise – the result of bond buying. Treasury Bond buying is a risk-off maneuver. Investment capital shifting out of stocks and into the relative safety of Treasury bonds.
The shorter end of the curve, the 5-Year, has remained more resilient.
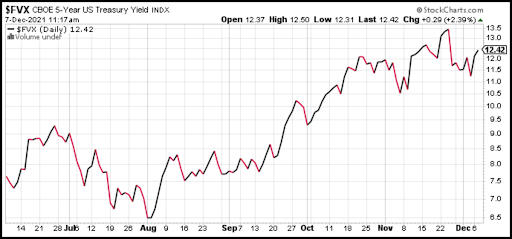
This is leading to a contraction in treasury spreads (the difference between the yields).
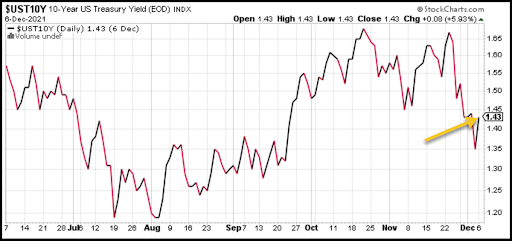
As the yield curve begins to flatten, look in the middle for clues – the 10-Year.
The direction of the 10-Year Treasury accounts for what is perceived to happen in the markets over the following weeks and months, so it’s a gauge investors will want to watch.
Our line in the sand for the 10-Year Yield has been and remains 1.40.
So, If the 10-Year decisively breaks the 1.40 level and follows the 30-year lower, then the prospect for economic growth diminishes.
That would put a major dent in the global growth and reflation trade narratives and could trigger further selling of stocks.
However, taking the bullish outlook, if the 10-Year can hold above 1.40 and begin trending higher, we’re most likely talking about commodities and cyclical stocks getting back on track.
Whichever direction the 10-Year goes from here will give us an indication of where the rest of the market is headed. Bulls are hoping it follows the 5-Year and not the 30-Year.
As of this morning (Tuesday), the 10-Year is back above 1.40 (barely), but it’s a positive development in what has been a volatile market.
The market is still sending a lot of mixed messages to investors and I wouldn’t say we’re out of the woods just yet.
And until we are, these are just a few of the ratios we’ll keep a close eye on.
Until next week, invest wisely…

PS: Want these kinds of insights applied directly to your portfolio as we see them? To make the whole investment process easier, give us a call. We’re opening our doors to new investors who have portfolios valued over $500,000. If you’d like to schedule a free 1-hour consultation to review your portfolio, click here.
Tags

Get Our FREE Guide
How to Find the Best Advisor for You
Learn how to choose an advisor that has your best interests in mind. You'll also be subscribed to ADAPT, Avalon’s free newsletter with updates on our strongest performing investment models and market insights from a responsible money management perspective.
