
Related Blogs
July 16, 2019 | Michael Reilly
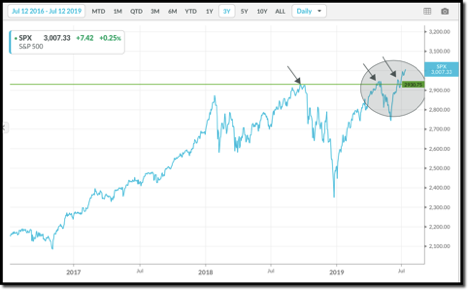
U.S. equity markets wrapped up the quarter with a bang as the S&P 500 had its second-best June in the modern era (since 1950) gaining more than 7% during the month. This has given the index a total return of more than 18% through the first half of the year, up 18.32% as of July 16, 2019.

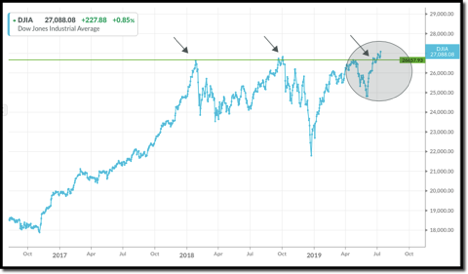
At the same time, the DJIA gained 14.03% thru June 28, 2019 and is up 15.26% as of today (July 16, 2019).
Both the S&P 500 and the DJIA broke above key resistance levels, at their respective 2018 highs.
But with the S&P 500 and DJIA moving into record territory during the first half of the year, many investors may be wondering if U.S. stocks have anything left in the tank.
Like “old faithful” at Yellowstone Park, we have a reliable tool to help answer that question….
If you really want to know how the true “market” is doing, you won’t find the answers by watching your favorite financial news commentator or by listening to all the hype around the S&P 500 or the DJIA hitting these new intraday and closing highs.
The indices don’t tell the whole truth, because the indices are either price weighted or cap weighted – truth be told, they’re a bit of an illusion, but that’s a story for another day.
If you really want to know how the “true markets” are doing, look to market internals.
And one of our favorite barometers for gauging market conditions is the NYSE BPI or Bullish Percent Index.
For those readers not familiar with the NYSE BPI, it’s a great tool for determining the amount of participation in the market.
The NYSE-BPI can help define a market that is overbought and at risk of a reversal (leading to lower stock prices), if the market is oversold as it was coming into January 2019 (signaling potential upside in the future), or if market conditions are right for continued upside – as they appear now.
When the chart moves above 70 (red line, below) it’s an indication of an overbought market. Not that it can’t go higher, just that there is more risk of a reversal from these high levels.
Think of it this way, when a market reaches these lofty overbought conditions, there has already been a lot of buying of stocks.
And if that’s the case, then at some point all the buying that is going to happen – has already happened.
It’s a like a roaring fire, it will continue to burn hot and bright as long as it is fueled with something flammable. But stop fueling the fire and eventually it will fade away to a few smoldering embers.
That’s how the stock market works too, fuel it with capital… continue buying more and more stocks, and prices will continue to rise…
That is, until there is no more money available at current prices (the fuel). That’s when we see prices slip and reverse down.
NYSE BPI
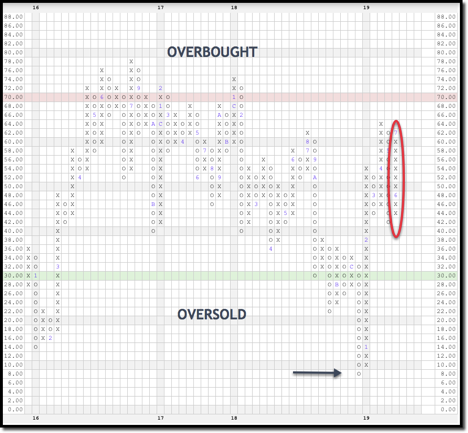
The column of “x’s” circled in red at the far right of the chart represents the most current market action. The x’s indicate strong demand, buying, which is driving prices higher.
The 62 is what we refer to as filed position. And it’s important, because we want to know if we’re looking at a market that is overbought (70 and above) oversold (30 or below) or someplace in the middle.
Obviously, we cannot know how the second half of this year will turn out.
But by viewing the market from a different lens – that of market internals – like the NYSE BPI, rather than market externals – the S&P 500 or DJIA, investors like you can often gain an important and potentially profitable edge over those who aren’t “in the know.”
Like the U.S. women’s national soccer team – who just one their second consecutive World Cup title, U.S. equities continue to reign supreme heading into the third quarter, as it is the top-ranked asset class from a relative strength perspective.
It’s always best to put the wind at your back and not buck the trend. So if you’re looking to add capital to one of the six major asset classes – U.S. equities are a strong contender!
As an individual investor, knowing which indicators are strong market predictors (like the NYSE BPI) can be a powerful tool. If you make a habit of checking these indicators regularly, you’ll start to see market patterns much faster than investors who simply read headlines and watch the market averages.
Of course, if this sounds like more work than you’d like to do, you may want to look into hiring the services of a money manager. Here at Rowe Wealth, our advisory team monitors indicators like the NYSE BPI (and many others) in order to balance our clients portfolios, maximize profit potential, and keep risk at comfortable levels.
If this sounds like something you may be interested in, we offer free portfolio evaluations to investors with portfolios of at least $500,000. This completely free assessment will allow you to quickly gain an accurate understanding of how much money you are likely to gain or lose over the next six months, as well as identify areas of weakness that can be adjusted to increase profit potential and reduce risk,
Click here to see available appointment times.
Until next week. Invest wisely…
Tags

Get Our FREE Guide
How to Find the Best Advisor for You
Learn how to choose an advisor that has your best interests in mind. You'll also be subscribed to ADAPT, Avalon’s free newsletter with updates on our strongest performing investment models and market insights from a responsible money management perspective.
