
Related Blogs
January 13, 2022 | Avalon Team
 Last week I introduced the idea that the traditional 60/40 Portfolio, a common approach among investors, was no longer going to serve investors as intended in the coming years.
But in order to understand the future, we must first understand the past…
Model portfolios that adhere to a specific asset allocation have often been used by investors because of their ease of implementation.
The 60/40 Portfolio consists of 60% allocation to diversified equities and a 40% allocation to a broad basket of bonds.
The reason many people will invest in both stocks and bonds is that they are often non-correlated, meaning, stocks often zig while bonds zag.
While the relationship isn’t constant, combining two or more non-correlated assets into a portfolio results in a better portfolio than just either alone.
Due to the imperfect correlations between stock and bond returns historically, the 60/40 model has enjoyed decades of success at providing investors with strong absolute returns and suitable protection in a down market.
Historical returns
Dating back to 1926, the 60/40 Portfolio has enjoyed an annualized return of 9.1%. Its best year (1993) saw returns of 36.7%, while its worst year (1931) experienced a loss of 26.6%.
Over those 95 years, only 22 years saw the portfolio decline in value. The returns combined with relative stability have made the balanced portfolio ideal for retirees.
In fact, it has been cited that the concept of the 4% safe withdrawal rate can be attributed to studies done using portfolios similar to the 60/40.
The problem with long-term annualized returns is that they mask shorter periods where market returns can be less meaningful. By definition, for there to be an “average” there must be returns both above and below the average.
While recent returns have fared even better, with an annualized return of 11.1% during the past decade, it should be noted that the strategy does display sensitivity to starting equity valuations and economic regime changes.
For instance, during the “Lost Decade,” the period between 2000 and 2009, the strategy provided a much lower annualized return of 2.3% (before inflation).
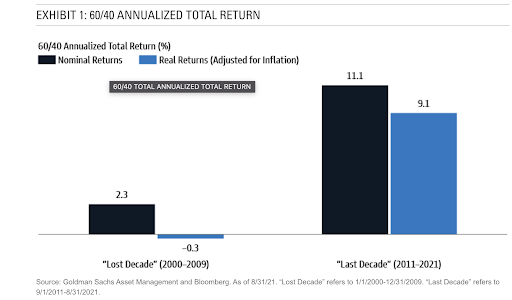
This period was characterized by high starting stock valuations, the dot.com bubble and crash, and finally the real-estate and credit crash.
During this period, an investor attempting to supplement living expenses from their portfolio by liquidating 4% a year would have eaten into principal well before the next decade of higher returns was experienced.
It’s worth pointing out that as investors we don’t get to choose the sequence of returns that we experience. More commonly referred to as “sequence risk,” a degree of luck is involved.
For instance, a person who retired in 1982 (right before the single greatest period of annualized returns) had a much better experience than another person who may have retired in 2000, right before “the lost decade,” all else being equal.
You might say there is luck in the stars because often this important factor is determined by when you are born!
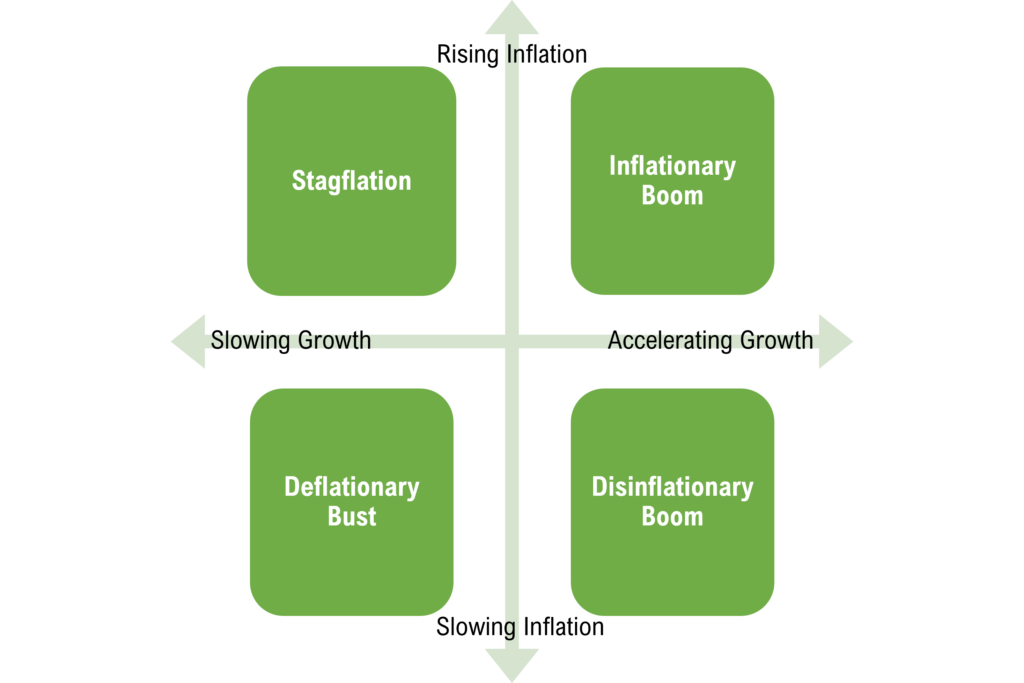
You may be asking yourself what I mean by the term economic regime. As a simple example, imagine that the global economy is defined by four regimes, each of which combines a growth axis with an inflation axis.
A period of accelerating growth in combination with rising inflation might be termed an inflationary boom, while a combination of accelerating growth with falling inflation might represent a disinflationary boom.
On the other side of the axis, a period of slowing growth, combined with rising inflation, is often termed stagflation, while a period of decelerating growth concurrent with falling inflation is a deflationary bust.
One of the problems with the ubiquitous 60/40 Portfolio is that it is really only suited to one of the four economic regimes that an investor is likely to experience over a typical long-term investment horizon.
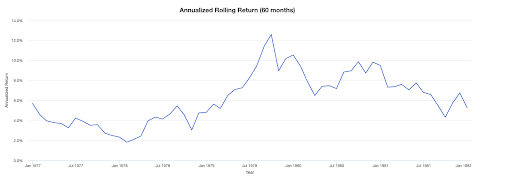
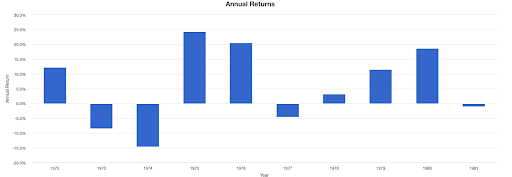
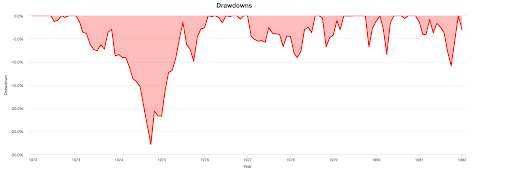
While it flourished in the disinflationary growth period experienced from 1981-2000, a 60/40 Portfolio proved relatively ineffective during the stagflationary regime of the 1970s as demonstrated below.
The average annual return during the 1970s was 6.12% before inflation (and included one large drawdown of nearly 28% between 1973-1974).
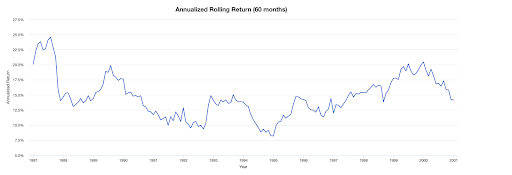
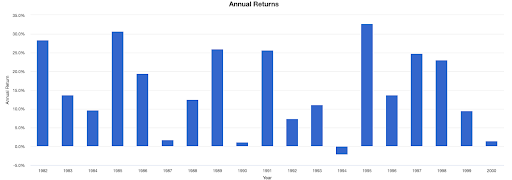
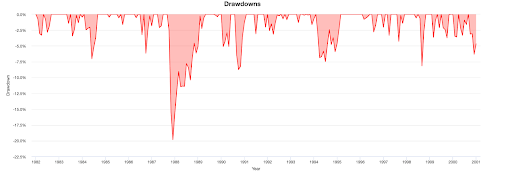
During the period 1982 -2000, the portfolio’s average annualized return was 15% and included only one negative year.
Why did this strategy perform so well in the 1980s but not the 1970s?
Simply, interest rates respond predictably to inflation. When inflation is expected to decline, interest rates will soon follow, which causes bond prices to rise.
From 1981 to 2000, we experienced falling inflation, falling interest rates, and economic growth. Hence, an allocation toward fixed income and equities performed quite well because both were rising at the same time.
Bonds like declining inflation, while stocks like benign inflation and strong growth.
When considering any investment strategy it is critical to consider the economic regime in which the strategy will be operating. No investment exists in a vacuum and will be influenced by a myriad of market forces.
Thus, when choosing an investment strategy it is extremely important to consider both the current and expected economic regime.
Next week, we’ll take a deeper look into the equity component of the 60/40 Portfolio, providing both analyses of historical returns and reviewing what current stock market valuations say about expected future returns.
If you have any questions or have been considering hiring an advisor, then schedule a free consultation with one of our advisors today. There’s no risk or obligation—let's just talk.
Tags

Free Guide: How to Find the Best Advisor for You
Get our absolutely free guide that covers different types of advisory services you'll encounter, differences between RIAs and broker-dealers, questions you’ll want to ask when interviewing advisors, and data any good financial advisor should know about you and your portfolio.
