
Related Blogs
February 12, 2024 | Avalon Team
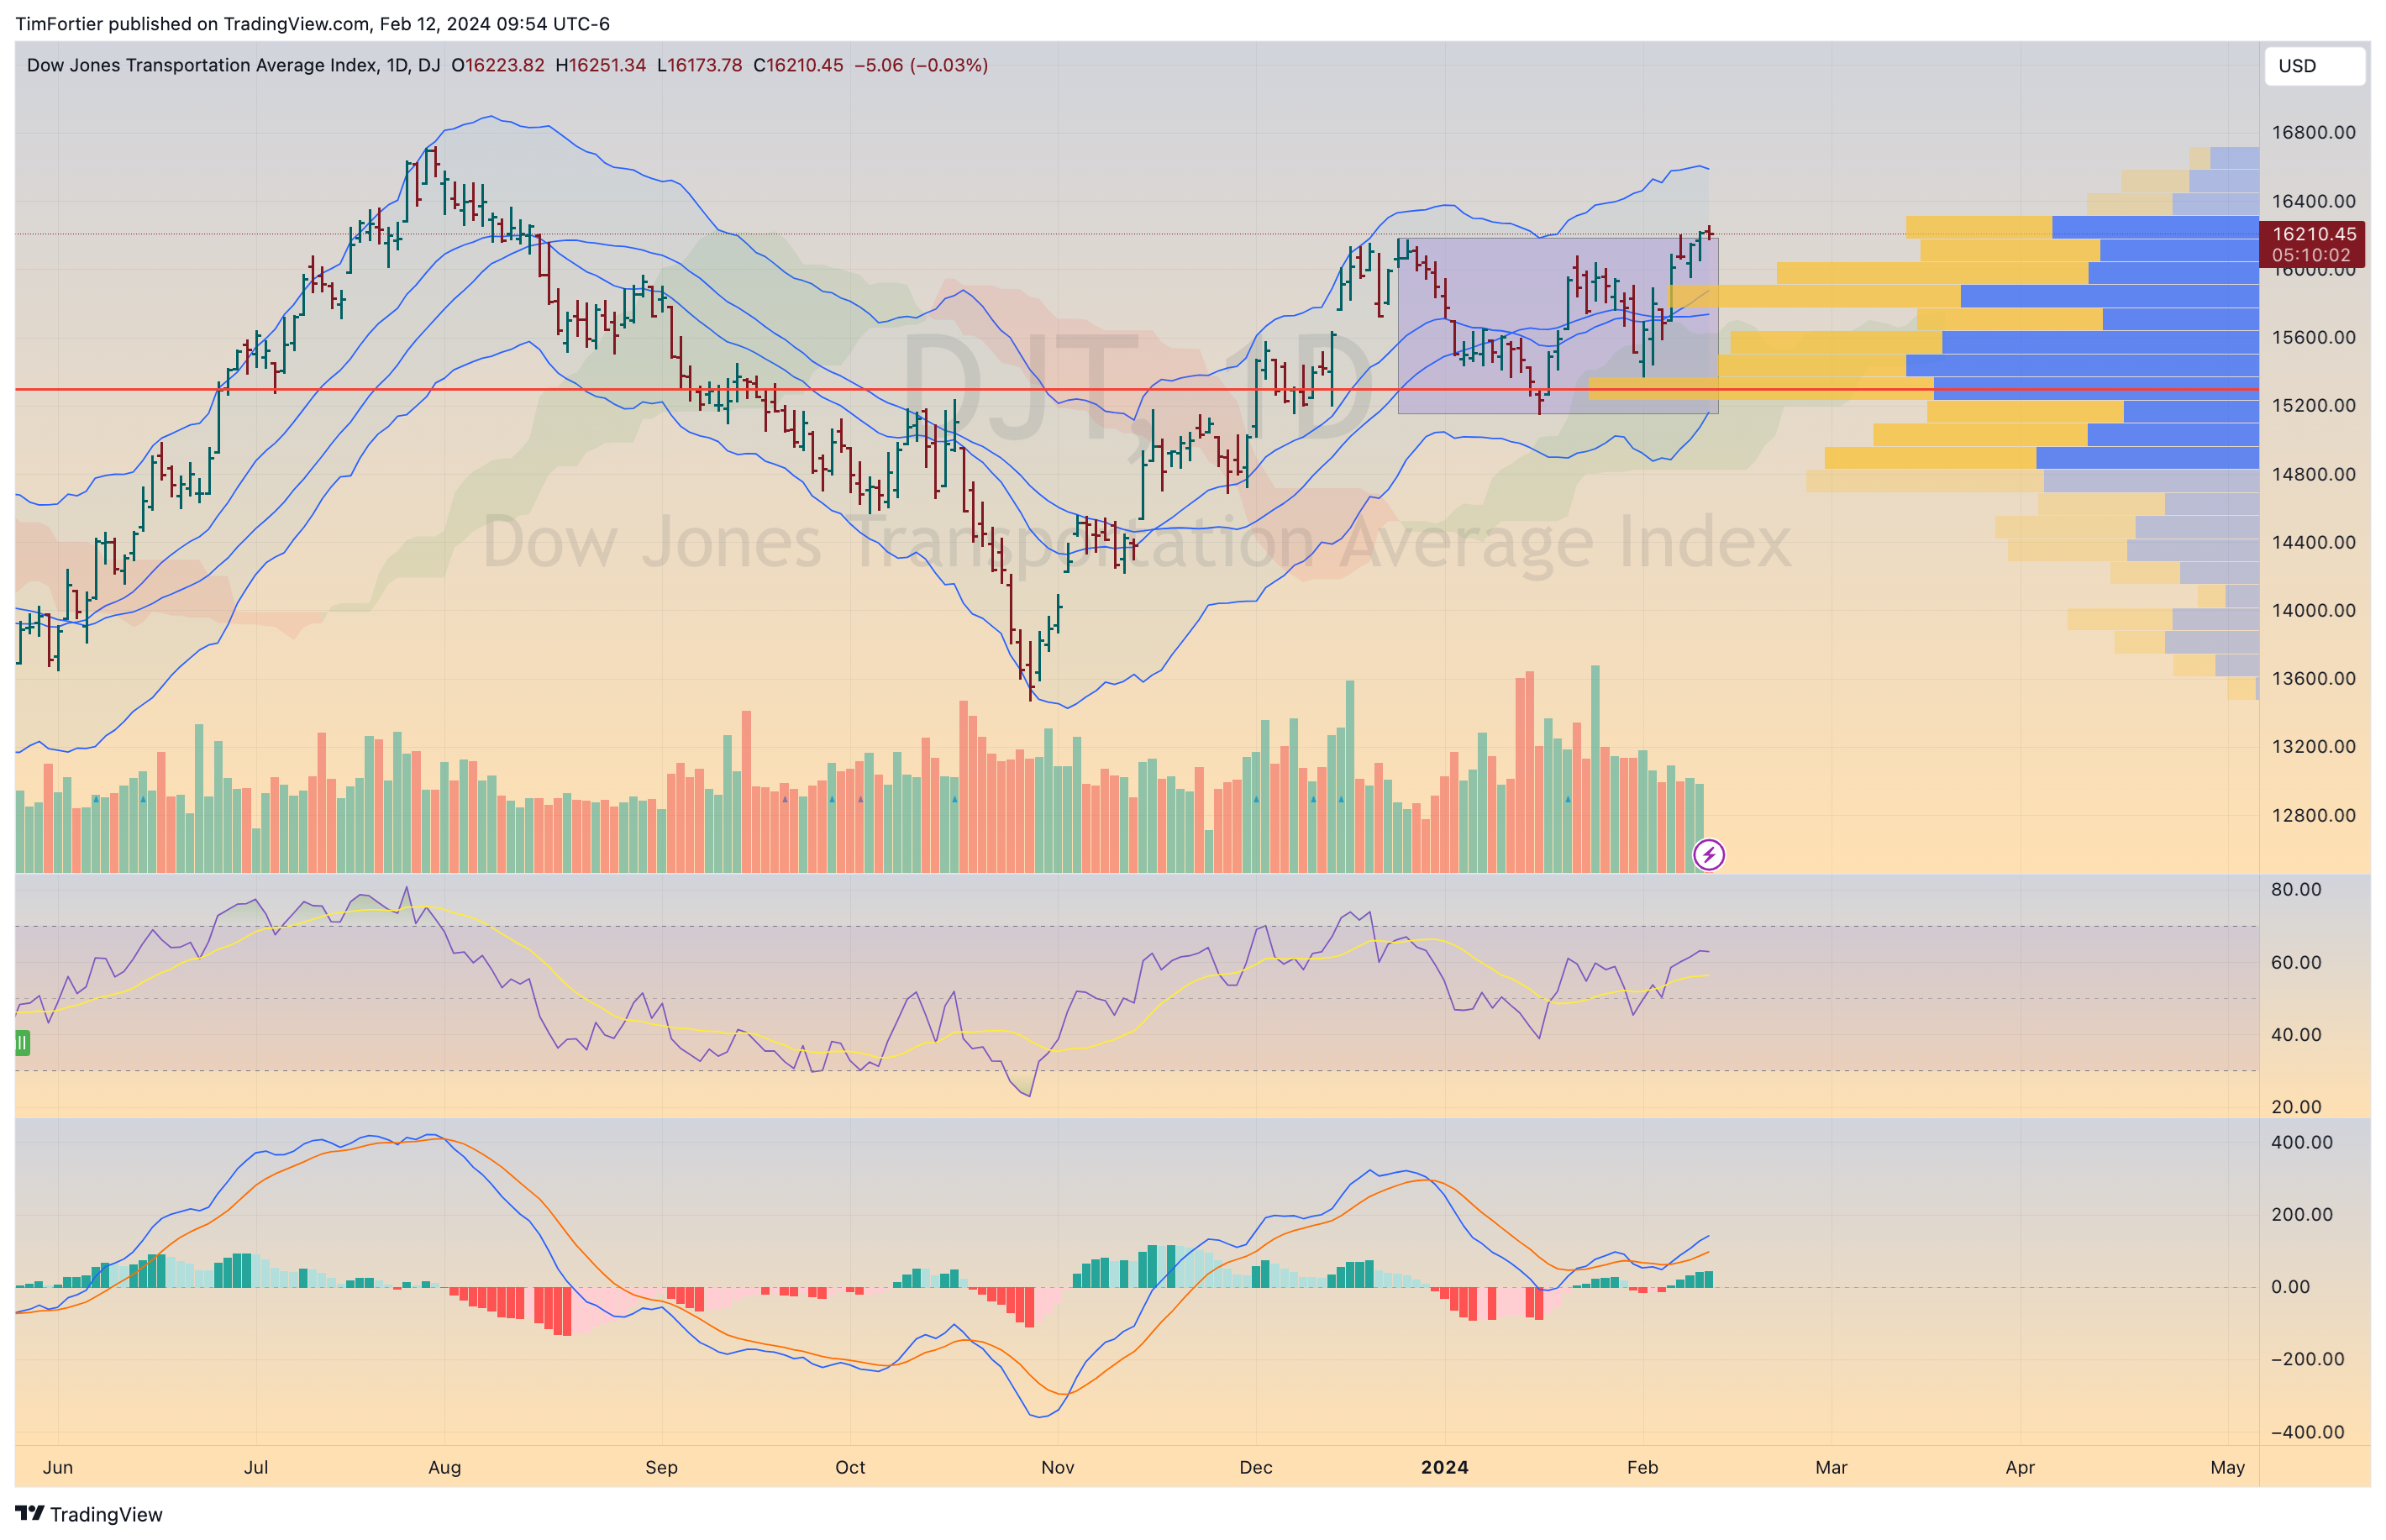
More upside to come? Or too late to the party? The classical Dow Theory triggered a Buy signal on 2/8/24 when the Dow Transportation finally surpassed its 12/19/23 highs.
What is the Dow Theory?
Tracing its origin back to the early 1900s, the Dow Theory was first postulated by Charles Dow in 1901.
Dow believed that the stock market as a whole was a reliable measure of overall business conditions within the economy and that by analyzing the overall market, one could accurately gauge those conditions and identify the direction of significant market trends and the likely direction individual stocks would take.
The work of Charles Dow, who died in 1902, was further expanded upon by William P. Hamilton’s The Stock Market Barometer (1922), Robert Rhea’s The Dow Theory (1932), and Richard Russell’s The Dow Theory Today (1961).
Besides defining the trend of the market, one of the basic tenets of Dow Theory is that indices or market averages must confirm each other. This means that the signals on one index must match or correspond with the signals on the other.
If one index, such as the Dow Jones Industrial Average, shows a new primary uptrend, but another remains in a primary downward trend, traders should not assume that a new trend has begun.
Dow used the two indices that he and his partners invented, the Dow Jones Industrial Average (DJIA) and the Dow Jones Transportation Average (DJTA), on the assumption that if business conditions were healthy—as a rise in the DJIA might suggest—the railroads would be profiting from moving the freight this business activity required; thus, the DJTA would also be rising.
Despite being over a century old, Dow Theory remains relevant in today’s high-tech, global markets. Traders worldwide still use its principles to gauge the health of the market and identify potential trading opportunities.
Which brings us back to last Thursday when the DJT confirmed the DJI and joined the party of other indices already in an uptrend.
Critics of the theory cite that by the time a trend is confirmed, a significant portion of the price move may have already occurred, reducing the effectiveness for traders seeking timely entry or exit points.
Critics also argue that this focus on a limited number of stocks may not accurately represent the entire market or specific sectors.
Despite these concerns, one thing remains true:
A trend is assumed to be in effect until it gives definite signals that it has reversed. This tenet forms much of the foundation of modern trend-following approaches.
For market bulls, the current market is showing some improvement from the perspective of trend, as more indices are showing improvement.
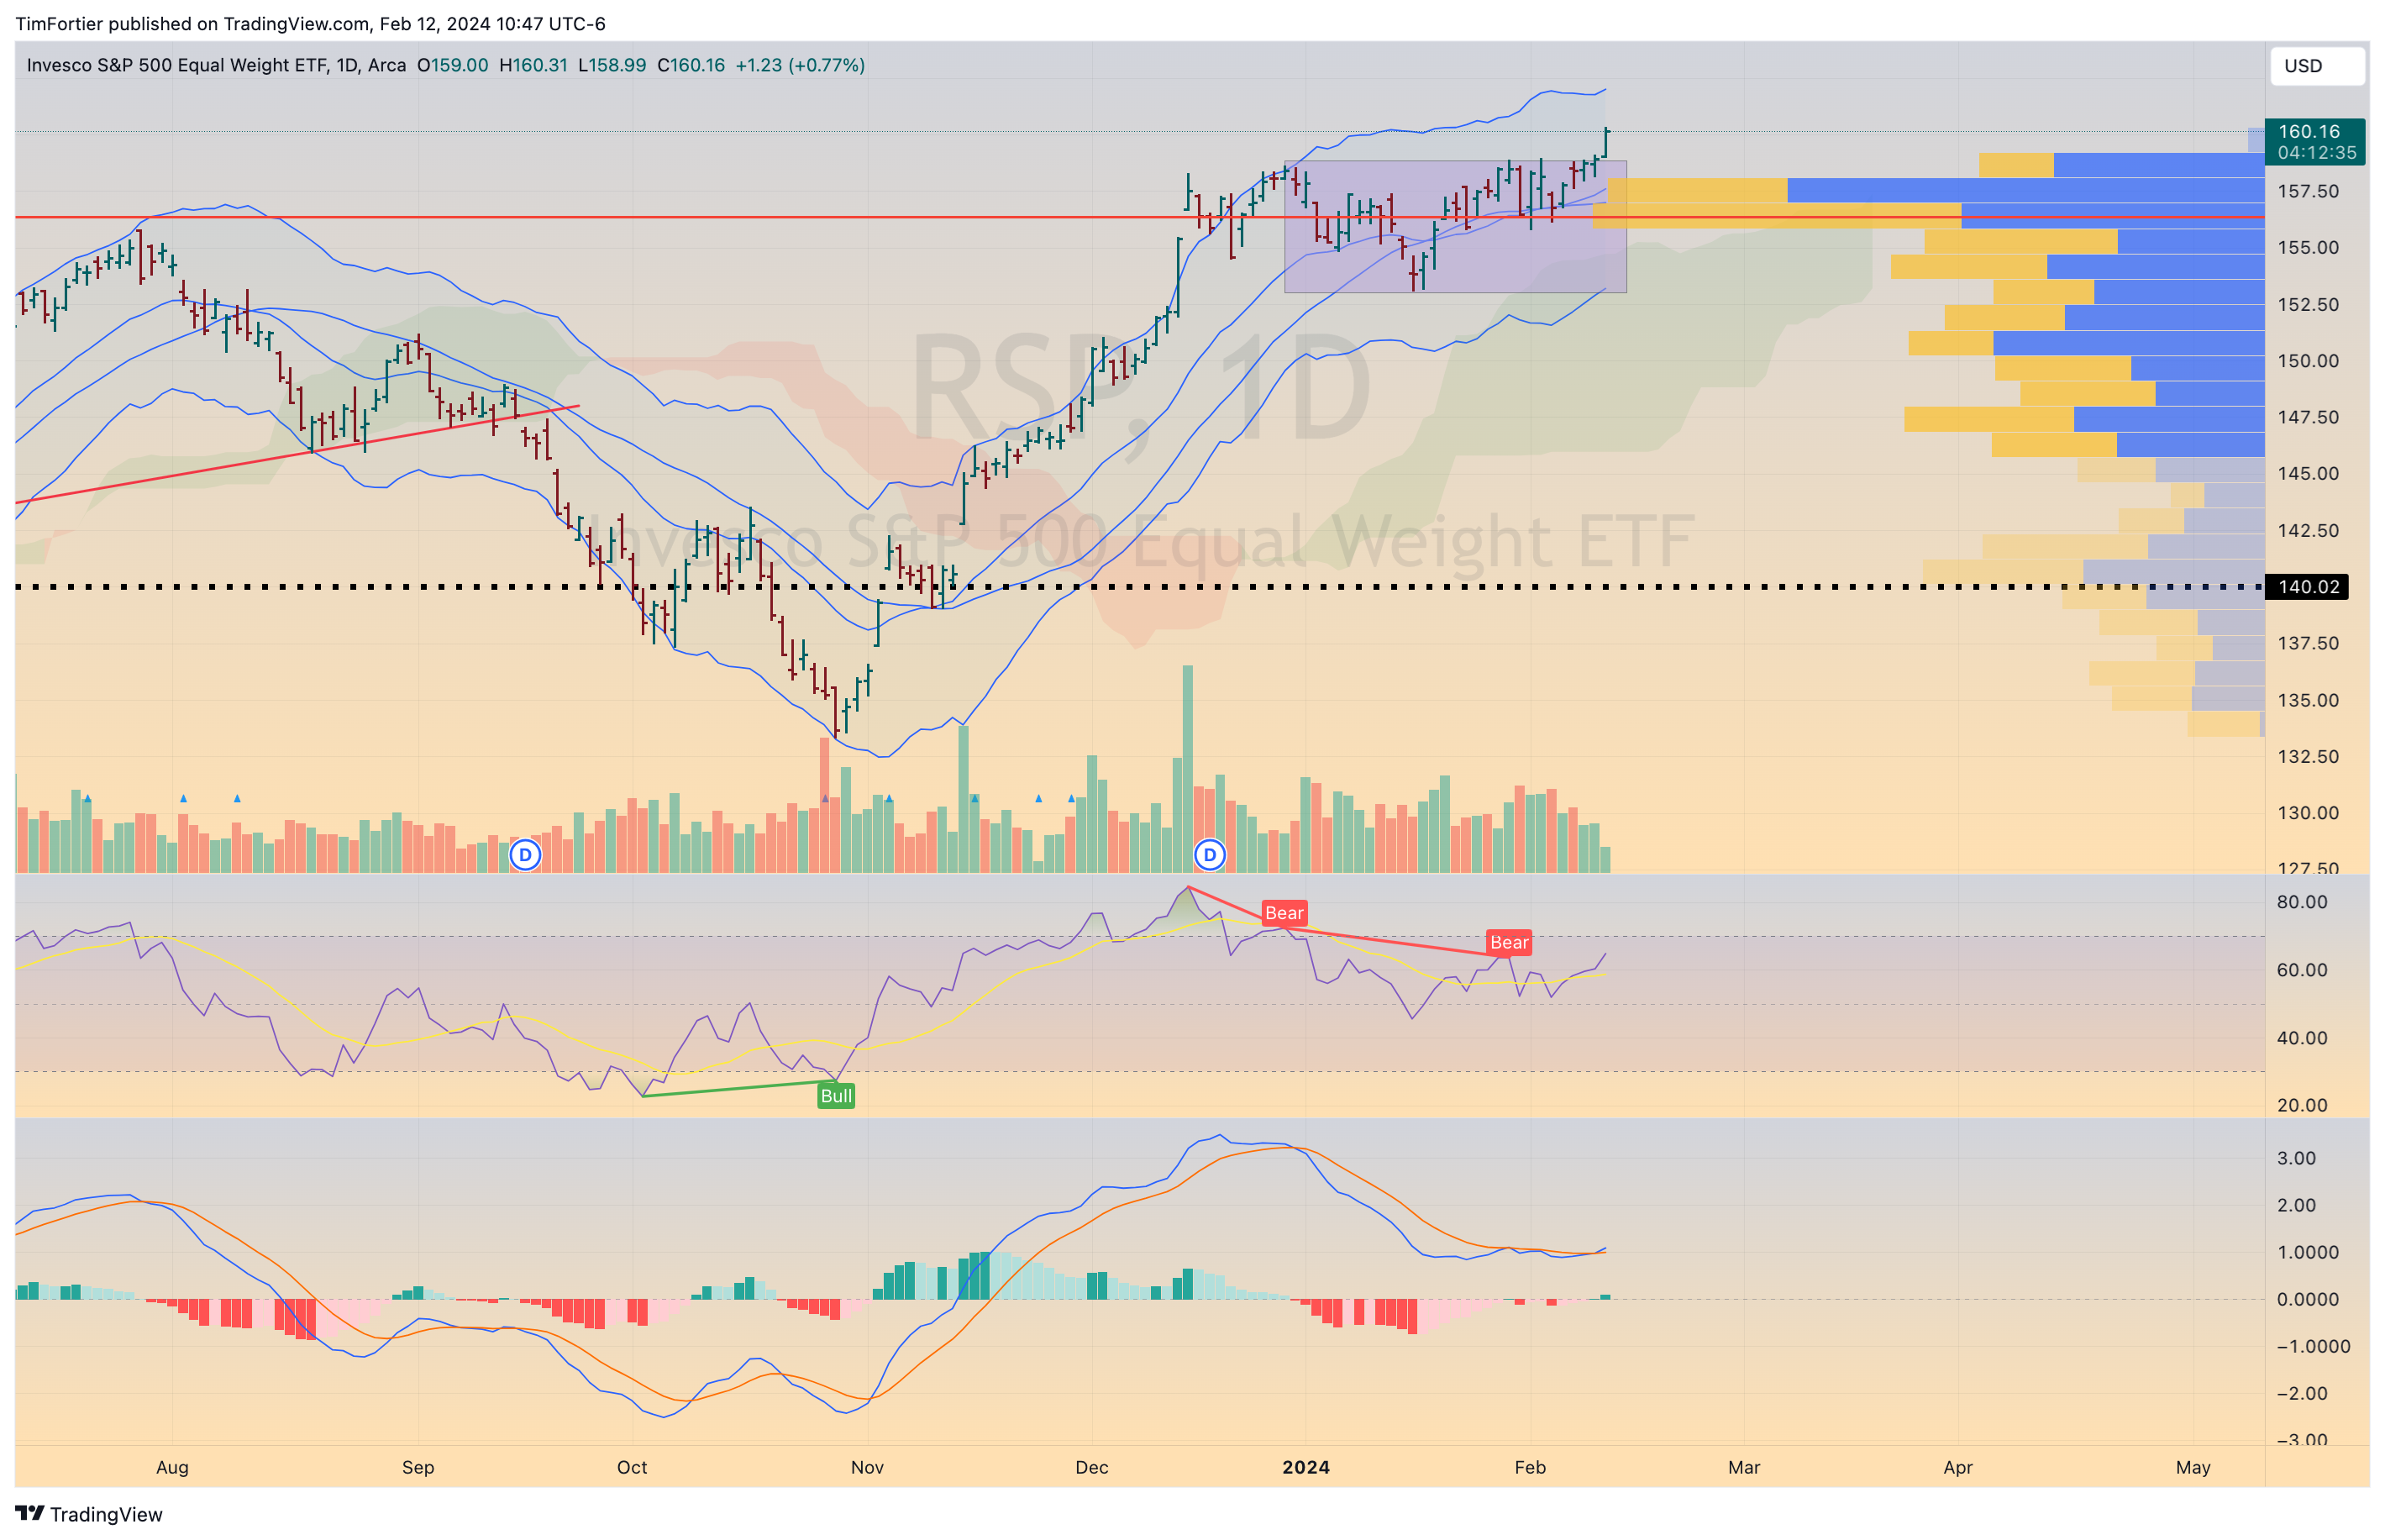
For instance, today, the equal-weight S&P 500 is breaking out of a consolidation it has been in since the beginning of the year.
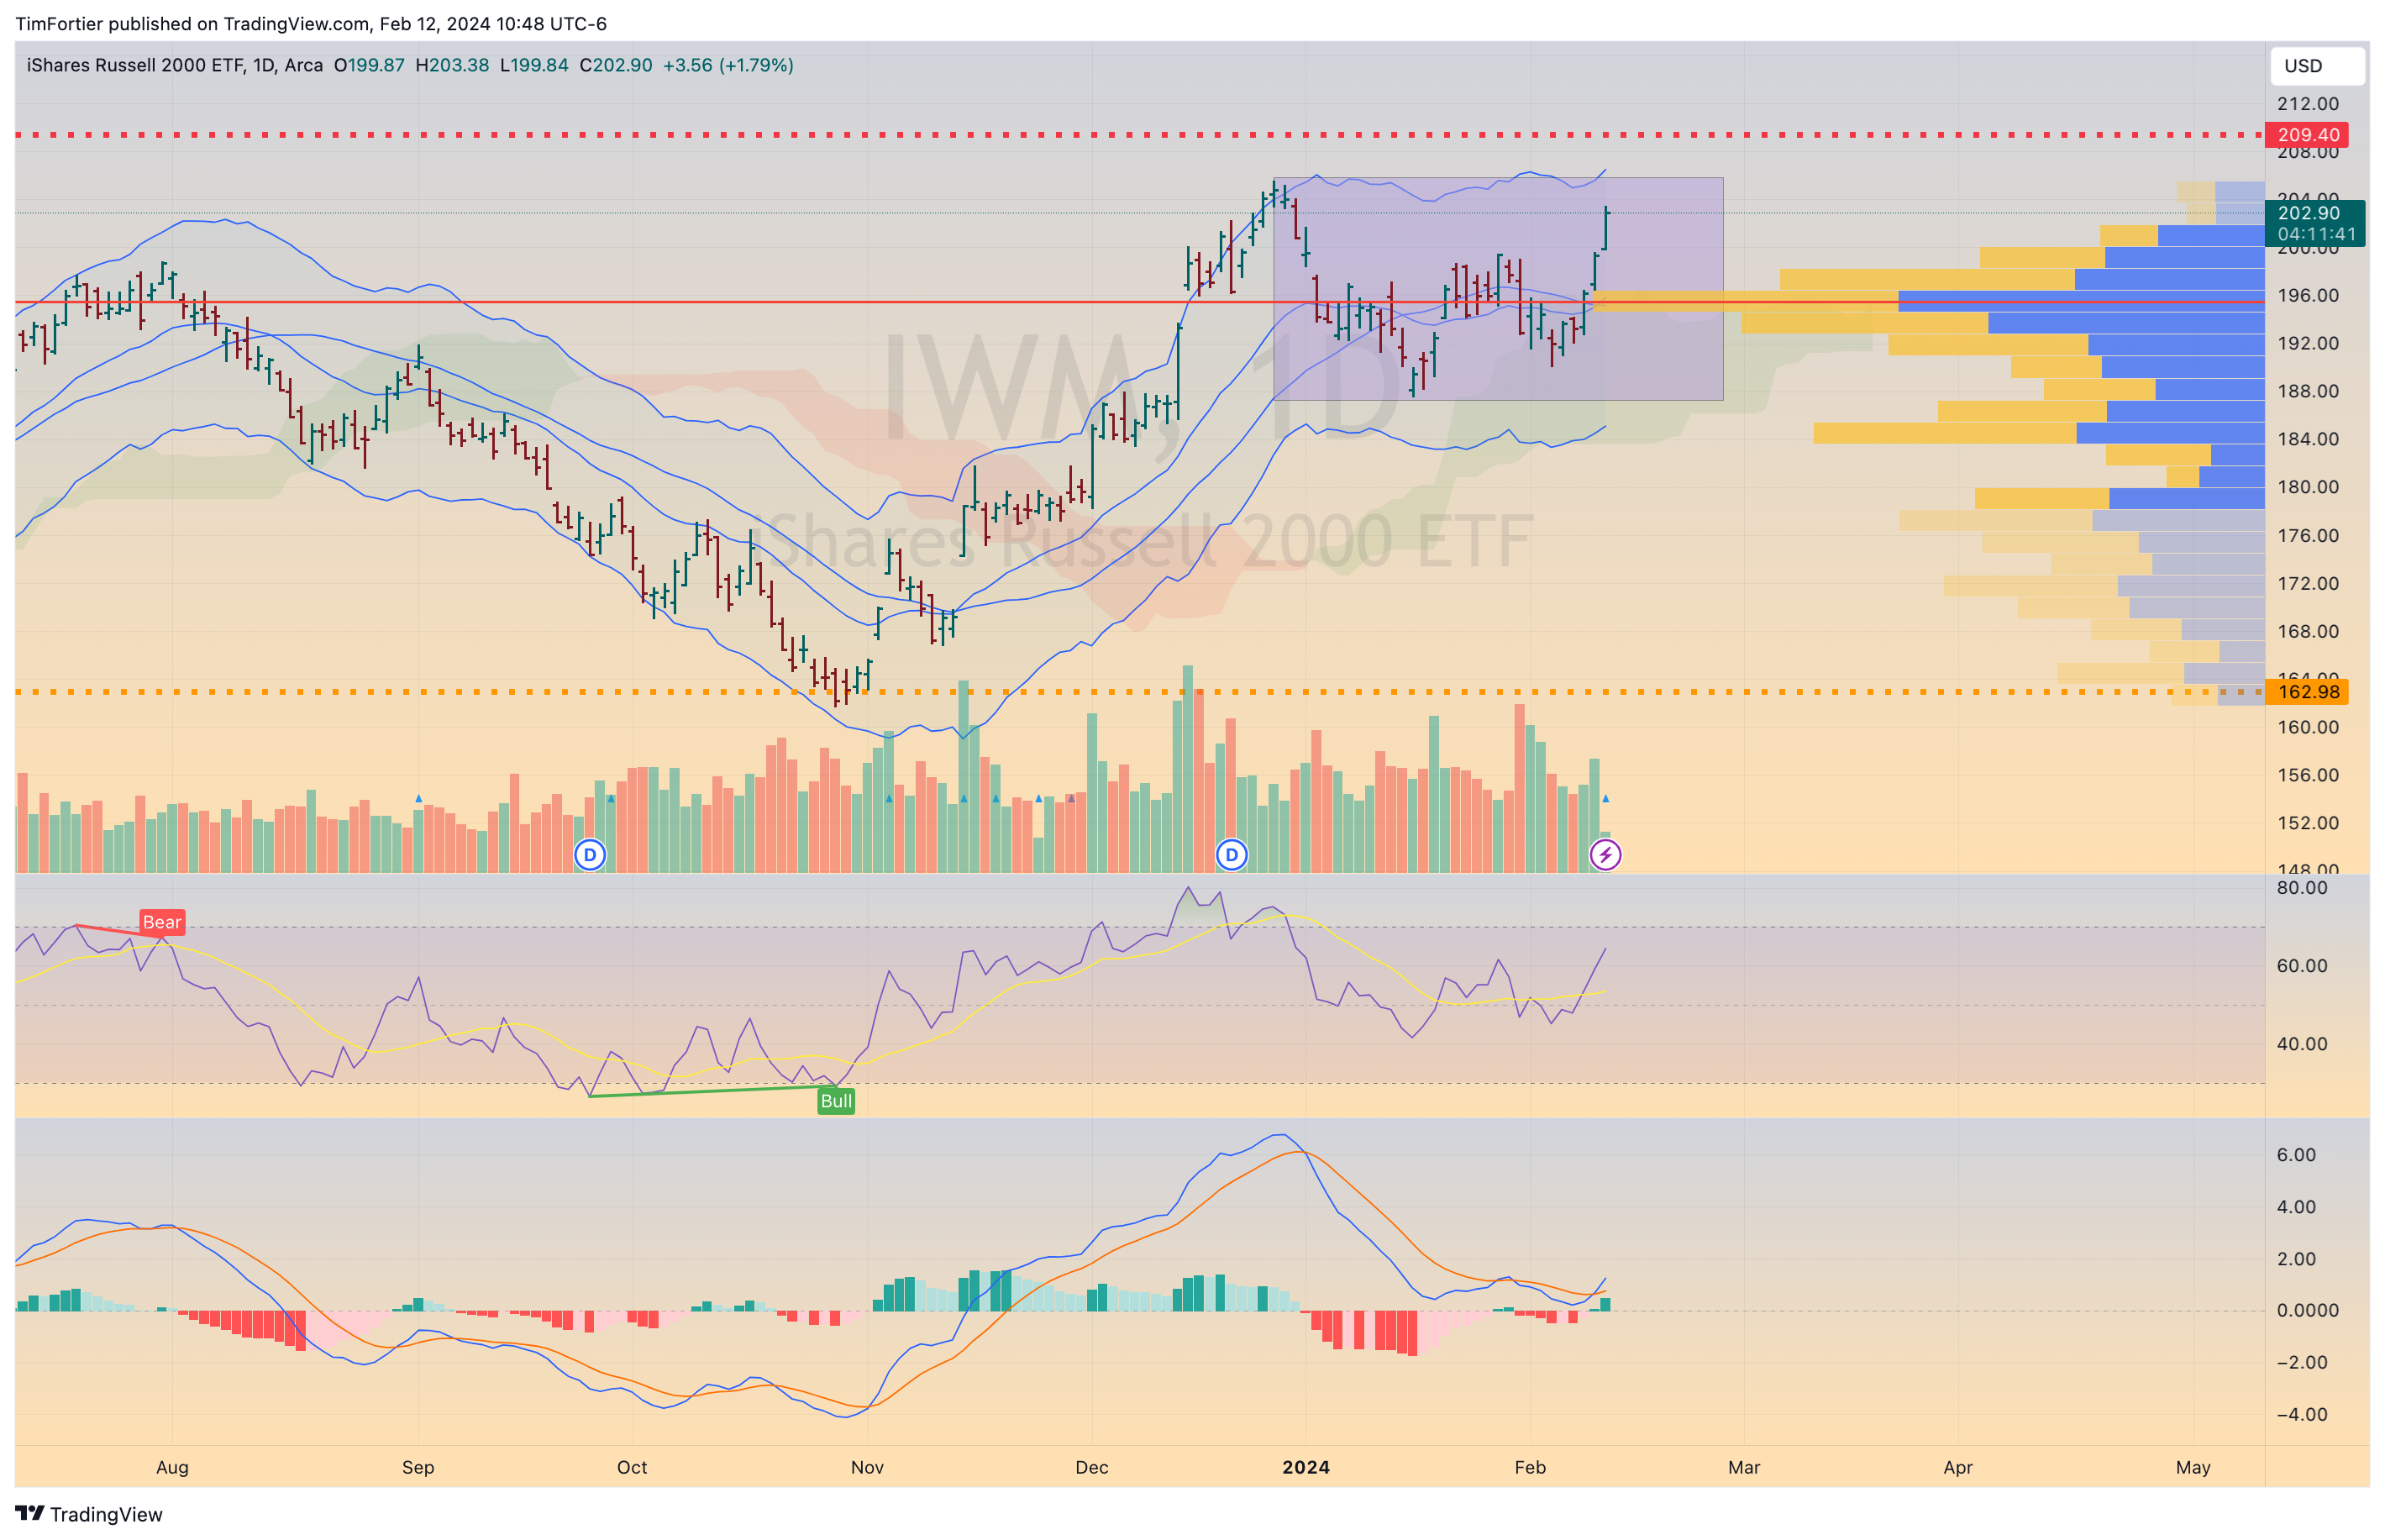
And small-caps, which have lagged the broader market the most, are making a run at their recent high.
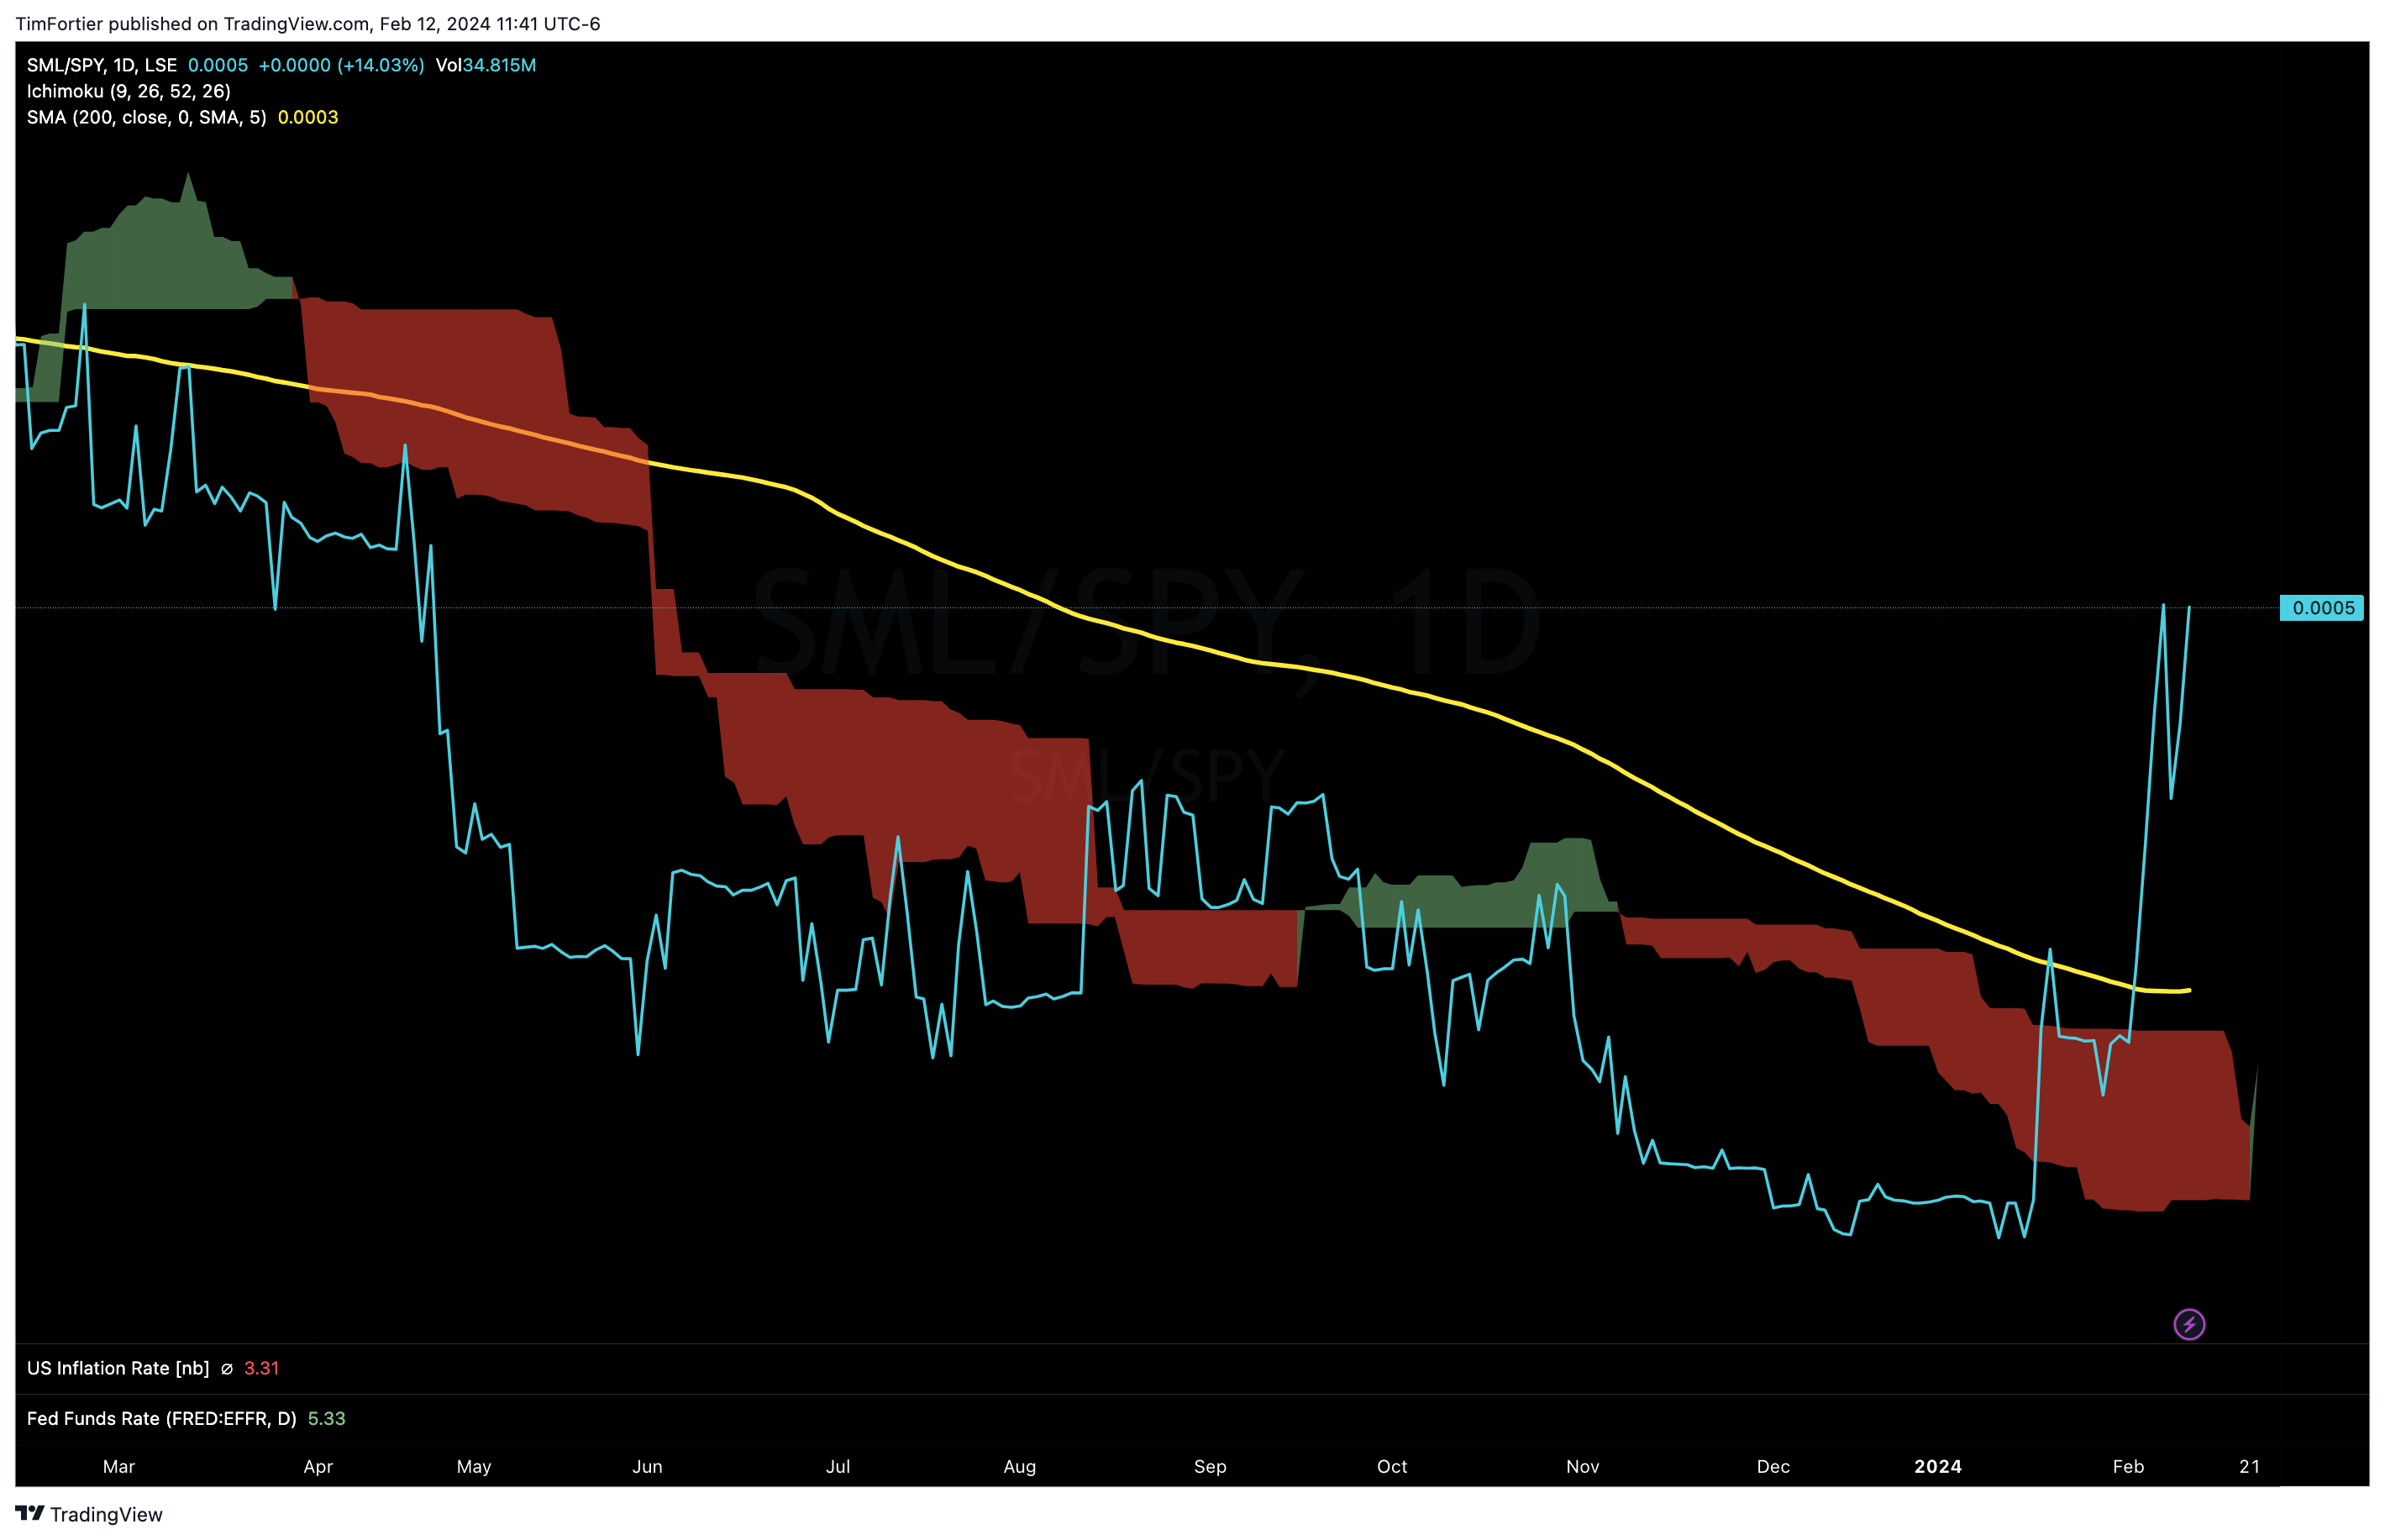
Another encouraging sign is that small caps relative to large caps are showing a recent surge in relative performance as this chart demonstrates.
A broadening of the trend would be a welcome relief for many, as one of the most cited concerns for the current stock market rally is the weak market breadth.
The S&P 500’s current rally is being driven by an incredibly small number of stocks, and that has some folks convinced that this narrow “market breadth” is a big warning sign.
And it’s not hard to see their point.
A wider market breadth – which would have more of the index’s 500 stocks rising at once – would make the rally seem altogether more sustainable. It would suggest that more industries and businesses are doing well, implying greater confidence in the economy. It would also mean that the market is less vulnerable to the ups and downs of just a few companies.
With just 26% of stocks outperforming the broader index, the breadth is at a low that’s rarely been seen before (bottom half of the chart).
In fact, the last two times leadership was this narrow were in the Nifty 50 period of the 1970s and during the dotcom boom of the late 1990s.
In those cases, stocks did continue to rise for a while. But it eventually ended in tears with stock prices dropping 50%.
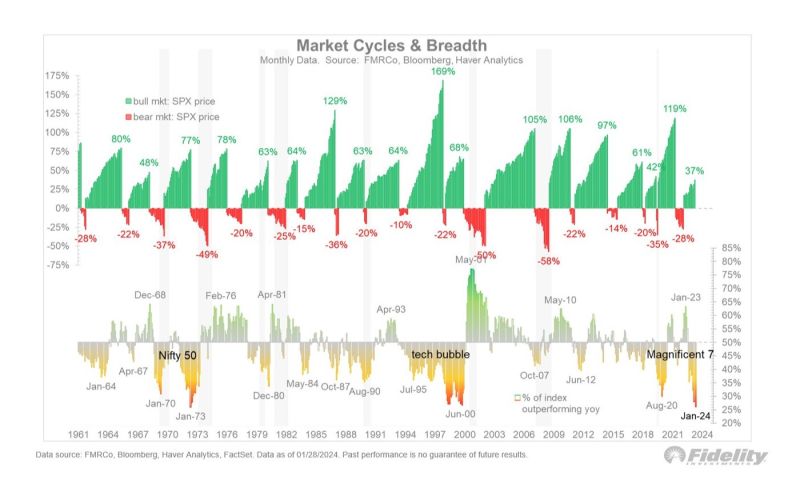
The industry curve has also yet to reflect any improvement with only 40% of the curve currently bullish.

Ideally, this begins to show some signs of improvement to better align with the signal coming from the Dow Theory.
While modern markets are much different than when the Dow Theory was originally founded, the basic tenets of trend following remain true today. Currently, the price trend of many of the popular stock market averages are in favorable positive trends, despite the noted concerns.
Charles Dow had once compared the markets to that of the tide. Currently, the tide is still rising – is it strong enough to lift more boats?
If you’re thinking about hiring a financial advisor to navigate the ever-changing markets, schedule a free consultation with one of our experienced team members. There’s no risk in exploring if we’re the right fit for your financial goals. Contact us today.
If you have any questions or have been considering hiring an advisor, then schedule a free consultation with one of our advisors today. There’s no risk or obligation—let's just talk.
Tags

Free Guide: How to Find the Best Advisor for You
Get our absolutely free guide that covers different types of advisory services you'll encounter, differences between RIAs and broker-dealers, questions you’ll want to ask when interviewing advisors, and data any good financial advisor should know about you and your portfolio.
