
Related Blogs
April 26, 2022 | Avalon Team
 Here’s what sector performance looks like right now:
- Consumer Discretionaries (XLY) is down -13.2%.
- Technology (XLK) is down -16.32%.
- Communications Services (XLC) is off by -19.78% year-to-date…
And it’s still only April! Think about this for a minute…
These three sectors XLY, XLK, and XLC account for two-thirds of the market cap of the S&P 500, and collectively they have lost -16.43% on average…
The performance of these three goes a long way in determining the overall direction of the S&P 500 index.
The S&P 500 is a large-cap growth index led by Technology, Communications, and Consumer Discretionaries. These are the growth trades of the S&P. The problem is they’re not very growthy right now.
Not to say “we told ya so,” but we’ve been pounding the table for the last six months about the rotation out of growth and into value. No, we didn’t have a crystal ball or some kind of magic spell…
Instead, we understand how to interpret the very charts and indicators we’re sharing with you every week.
The narrative of value over growth or defense over offense hasn’t changed. That’s very clear in sector performance.
Energy, Utilities, and Consumer Staples are the only three sectors with positive returns in 2022.
- Energy (XLE) is +34.07%…
- Utilities (XLU) is up +3.71%…
- Consumer Staples (XLP) has positive returns of +3.68%.
From a Relative Strength perspective, Energy has slipped a little while Utilities and Consumer Staples are taking over the leadership – these are the most defensive sectors.
The problem for all you index watchers (and investors) out there is these three sectors only account for 14% of the total market cap of the S&P 500.
That’s a big problem if you’re an index investor because it means you own too much of what isn’t working and not enough of what is.
This continues to be a market that calls for defense and cautiousness.
Yes, we will certainly see the headlines and hear the heroes out there telling you how it’s time for Tech to reemerge as a leader.
“Stocks are cheap – it’s time to buy…”
My reply? There’s a good reason growth stocks are “cheaper” than they were a year ago.
So, before you decide to jump into these growth sectors with both feet, I’d suggest you take a good look at the charts below.
And, if after careful consideration, you still think now is the time for tech and communications to go into full-on rally mode – well, may the investment gods be with you…
Let’s focus our attention on how to spot a market that is distributing stocks (to unwary souls) vs. a market where accumulation is taking place by some of the biggest investors in the world.
Let’s start with this: Four times as many NASDAQ stocks have been cut in half as have rallied 50% from their 52-week lows.
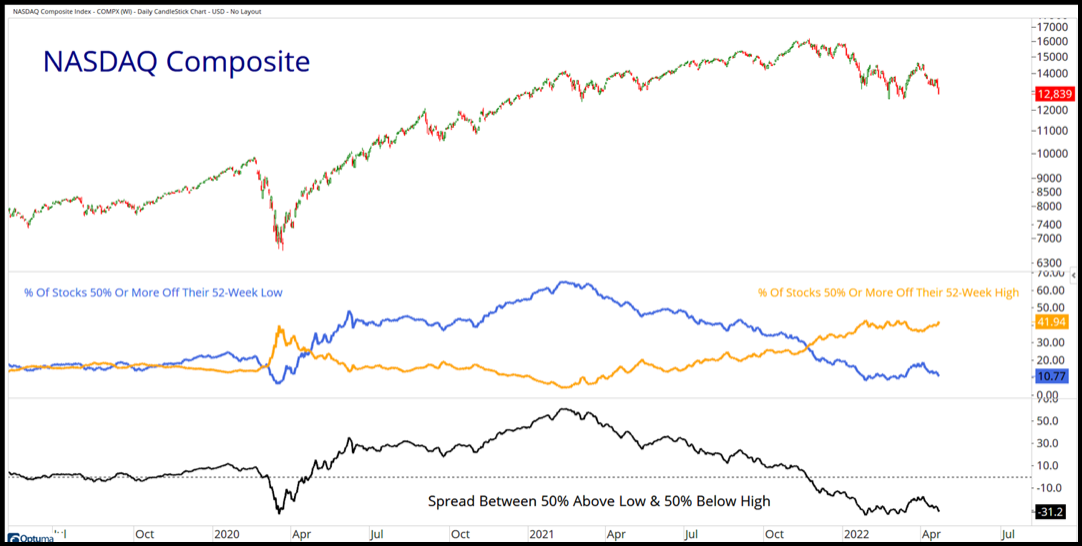
Or this little investor factoid: We have continued to see more stocks making new lows than new highs in both the NYSE and NASDAQ – 22 consecutive weeks of more new lows than new highs, making this the longest such stretch since the Great Financial Crisis.
Call me cynical, but this stat alone makes it difficult to make the case we’re in a bull market. Much easier to make the case that this is indeed what a bear market feels like.
Here’s a chart of the NYSE Common Stock only Advance/Decline line or A/D line for short.
If you’re not familiar with it, it’s just a fancy title for a line chart comparing the number of stocks moving higher (advancing) in price vs. the number of stocks moving lower in price (declining).
What investors need to know: Healthy bull markets will see more advancing shares than declining shares.
However, today’s current market environment has been anything but bullish over the intermediate term – as expressed through the NYSE A/D line peaking last November. Since November (when stocks peaked) more stocks have been declining than advancing.
Investor Tip: Line charts moving down and to the right are not bullish.
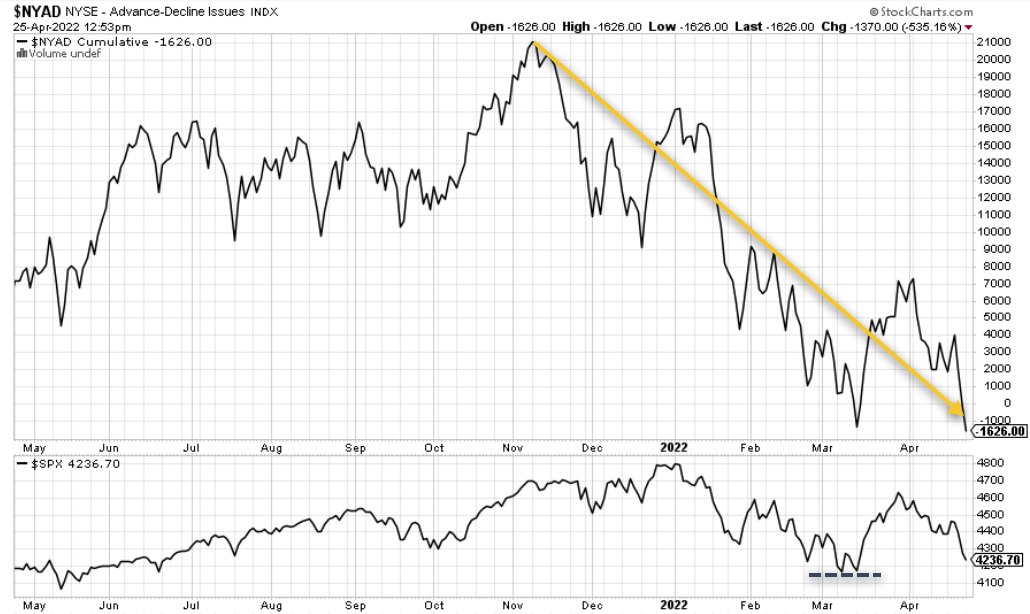
In the lower pane of the chart above, we can see the S&P 500 index looking like it wants to test the March lows.
The million-dollar question is: Will it hold here and mark the lows for April or will the index break below the 4200 level and continue its descent to 4100 or even lower?
Unfortunately, we don’t have tomorrow’s newspaper today…
This is why we rely on breadth indicators like the A/D line in order to visualize what is happening under the surface – out of sight to many individual investors.
Continuing with the idea of tracking advancing shares vs. declining shares, here’s a chart of A/D lines of the S&P 500, NYSE, and the A/D lines of both mid-cap and small-cap stocks.
The theme remains very constant – it doesn’t matter where on the cap scale we are looking, from large-cap stocks to small-cap stocks or the NYSE vs. the S&P – since the beginning of 2022, we have continued to see more declining shares. Lower highs are another indication of weakness.
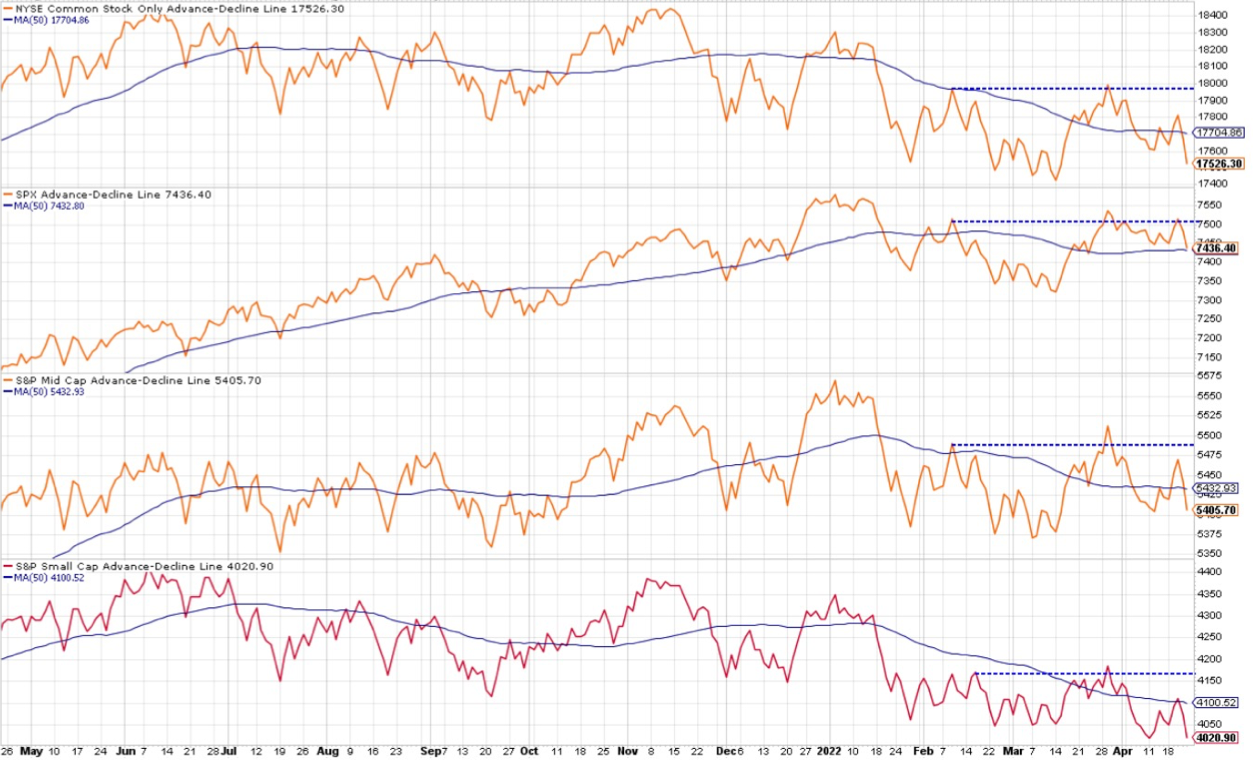
We are very interested to see if the A/D lines up and down the cap scale will continue lower and form new lows, indicating the selling pressure has not yet abated.
It’s a simple story, bull markets are not made when more stocks are declining than rising.
Investors will want to follow the A/D line as a means to track what is happening under the surface – away from the noise of many indexes.
While intense selling can signal exhaustion, it can also just reflect an acceleration of the weakness that has been seen for months now.
If selling is getting exhausted, then Friday’s downside volume should soon be followed by two or more days with similarly-sized upside volume…
Until then, the bearish case gets the benefit of the doubt.
If you have any questions or have been considering hiring an advisor, then schedule a free consultation with one of our advisors today. There’s no risk or obligation—let's just talk.
Tags

Free Guide: How to Find the Best Advisor for You
Get our absolutely free guide that covers different types of advisory services you'll encounter, differences between RIAs and broker-dealers, questions you’ll want to ask when interviewing advisors, and data any good financial advisor should know about you and your portfolio.
