
Related Blogs
October 5, 2023 | Avalon Team
Regime changes are hard.
Take, for instance, the current regime change from disinflation and falling rates to inflation and rising rates.
As the previous regime lasted for over 40 years, there is a generation of investors who know nothing other than that experience.
What makes regime changes difficult is that it requires investors to “unlearn” much of what they take for granted as the “truth” or the “rules of the game.”
Regime changes require a new set of rules, and investors who play using the old rules learn the hard way that the game has changed with peril.
I have been writing about the recent epoch regime change for nearly two years, but its impact is far-reaching.
The following chart is, in my honest opinion, perhaps one of the most important charts in all of finance.
Investors have been told repeatedly to “diversify their portfolio” by adding bonds to lessen the overall risk of their portfolio.
And it worked for a period. In fact, that is the entire premise behind the institutional 60/40 portfolio.
But what happens when the very instrument intended to “de-risk” a stock portfolio becomes the reason for stocks to decline?
The impact of the following chart is far-reaching.
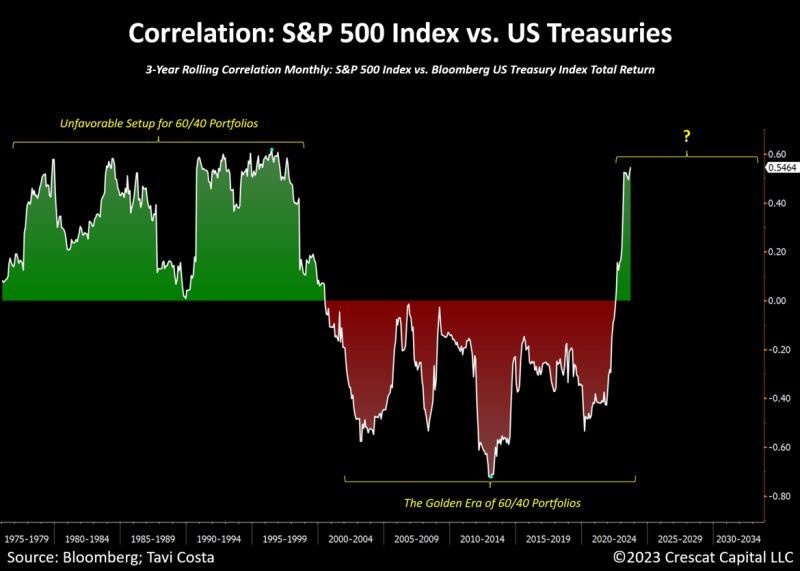
Mutual funds, target-date funds found in 401ks, variable life insurance contracts, pensions, etc., are generally built around the idea of allocating to bonds to lessen risk.
But, as the chart above shows, the correlation between stocks and bonds is no longer negative. And this matters a lot!
Investors are ill-prepared for this shift.
As I stated at the beginning, regime charges are hard because at first, there is denial.
When bonds had a bad year in 2022, many investors, professionals included, dismissed it as a “bad year” and continued on with the strategy of allocating to bonds.
But 2023 is also proving to be another bad year for bonds.
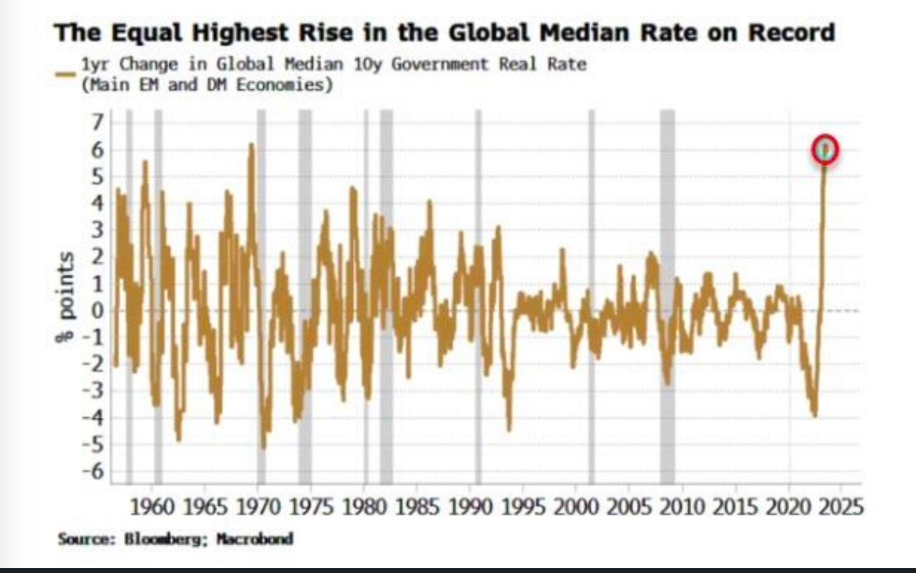
In fact, the recent rise in interest rates is the fastest increase in rates EVER!
And, as yields have been soaring, bond prices have been falling as this chart of TLT (iShares 20+ year Treasury Bond) shows.
To put it bluntly, bond prices are cratering and have lost as much as stocks did in 2008.
Ten-year Treasury notes have plummeted 46% since March 2020, according to data from Bloomberg, while 30-year Treasurys are down 53% over the same period.
And yet, investors continue to desperately pour money into Treasuries despite the massive underperformance.
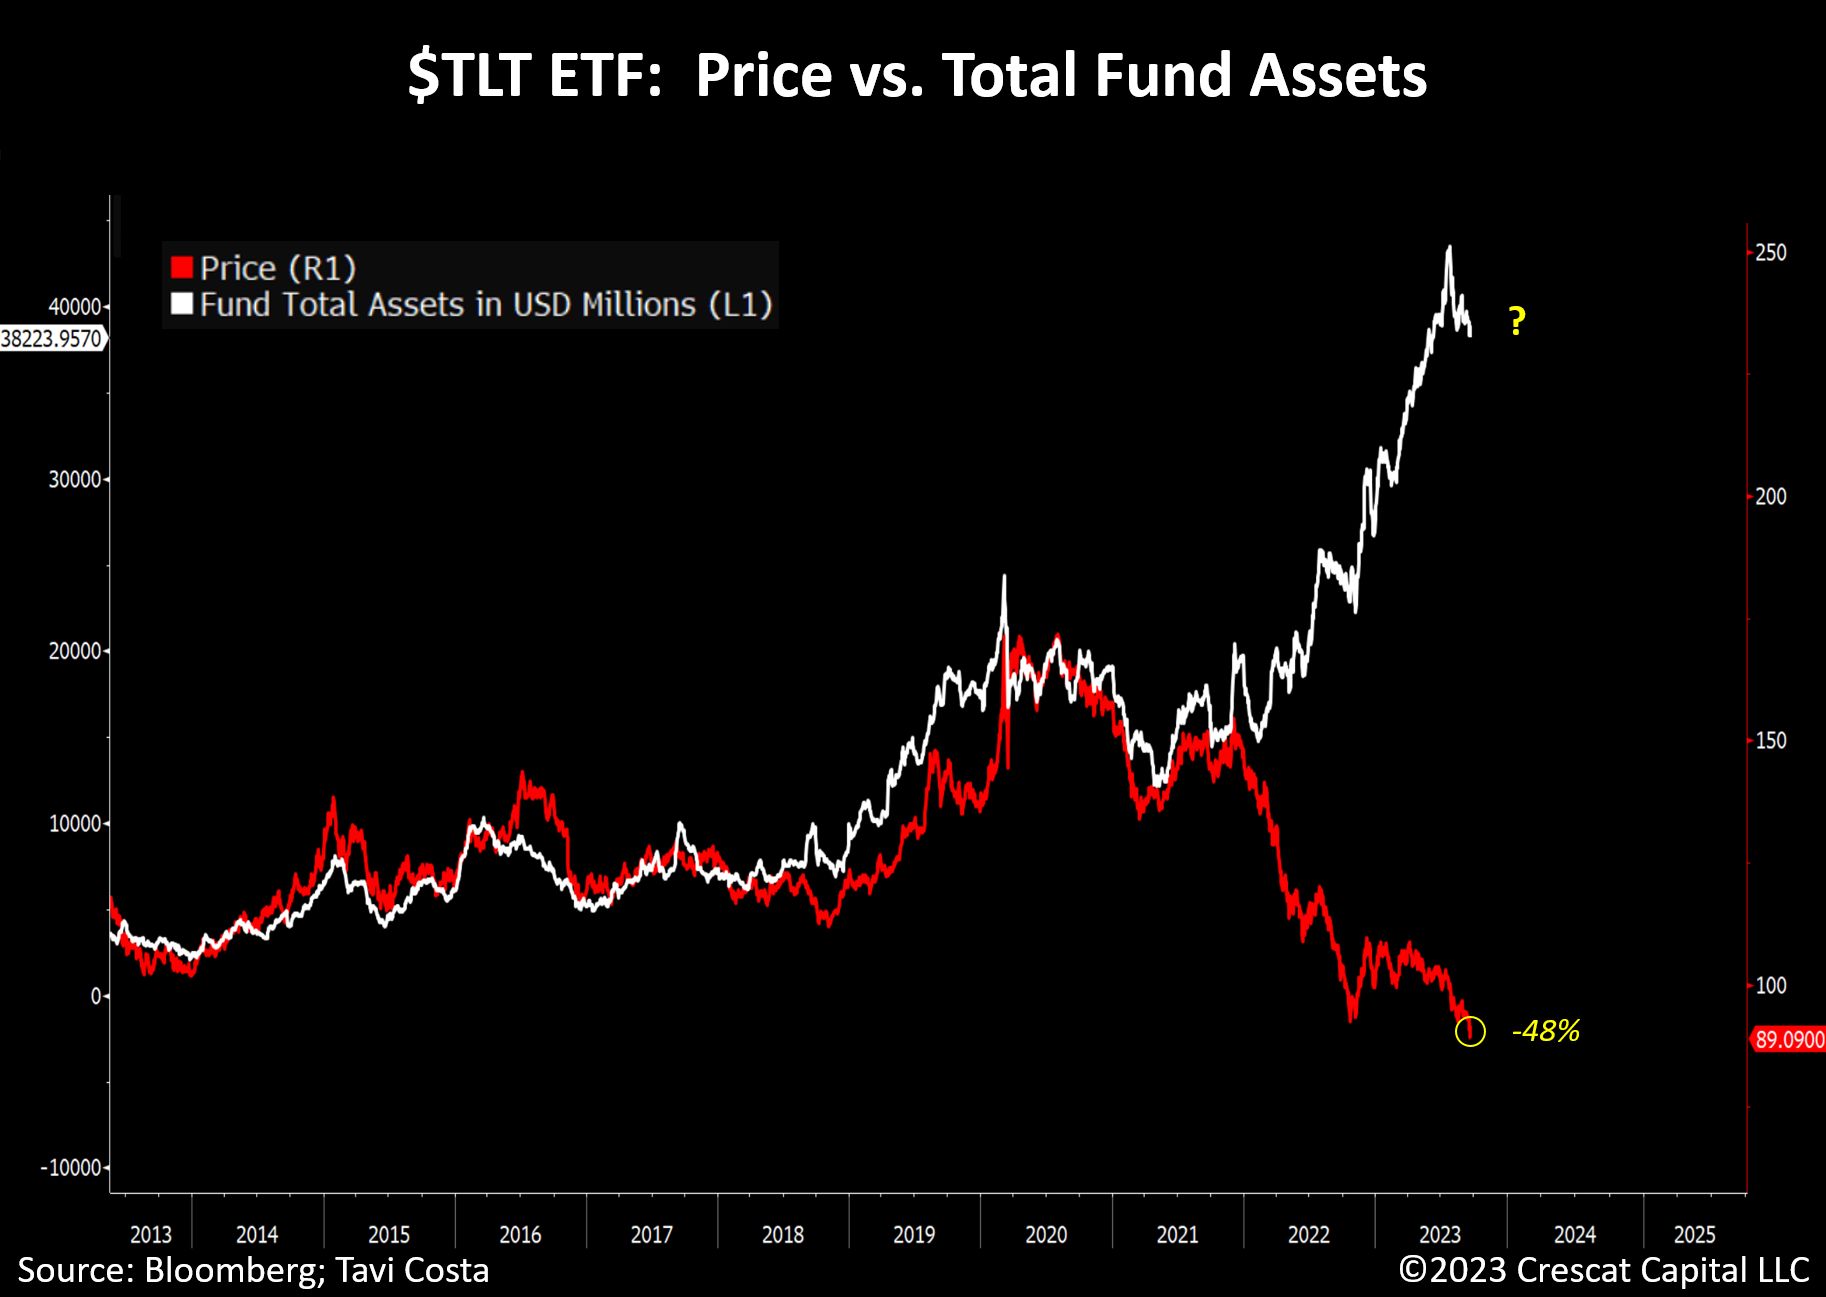
Note how capital consistently flows into the $TLT ETF despite a nearly 50% drop in its underlying price.
60/40 portfolios continue to stubbornly allocate funds to this underperforming asset, hoping for a return to a disinflationary environment.
Regime changes are hard.
And with stocks priced expensively, rising yields make stocks look less attractive.
The concern is that stocks are trading about twice their historical mean valuation, as this chart of the CAPE (cyclically adjusted P/E ratio) demonstrates.
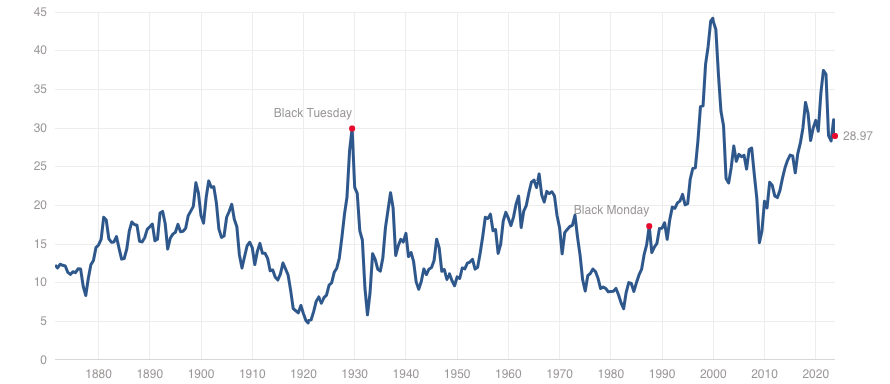
So, investors have a scenario of rising yields (falling bond prices) and falling stock prices.
There is also another notable difference.
In the past, the Fed, through Quantitative Easing (QE) was adding liquidity to the financial markets.
Today, the Fed is draining $100B a month from liquidity.
Recently, Rick Santelli had this to say on CNBC:
“In other words, despite the fact that the Fed has yanked the QE Punch from the punch bowl, after 15 years on the sauce, Congress hasn’t caught on. They’re spending like drunken sailors. Remember, the Fed was buying 50% of all new UST bonds issued in 2021 as part of covid stimulus. Now the Fed is selling. QT is reducing Fed holdings and shrinking its position in UST and Agency MBS.”
According to Subadra Rajappa, of Societe Generale, the supply-demand issue has never been so unfavorably skewed because not only is the Fed selling, but foreign buyers are stepping back too.
The effect of this is fewer buyers for UST bonds.
Falling demand leads to falling prices which increases the yield.
It’s that simple.
There are other real implications that are just starting to be felt.
Mortgage rates are now the highest they’ve been since 2000 with the average 30-year fixed rate at 7.31%.
According to Skylar Olsen, Chief Economist for Zillow, at that rate, the mortgage payment will take 40% of a home buyer’s income for a person applying with 10% down, or 37% of income with 20% down.
In other words, homes are unaffordable. And soon, we should see a softening in the housing market begin to unfold.
So with so much of investors’ net worth tied up in 401ks, traditional investment strategies, and their homes, there is a lot riding on the current regime change.
In close, correlations between asset classes are not fixed.
Investors who extrapolate into the future what has worked in the recent past will likely be disappointed.
Regime changes are hard.
If you have any questions or have been considering hiring an advisor, then schedule a free consultation with one of our advisors today. There’s no risk or obligation—let's just talk.
Tags

Free Guide: How to Find the Best Advisor for You
Get our absolutely free guide that covers different types of advisory services you'll encounter, differences between RIAs and broker-dealers, questions you’ll want to ask when interviewing advisors, and data any good financial advisor should know about you and your portfolio.
