
Related Blogs
October 17, 2023 | Avalon Team
A quick note to investors – don’t allow yourself to get too caught up in all the doom and gloom you’re being bombarded with each day by the media.
Remember, their job is to get clicks, sell advertising space, and increase their bottom line… not yours!
Don’t assume that everything you hear and read is put out there to educate investors – it isn’t. They don’t care about you!
So let the financial pundits say what they’re going to say. Most of it is useless junk. Ignore it.
Focus on the only thing that actually matters. And what matters most is price.
So while today’s headlines are about interest rates, inflation, recession, and wars in the Middle East, you’d be well advised to focus on the charts I’m about to show you.
Because when these charts flip from bearish to bullish, as they have, savvy investors take notice.
What we’re about to look at here is the percentage of stocks that trade on the New York Stock Exchange (NYSE) that are on buy signals on their own respective charts.
The charts below consolidate them into one chart to give investors the inside scoop as to the direction of stocks.
These consolidated charts are a quick read of market breadth and risk levels.
You won’t hear much about these from the media, but they are as important as any three charts for tracking true price action of the NYSE.
These are Bullish Percent Charts (BPI).
It’s simple to follow, as it is a series of X’s and O’s.
When the chart is in a column of O’s it indicates supply is in control – or there’s lots of selling pressure.
Conversely, when the BPI is in a column of X’s demand (buying) is in control.
The first chart is the BPI of the NYSE on a shorter-term basis – 10 weeks to be exact.
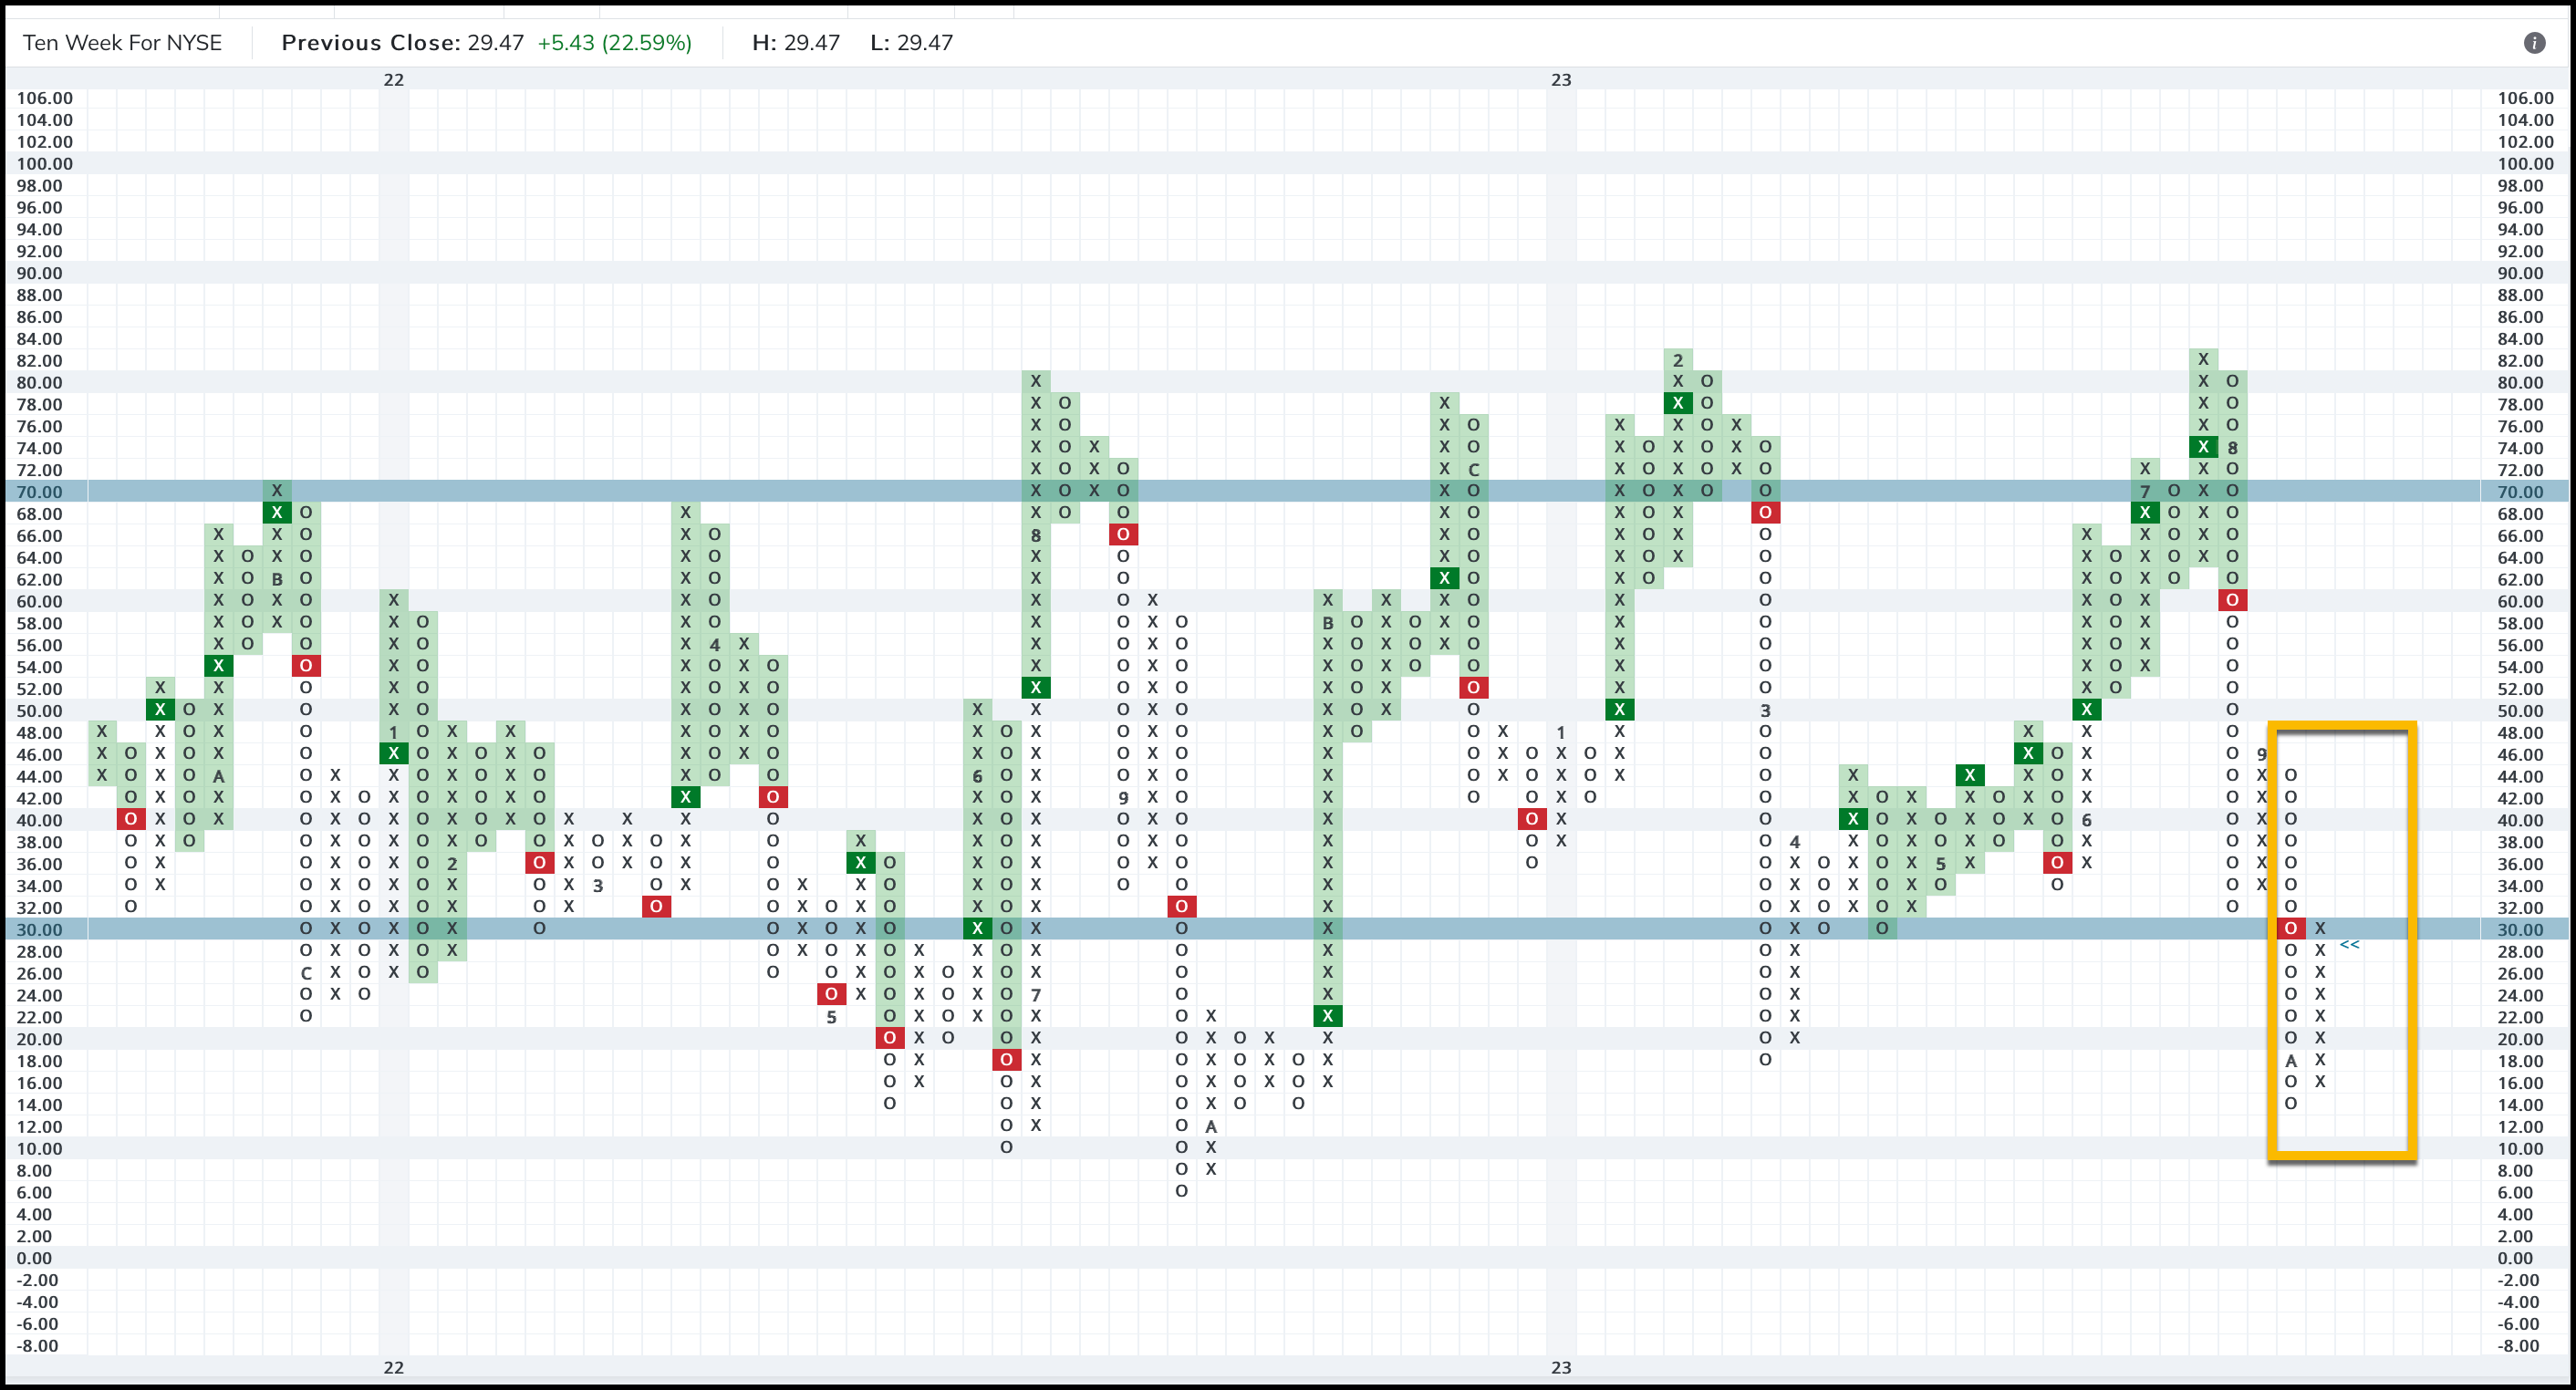
Courtesy of NASDAQ/Dorsey Wright
I’ve highlighted what you need to see right now.
A long column of O’s that moved all the way down to 14%.
Meaning that recently only 14% of all the stocks that trade on the NYSE were on buy signals over the previous 10 weeks.
That’s a very oversold market condition.
But, you see the column of X’s that moved up to the 30% level?
Well, that’s demand coming back into the market. Those are buyers, who bought on the cheap.
Technically, a move above 30 is considered a buy signal on this short-term chart.
The next chart is also the NYSE BPI, but this one is a chart of what’s happening with prices on an intermediate-term time frame – 30 weeks.
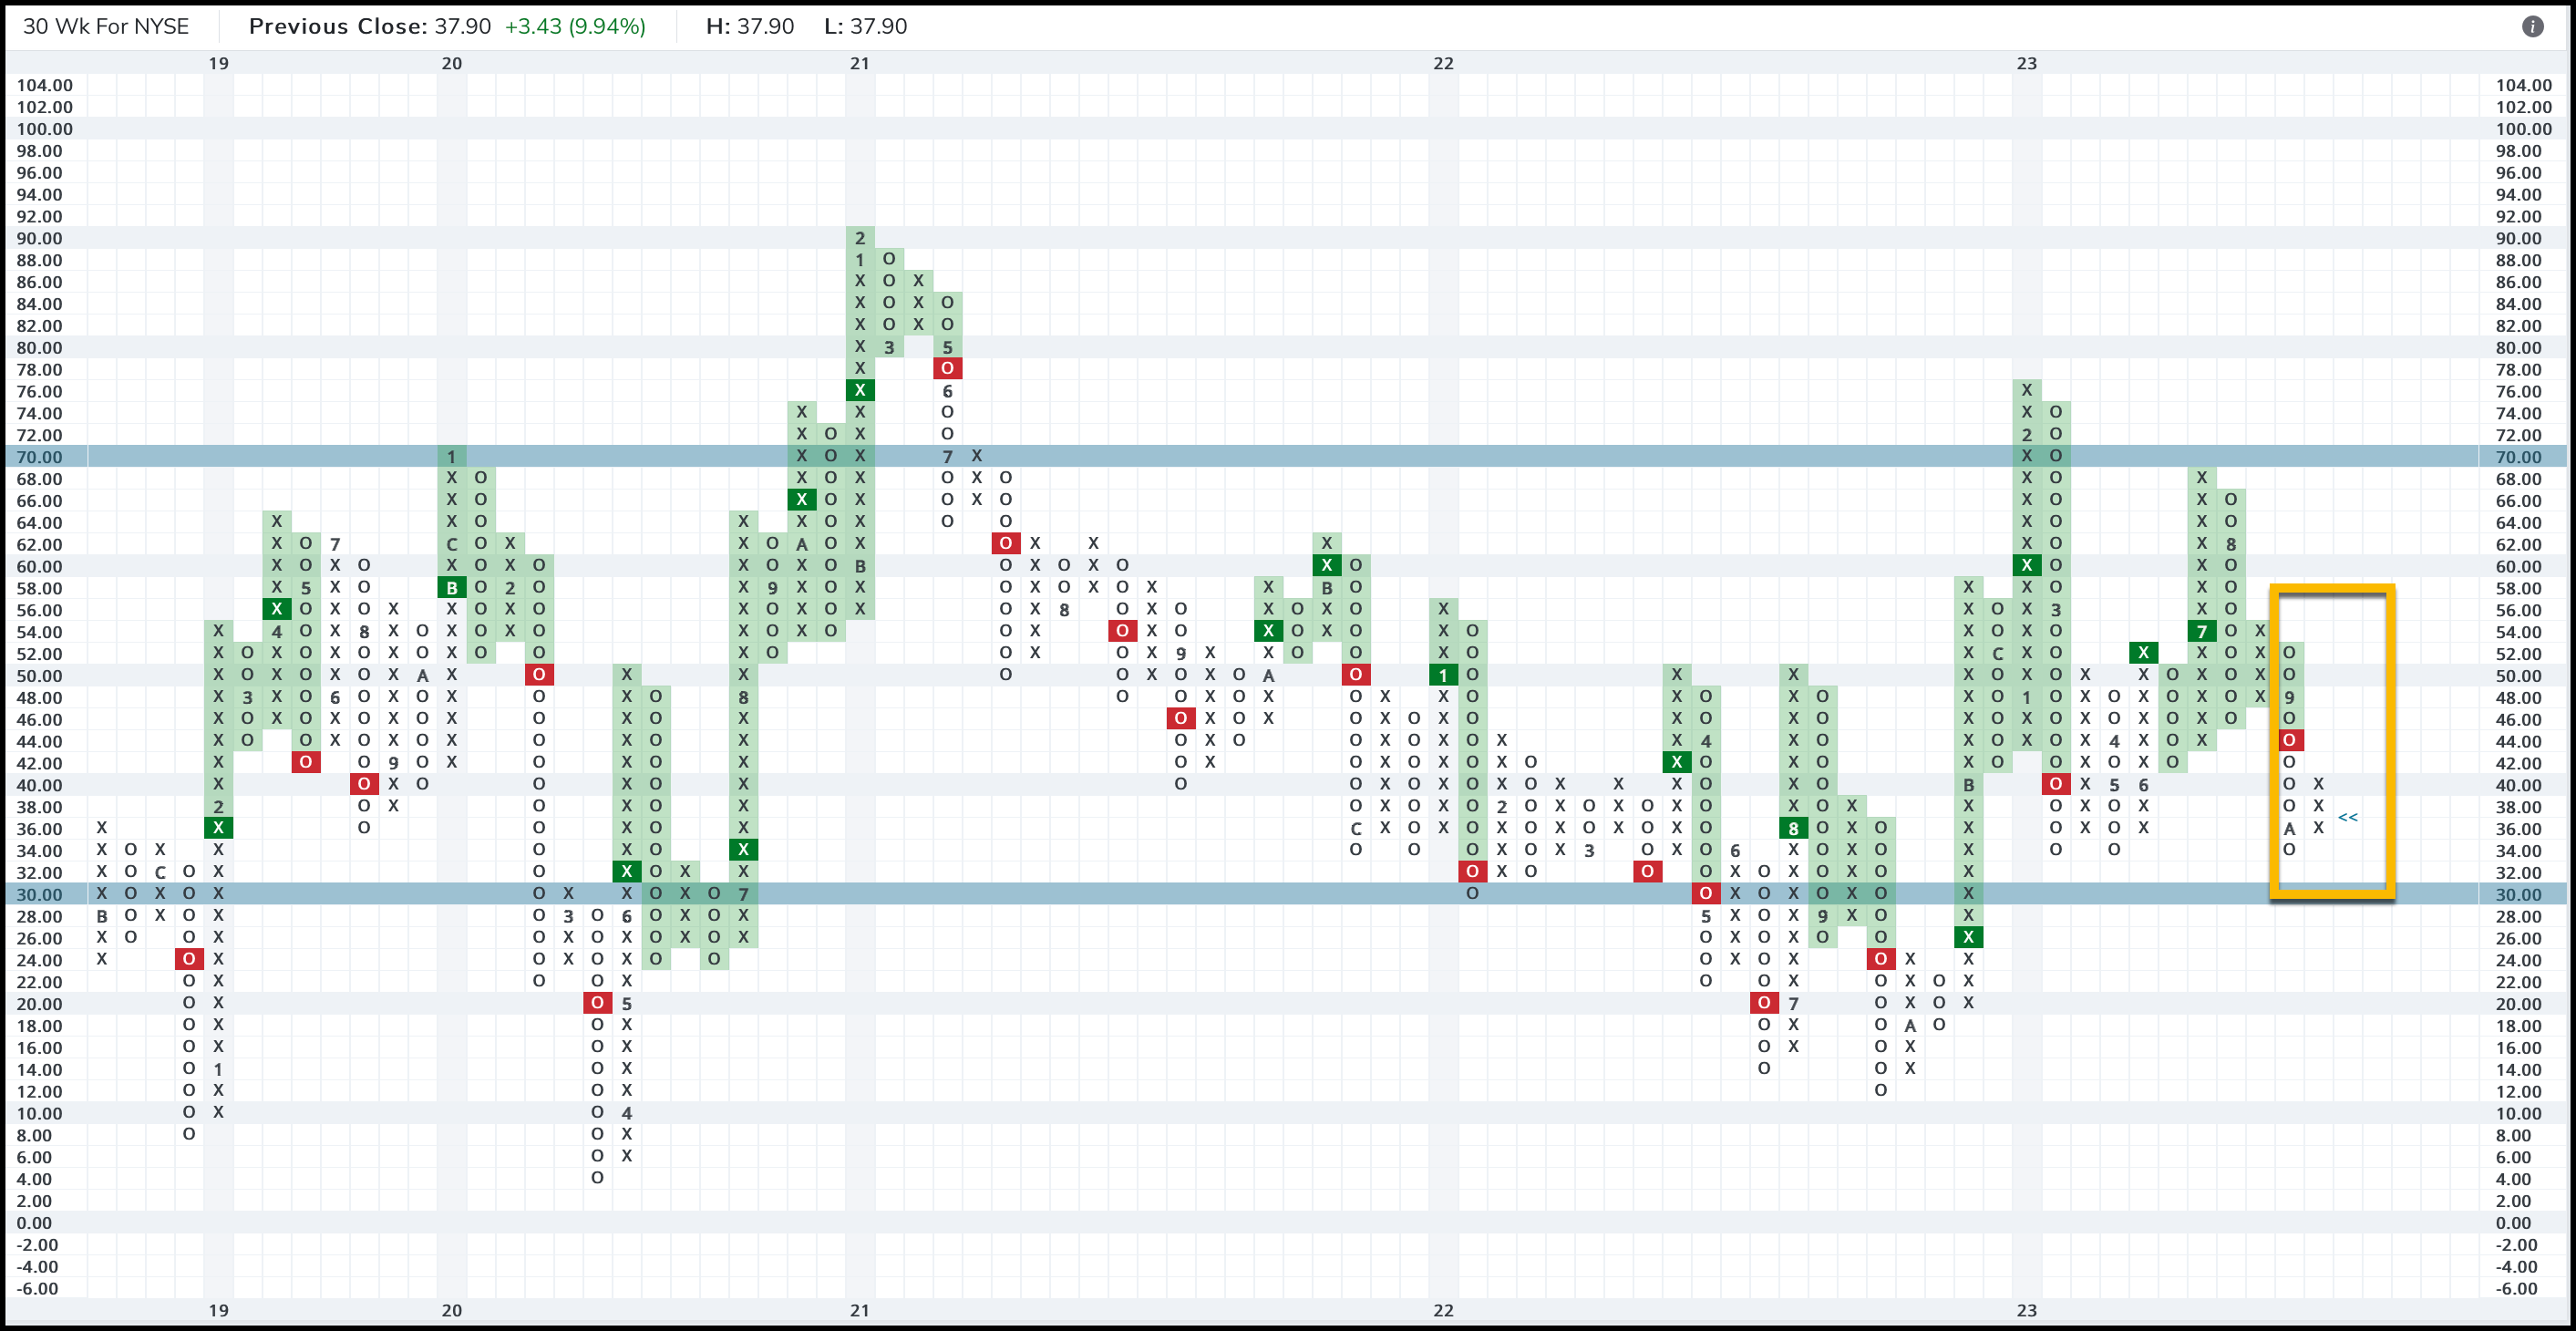
Courtesy of NASDAQ/Dorsey Wright
Focus on the highlighted area to the far right.
There was a column of O’s (that didn’t fall to extreme oversold levels below 30%), followed by a new column of X’s.
Together, these charts are flashing to investors that we now have more demand for stocks in both the short (10-week) and intermediate (30-week) time frames than there is supply (or sellers).
That demand drives prices higher, resulting in more and more stocks of the NYSE moving to buy signals on their individual charts.
So that’s what’s happening with the price of the all-important NYSE.
But let’s finish our analysis with a review of America’s favorite index – the S&P 500.
Just last night the SPX BPI flipped from O’s to X’s – indicating buyers taking control of the large-cap weighted growth index.
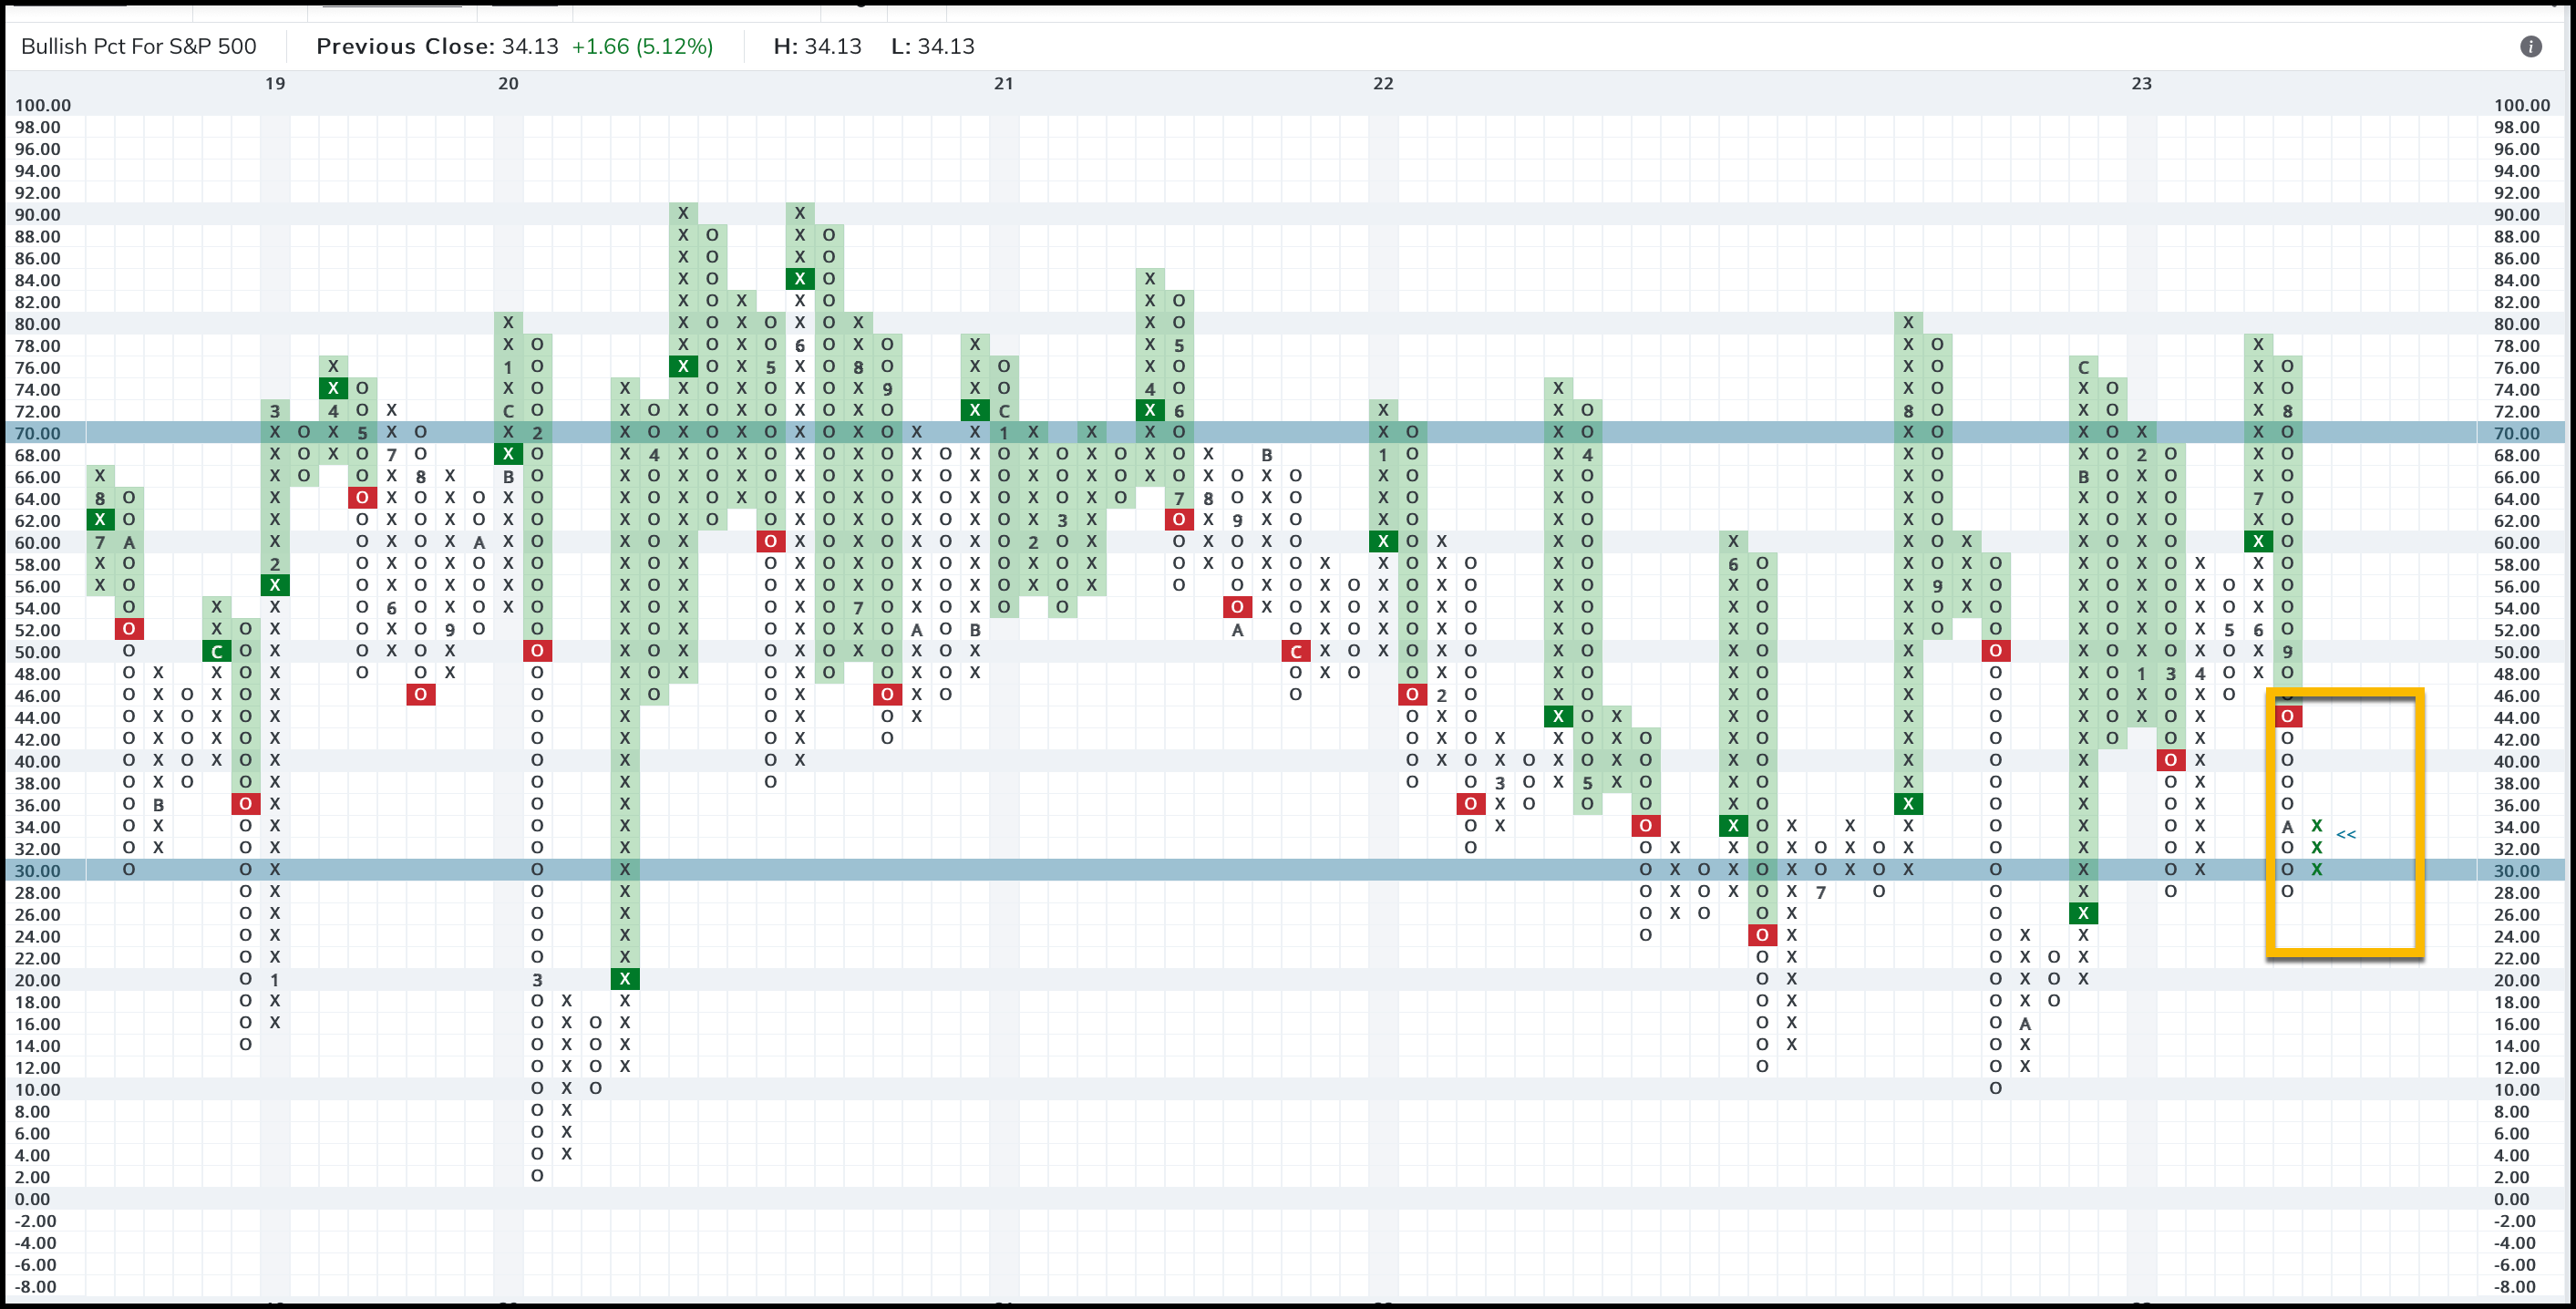
Courtesy of NASDAQ/Dorsey Wright
It did so while moving from a technical oversold reading of below 30% back above 30% – confirming a buy signal.
You can listen to all the scary headlines that do nothing to help your P&L, or you can focus on what’s happening under the surface with price.
Now that you know what is actually happening with prices, you know what no one else is telling you!
Focus on price…
If you have any questions or have been considering hiring an advisor, then schedule a free consultation with one of our advisors today. There’s no risk or obligation—let's just talk.
Tags

Free Guide: How to Find the Best Advisor for You
Get our absolutely free guide that covers different types of advisory services you'll encounter, differences between RIAs and broker-dealers, questions you’ll want to ask when interviewing advisors, and data any good financial advisor should know about you and your portfolio.
