
Related Blogs
September 27, 2022 | Avalon Team
I have an important question to ask today: How do you see the market?
Do you see a stock market (i.e. S&P 500 or DJIA) or a market of stocks?
How you answer that question can have a lot to do with your success.
You see, there are a lot of investors out there who are under the misguided impression the “market” is the S&P 500 index. And their performance proves it.
What do you see when you look at the chart below?

It’s not a trick question.
You are looking at a price chart of the S&P 500 index, or more specifically a large-cap growth index.
What does it really tell you?
The fact is, watching the behavior of the index can only tell you so much.
We can see the index is in a long-term downtrend and that after a summer rally following the June lows, the index is once again retesting those previous lows.
But, that’s about it.
So, if you really want to know what’s going on, you have to look under the surface.
You have to know what the stocks that make up the indexes are doing.
What’s happening under the surface right now?
To answer that, we’ll start with a little prime using this snapshot of the SPDR S&P 500 Index ETF (SPY).
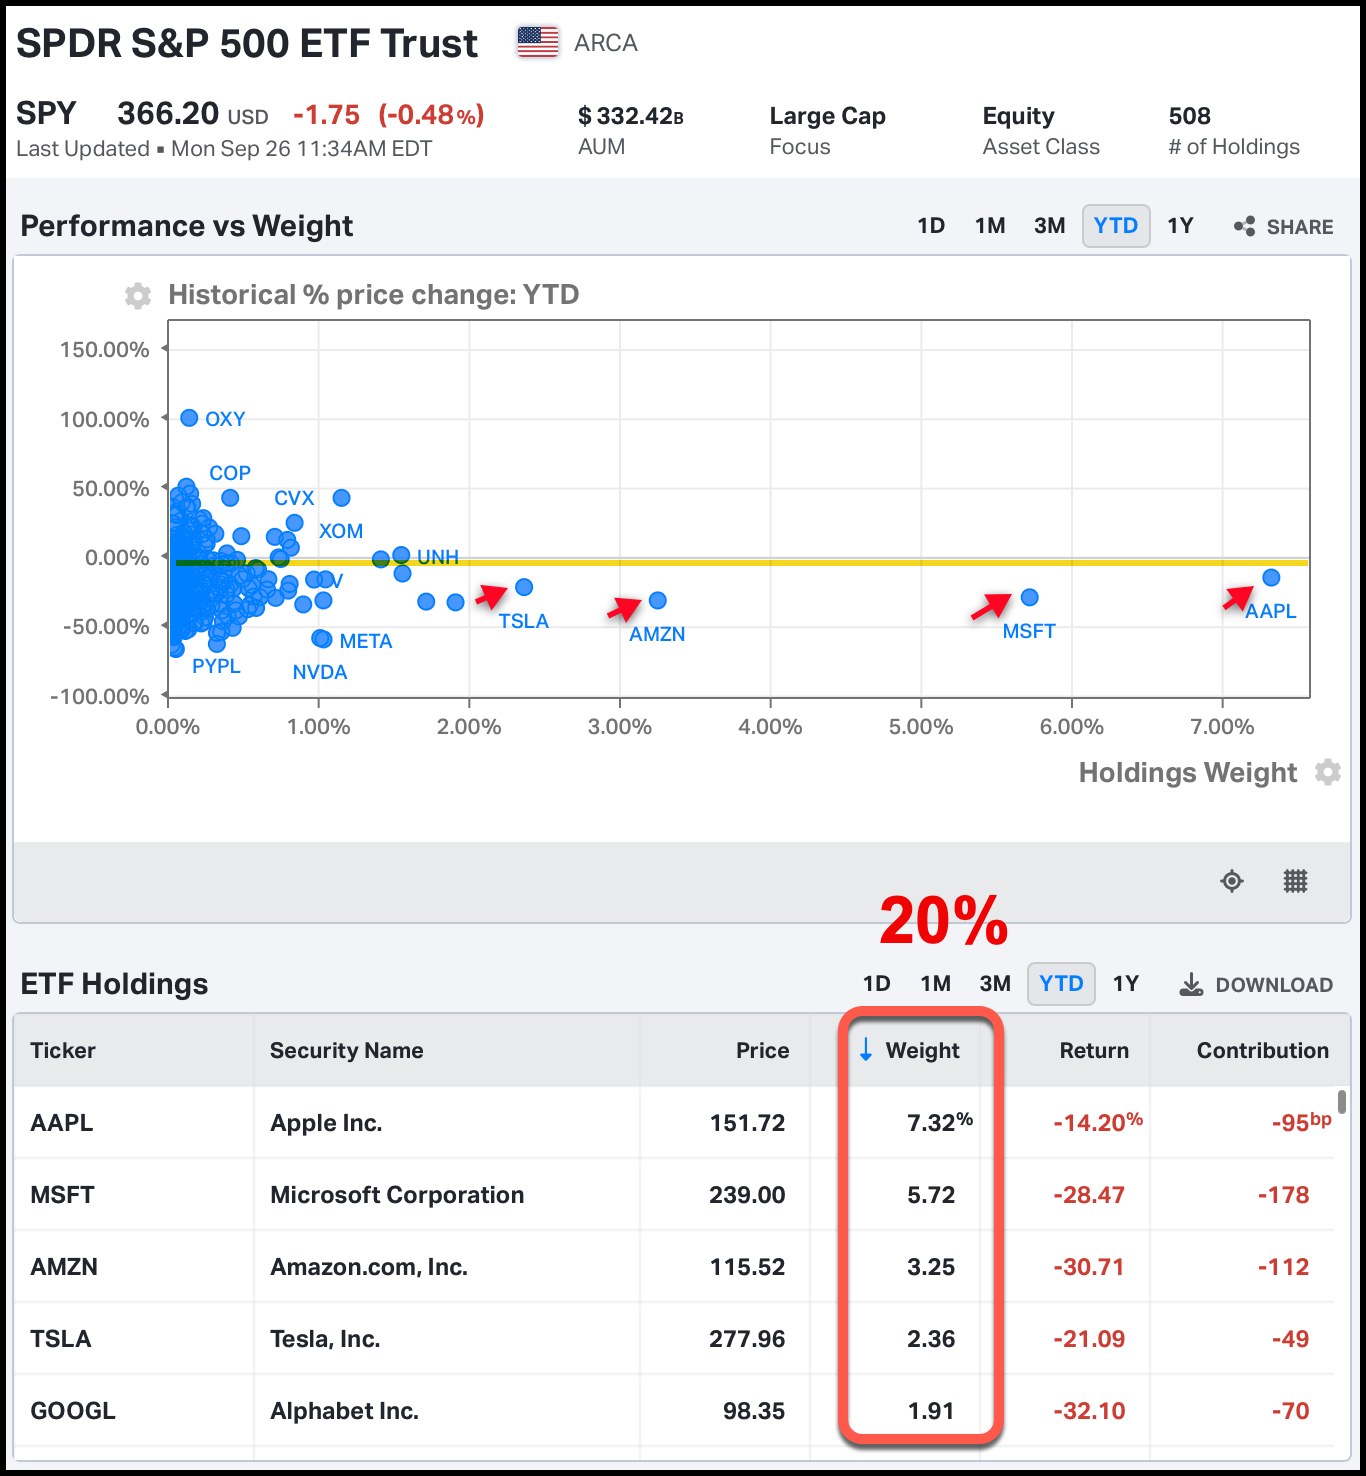
Two things stand out in this chart.
The ETF holdings are found in the lower pane. Apple, Microsoft, Amazon, Tesla, and Alphabet – the five behemoths – comprise 20% of the S&P 500. Just 5 stocks!
So, if these heavyweights are struggling, then you can bet the index is going to struggle too.
Now look back at the chart again. In the upper pane it’s illustrating the holdings’ performances and weighting.
It highlights that these five companies are all showing negative YTD performance – all under the 0.00% line (highlighted).
Believe me, there are plenty of S&P 500 members underwater this year, but these stocks, the ones furthest to the right on the grid, are the largest and most important holdings in the index.
They are the stocks that have the greatest impact on the index’s overall performance.
So investors would be wise to know what these five are doing.
And right now, it doesn’t matter which of the 5 you look at – Tesla, Amazon, Alphabet, Microsoft, or Apple – all of these large-cap “leaders” are in downtrends.
All are priced below both their respective 50- and 200-day moving averages and all are priced at or below important areas of support.
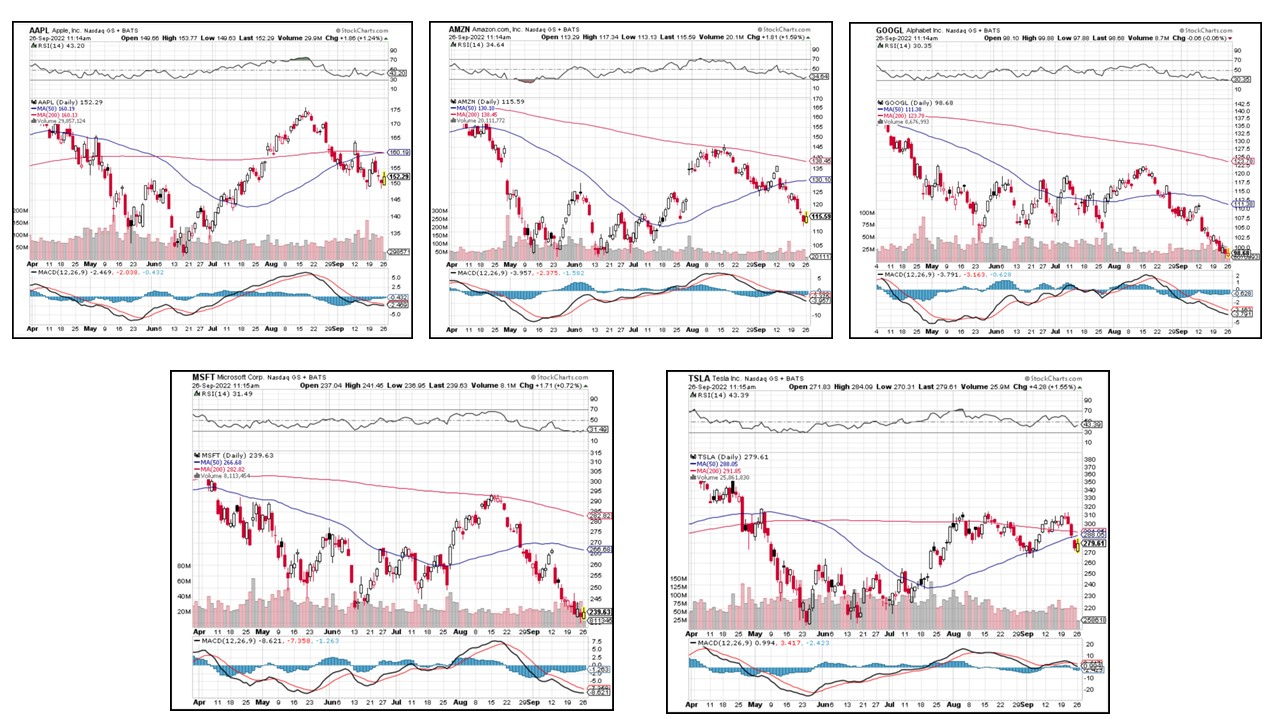
It is “make it or break it” for some of the world’s largest stocks. And these price charts look awful.
The next move in the S&P has everything to do with these five stocks.
A reversal higher for the “Fab 5” will carry the index higher…
But any further deterioration could bring the index to new lows in 2022.
If you are an index investor or have money in a 401K, these five stocks may be the most important charts to watch in the coming weeks.
If you have any questions or have been considering hiring an advisor, then schedule a free consultation with one of our advisors today. There’s no risk or obligation—let's just talk.
Tags

Free Guide: How to Find the Best Advisor for You
Get our absolutely free guide that covers different types of advisory services you'll encounter, differences between RIAs and broker-dealers, questions you’ll want to ask when interviewing advisors, and data any good financial advisor should know about you and your portfolio.
