
Related Blogs
September 30, 2022 | Avalon Team
Today is the last day of September, and you know what that means – it’s the last day of the month and the last day of Q3.
So get ready, because next week is where we’ll do a deep dive into everything from asset class and sector strength to market breadth and investor sentiment.
Consider this just a little prequel to the quarter-end review we have coming your way.
Today, I want to share two market indicators that have signaled short-term rallies in 2022.
We’ll start with a review of the S&P 500 index…
Here we are back at the scene of the crime – back at the June lows. To be technically correct, the S&P broke below the June lows earlier this week and put in a new low for the year.
The point is, we’re watching a retest of an area where the S&P last found meaningful support, so it’s an important level to watch.
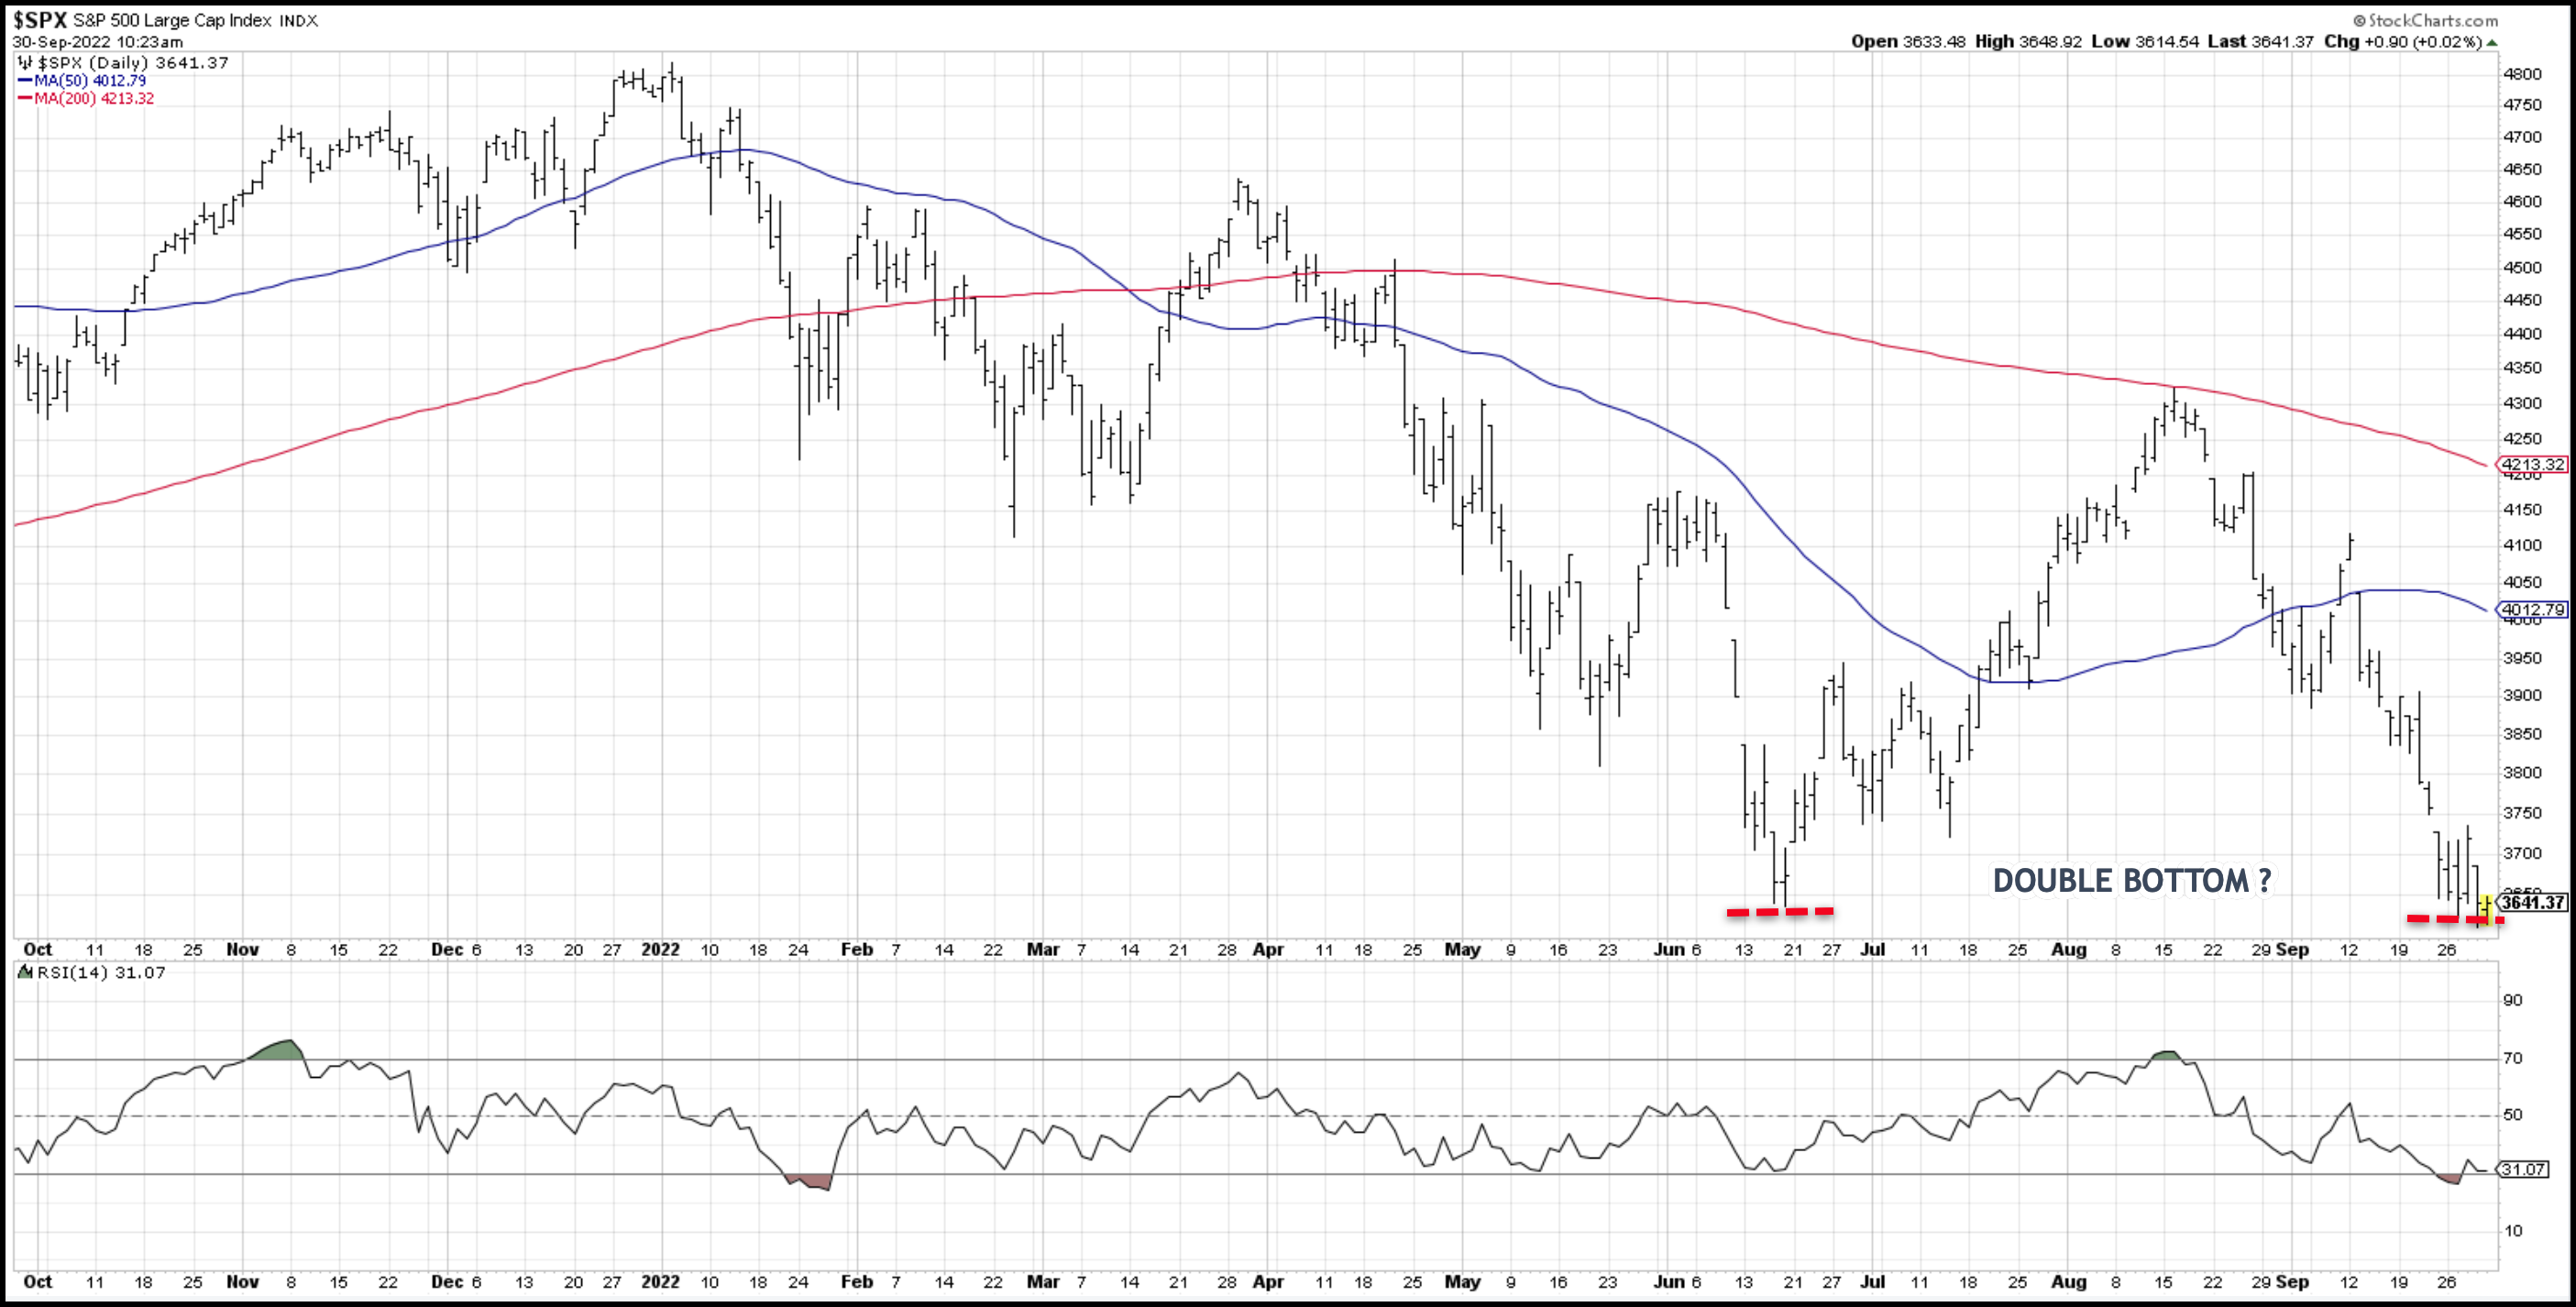
Is this a double bottom? Will we bounce higher from these levels?
As with all rhetorical questions about the market, we can’t answer that yet. Only time will tell.
However, what we can say is that this is a logical place for the S&P to dig in and reverse higher if it’s going to.
There are a lot of reasons for that, but today I’ll focus on two indicators that have done an excellent job in predicting reversals in 2022: the Bullish Percent Index of the S&P 500 and the VIX.
Analyzing market participation via the Bullish Percent Index of the S&P 500 has allowed us to determine risk levels based on stock participation and reading the overbought or oversold conditions of the S&P.
We don’t want to get too caught up in the weeds, but this indicator relays two data sets:
The first, when the line chart in the upper pane (below) breaks below 30% it signals an oversold market.
Second, it will identify the percentage of stocks that trade on the S&P that are on buy signals on their respective charts.
Currently, the percentage of stocks trading on the S&P that are on buy signals is in the single digits. But focus on the oversold signal – below 30%. We saw oversold conditions in March and in June… following those oversold conditions, markets rallied (May and June).
The S&P is now at similar oversold levels that it was at prior to the June stock rally.
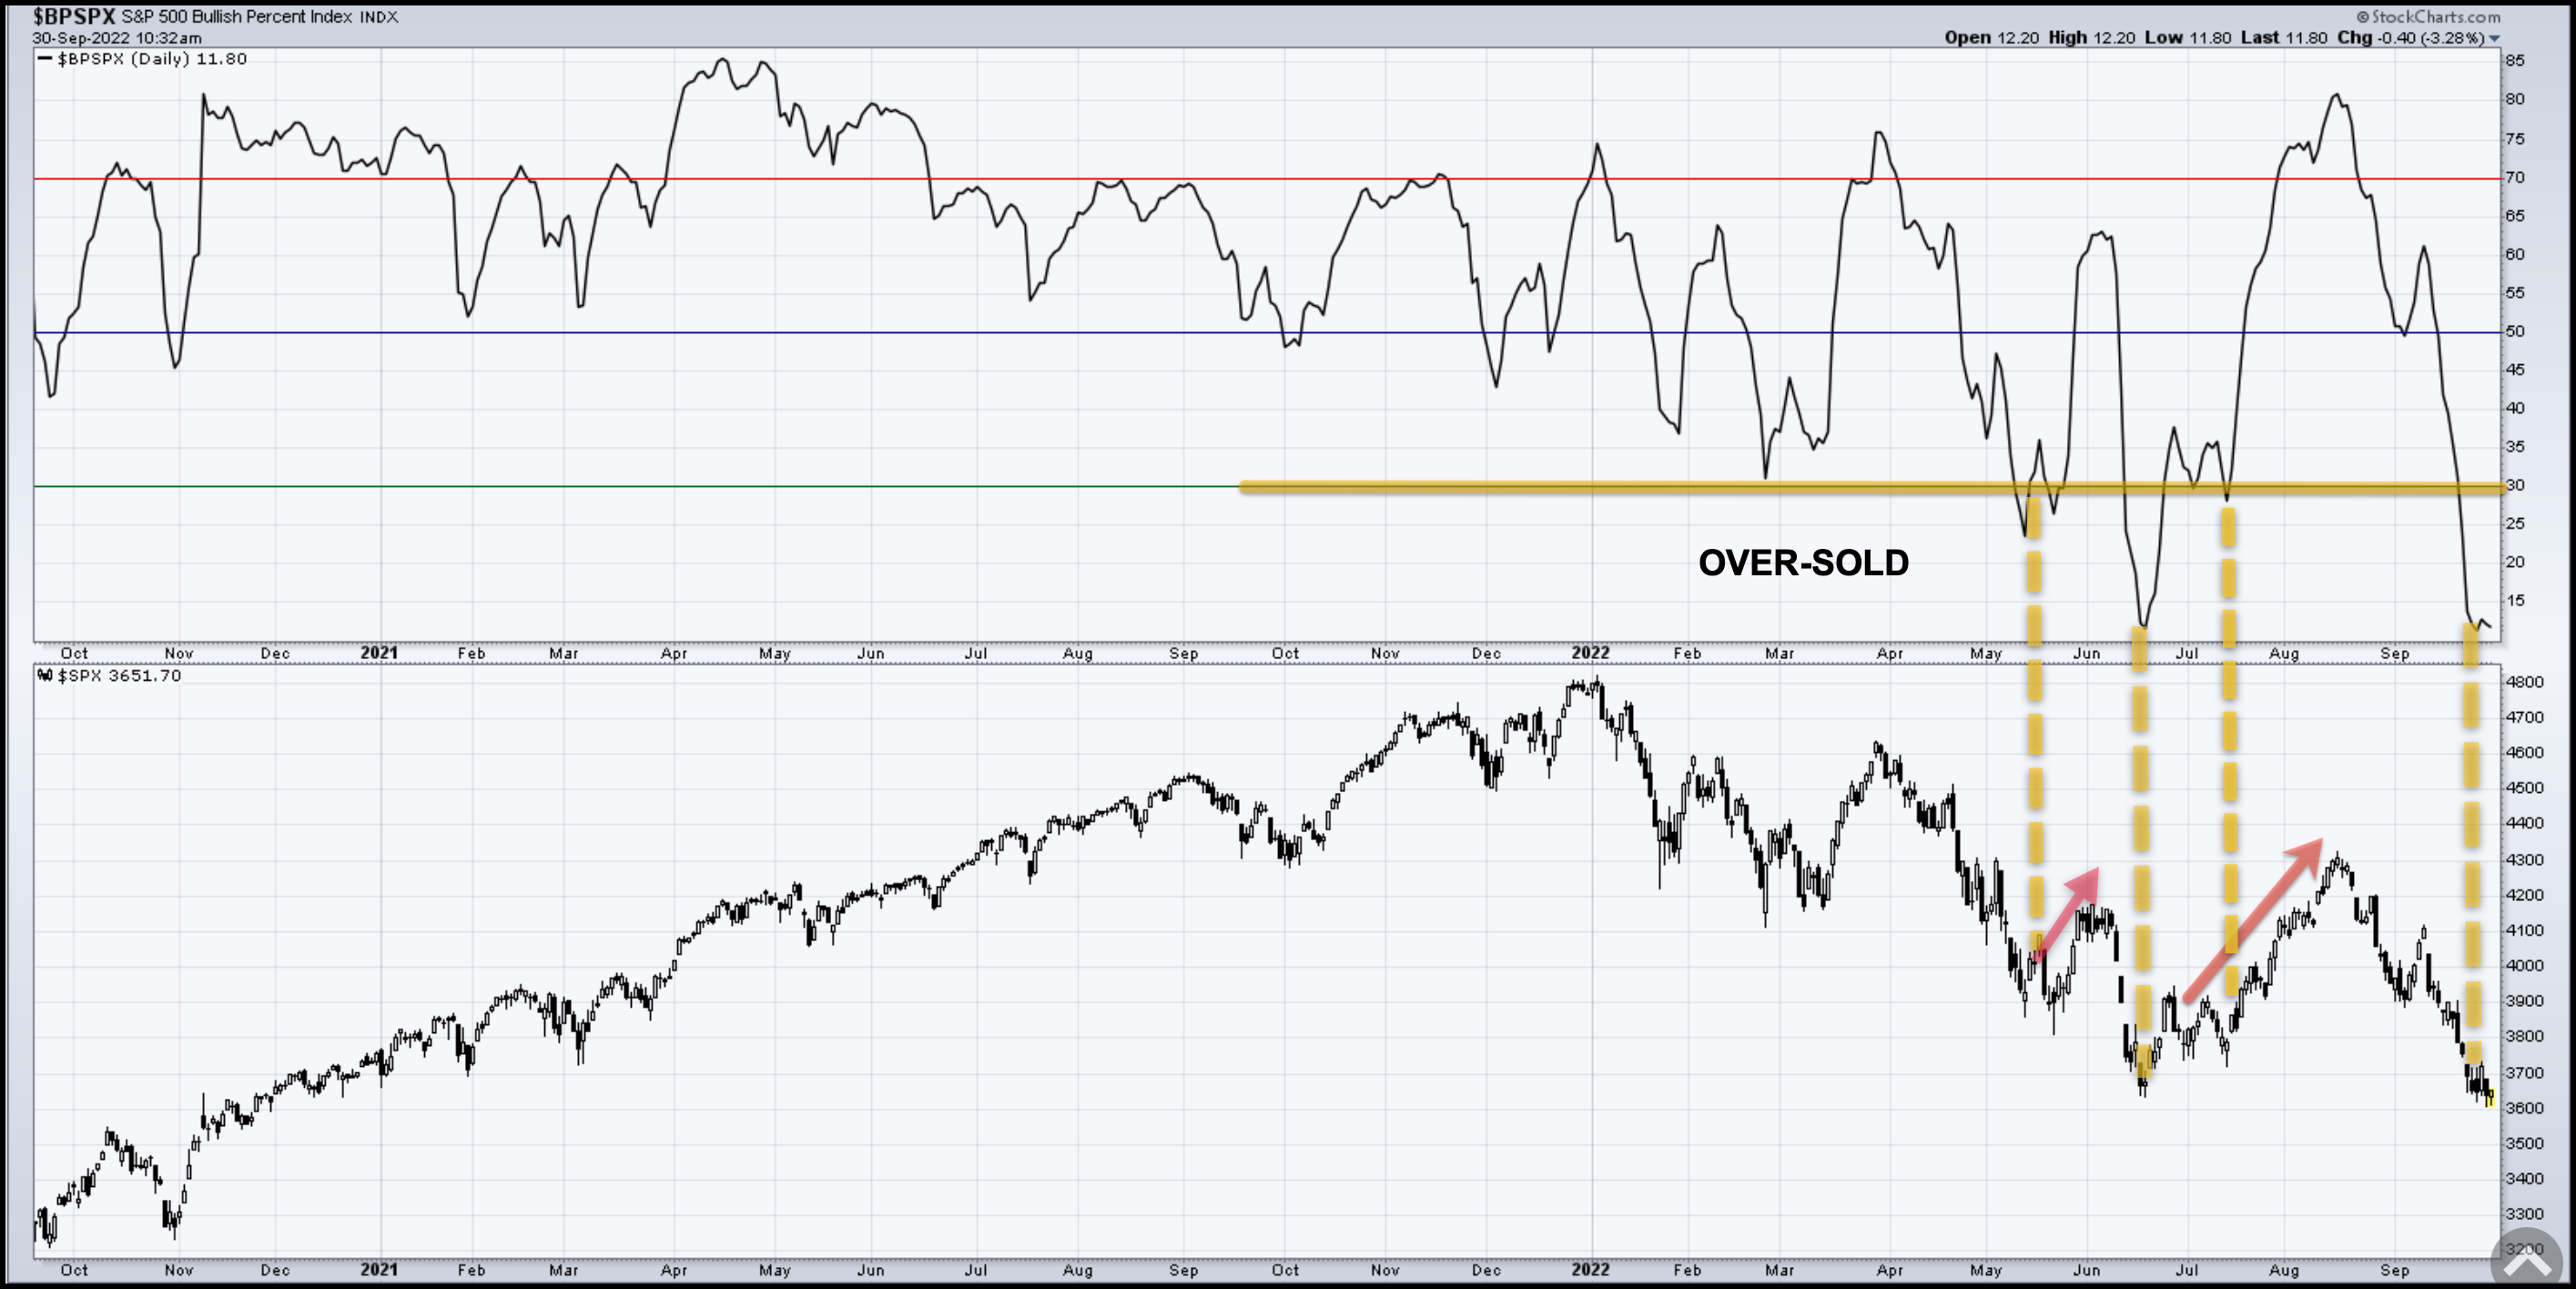
Objectively, oversold does not mean over. It is possible the S&P remains at these levels or even moves lower for some time before a reversal occurs.
What we can say as a general rule is that when the BPI gets into oversold levels, it has led to opportunity.
Moving on to the VIX, which is a measure of fear or uncertainty often referred to as the “fear gauge.” When investors are getting nervous and panicking, you’ll see that anxiety expressed as a spike in the VIX.
The VIX can move to extremes – and it has recently. It blew up during the height of the covid crash, for example (see below).
Now that we’re in 2022, the character of moves in the VIX is different. This year, we’ll qualify a spike in the VIX at readings above 30.
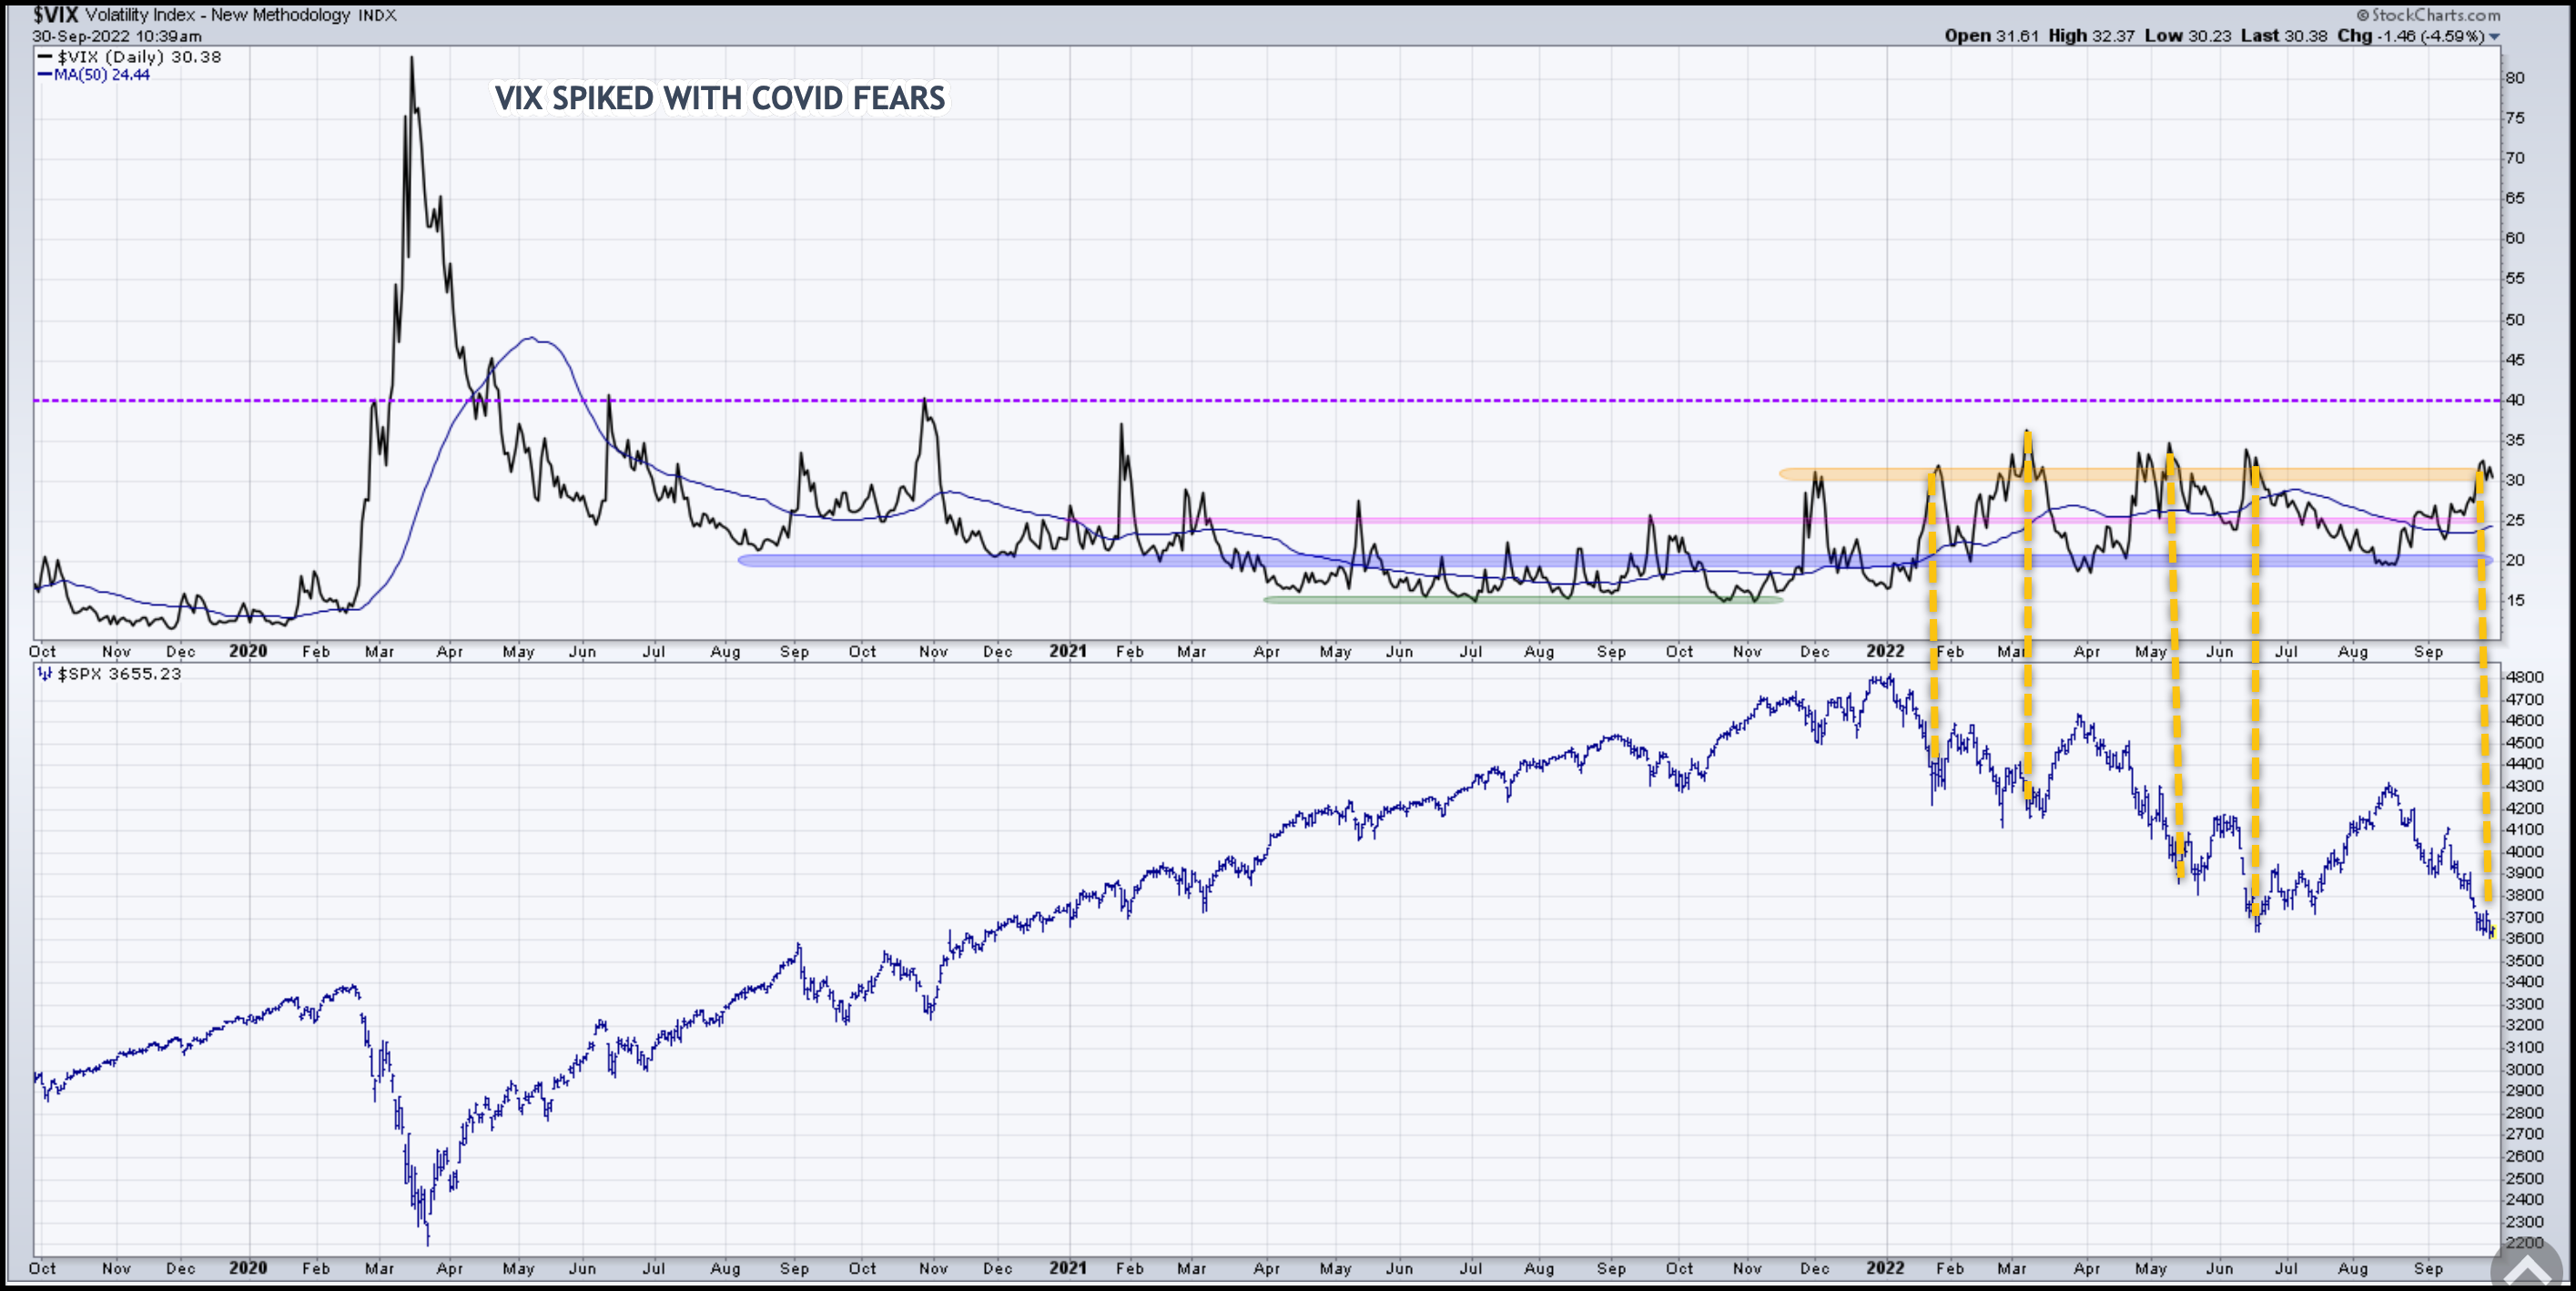
Throughout 2022, when the VIX exceeded 30, it signaled opportunity as the S&P formed short-term bottoms and rallied higher. I’ve highlighted (above) the relationship of the VIX to short-term bottoms in price at the index level.
Each time the VIX has exceeded 30, the S&P has rallied.
It’s crucial investors make a mental note that the VIX formed this same pattern last Friday into Monday of this week.
Just remember: The VIX above 30 has created tactical opportunities.
But I wouldn’t rely on this data alone for calling an end to the bearishness altogether.
The weight of the evidence suggests a short-term bottom could be in the works, but we simply can never say for sure. No crystal ball here my friends!
But here is what we know:
We have the VIX above 30…
The S&P 500 BPI is at oversold conditions…
And the S&P 500 index is testing previous lows.
Check, check, and check – these are the ingredients for a rally off current lows.
So… Is that THE bottom or another short-term bottom?
Sure, it’s possible, but is it probable? It’s not the bet I’d be making…
Nothing has materially changed to suggest this market is yet in the process of changing from bearish to bullish.
In fact, I would argue that the data would suggest things have gotten worse globally!
And we have not seen any of the traditional signs we expect to see when a bottom is forming.
But when we do, rest assured we will share it with you here.
We’ll dig into all of this and more next week.
If you have any questions or have been considering hiring an advisor, then schedule a free consultation with one of our advisors today. There’s no risk or obligation—let's just talk.
Tags

Free Guide: How to Find the Best Advisor for You
Get our absolutely free guide that covers different types of advisory services you'll encounter, differences between RIAs and broker-dealers, questions you’ll want to ask when interviewing advisors, and data any good financial advisor should know about you and your portfolio.
