
Related Blogs
June 9, 2023 | Avalon Team
If you want to know what direction the S&P 500 index is likely to take, you simply need to look at what are (arguably) the most important charts to watch.
Now we have no idea what’s in store for the markets next, and neither does anyone else.
But what we’ve discovered from years of tracking sector rotation is there are tips and tricks to be had, so today I’m going to give you a quick cheat code that will help you focus on what to watch right now.
Let’s look at the most important sector to follow, the biggest sectors to follow, and the sector that’s most correlated to the S&P 500.
Because by understanding these charts, you’ll have a pretty good idea of what to expect from the S&P 500 in the weeks and months to come.
Let’s set the stage with a quick review of the index itself – the S&P 500.
Below is the S&P 500 looking at monthly closes. We call this the 30,000-foot view because it makes it easy to identify an uptrend or a downtrend or a sideways consolidation.
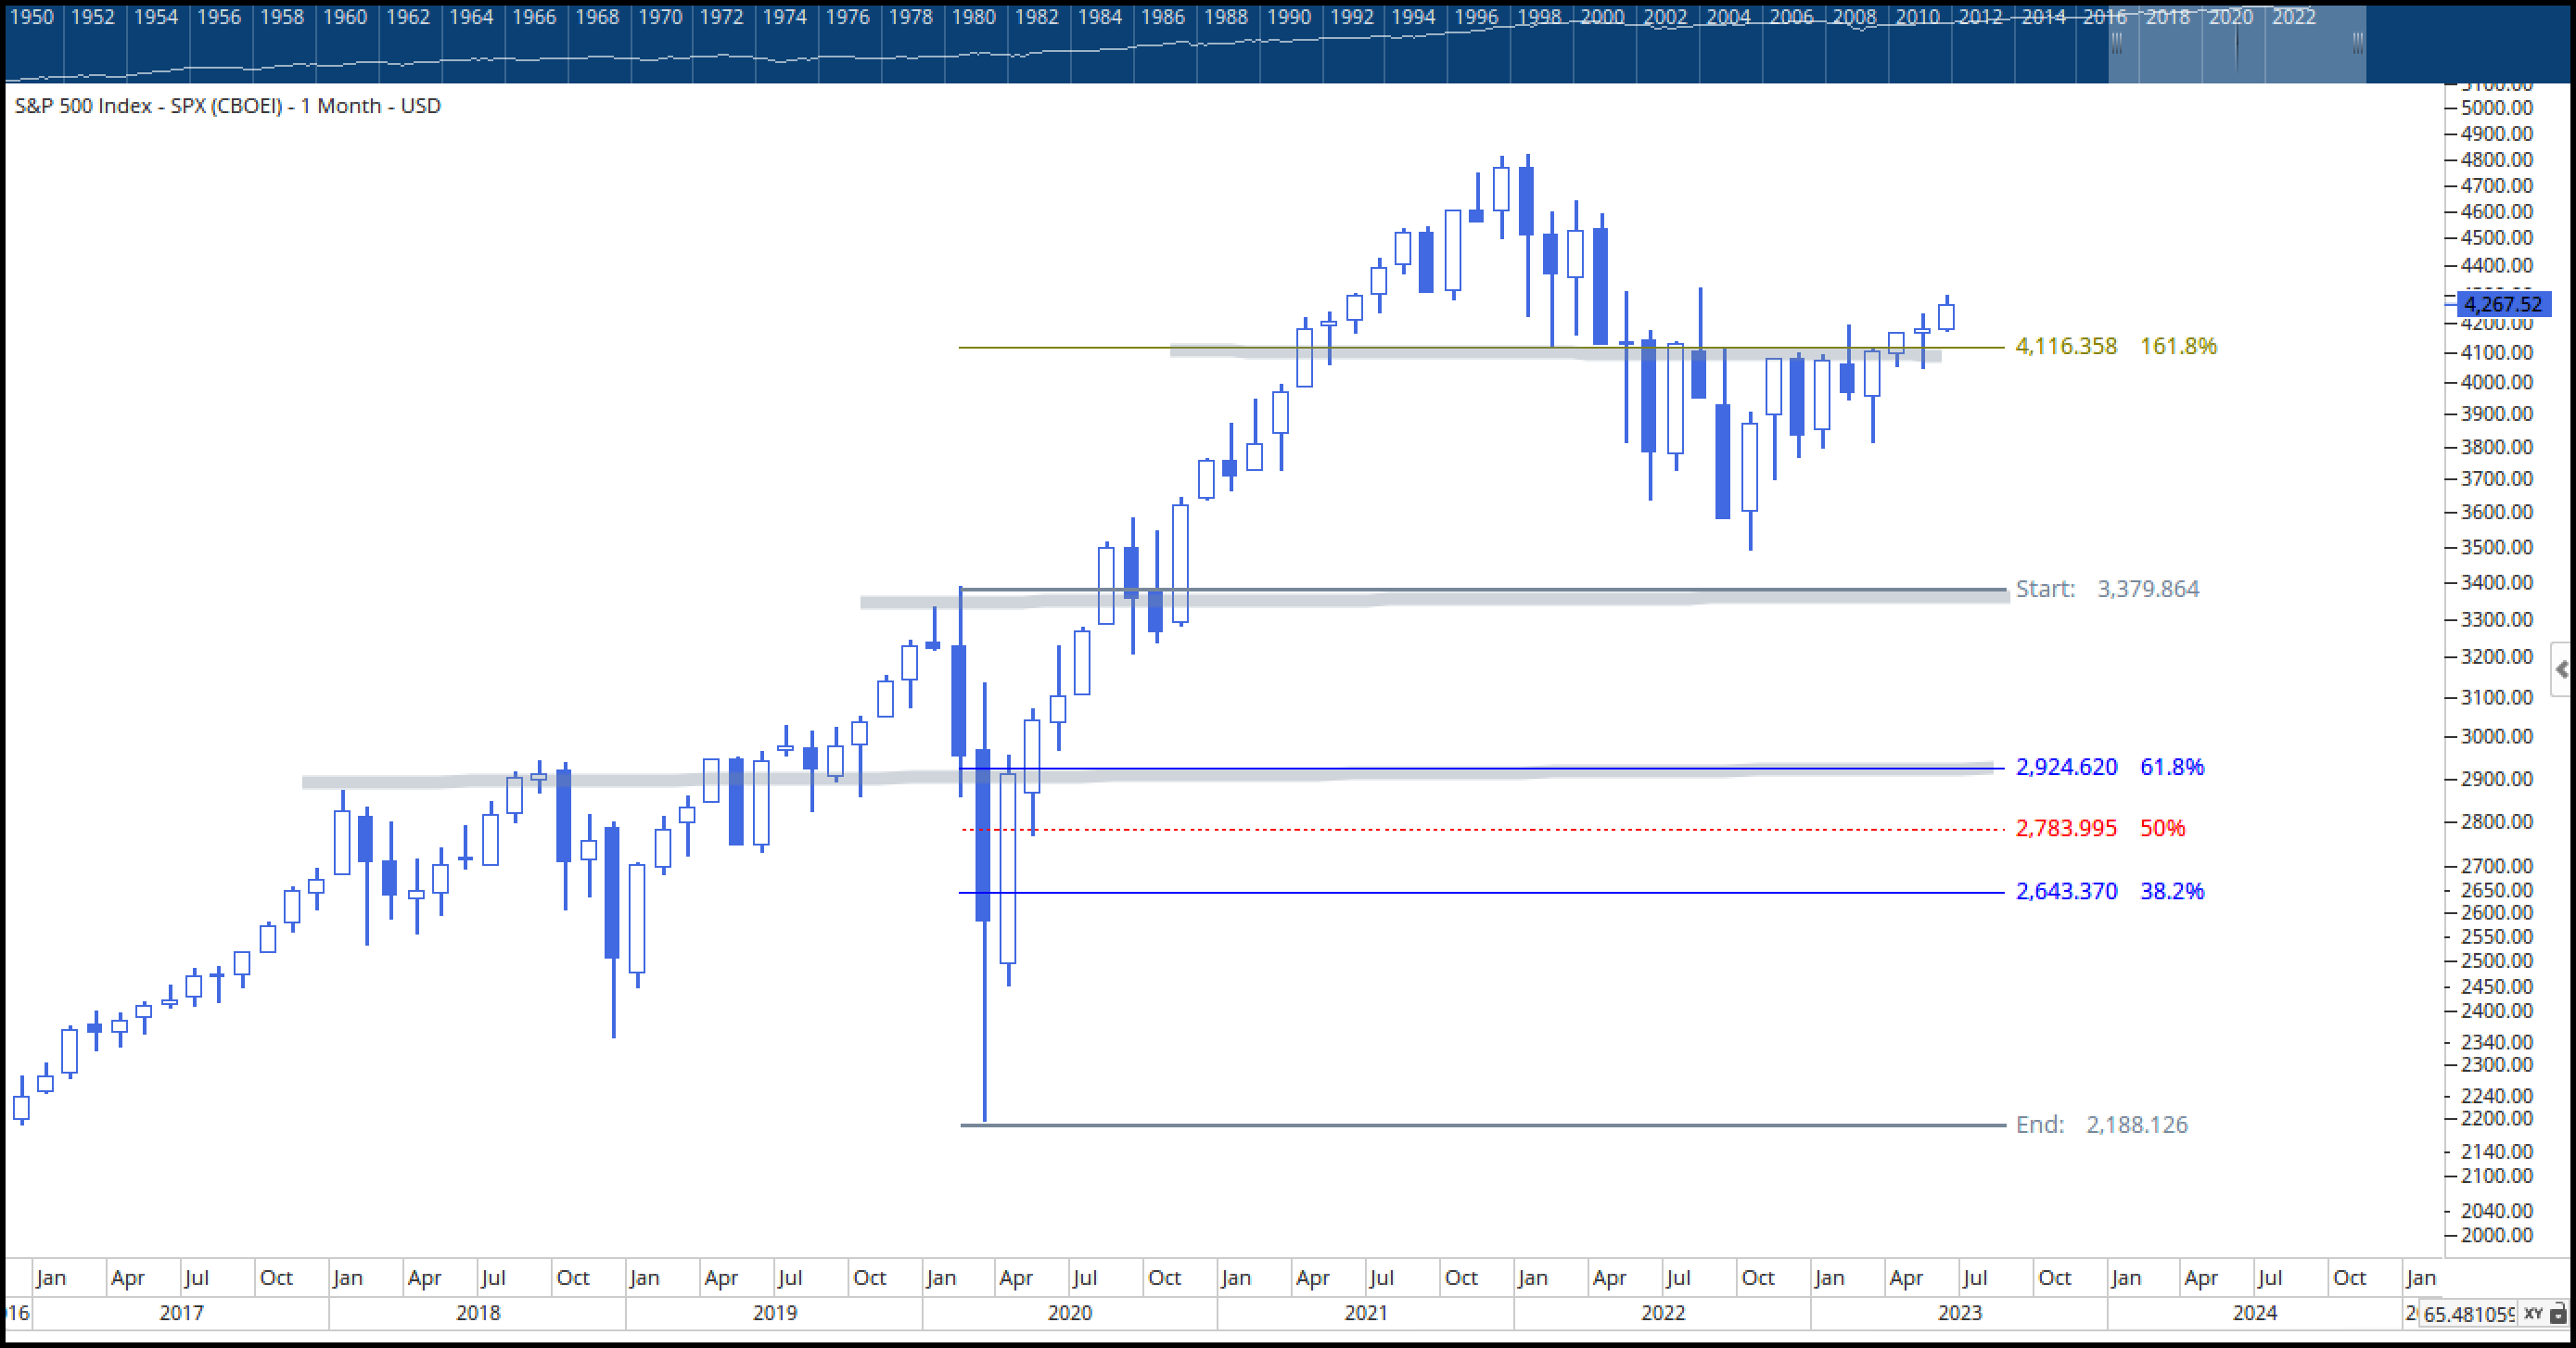
Each one of those candles represents one month of data. Since the October low, the S&P 500 has been in an uptrend. That’s a fact – price doesn’t lie.
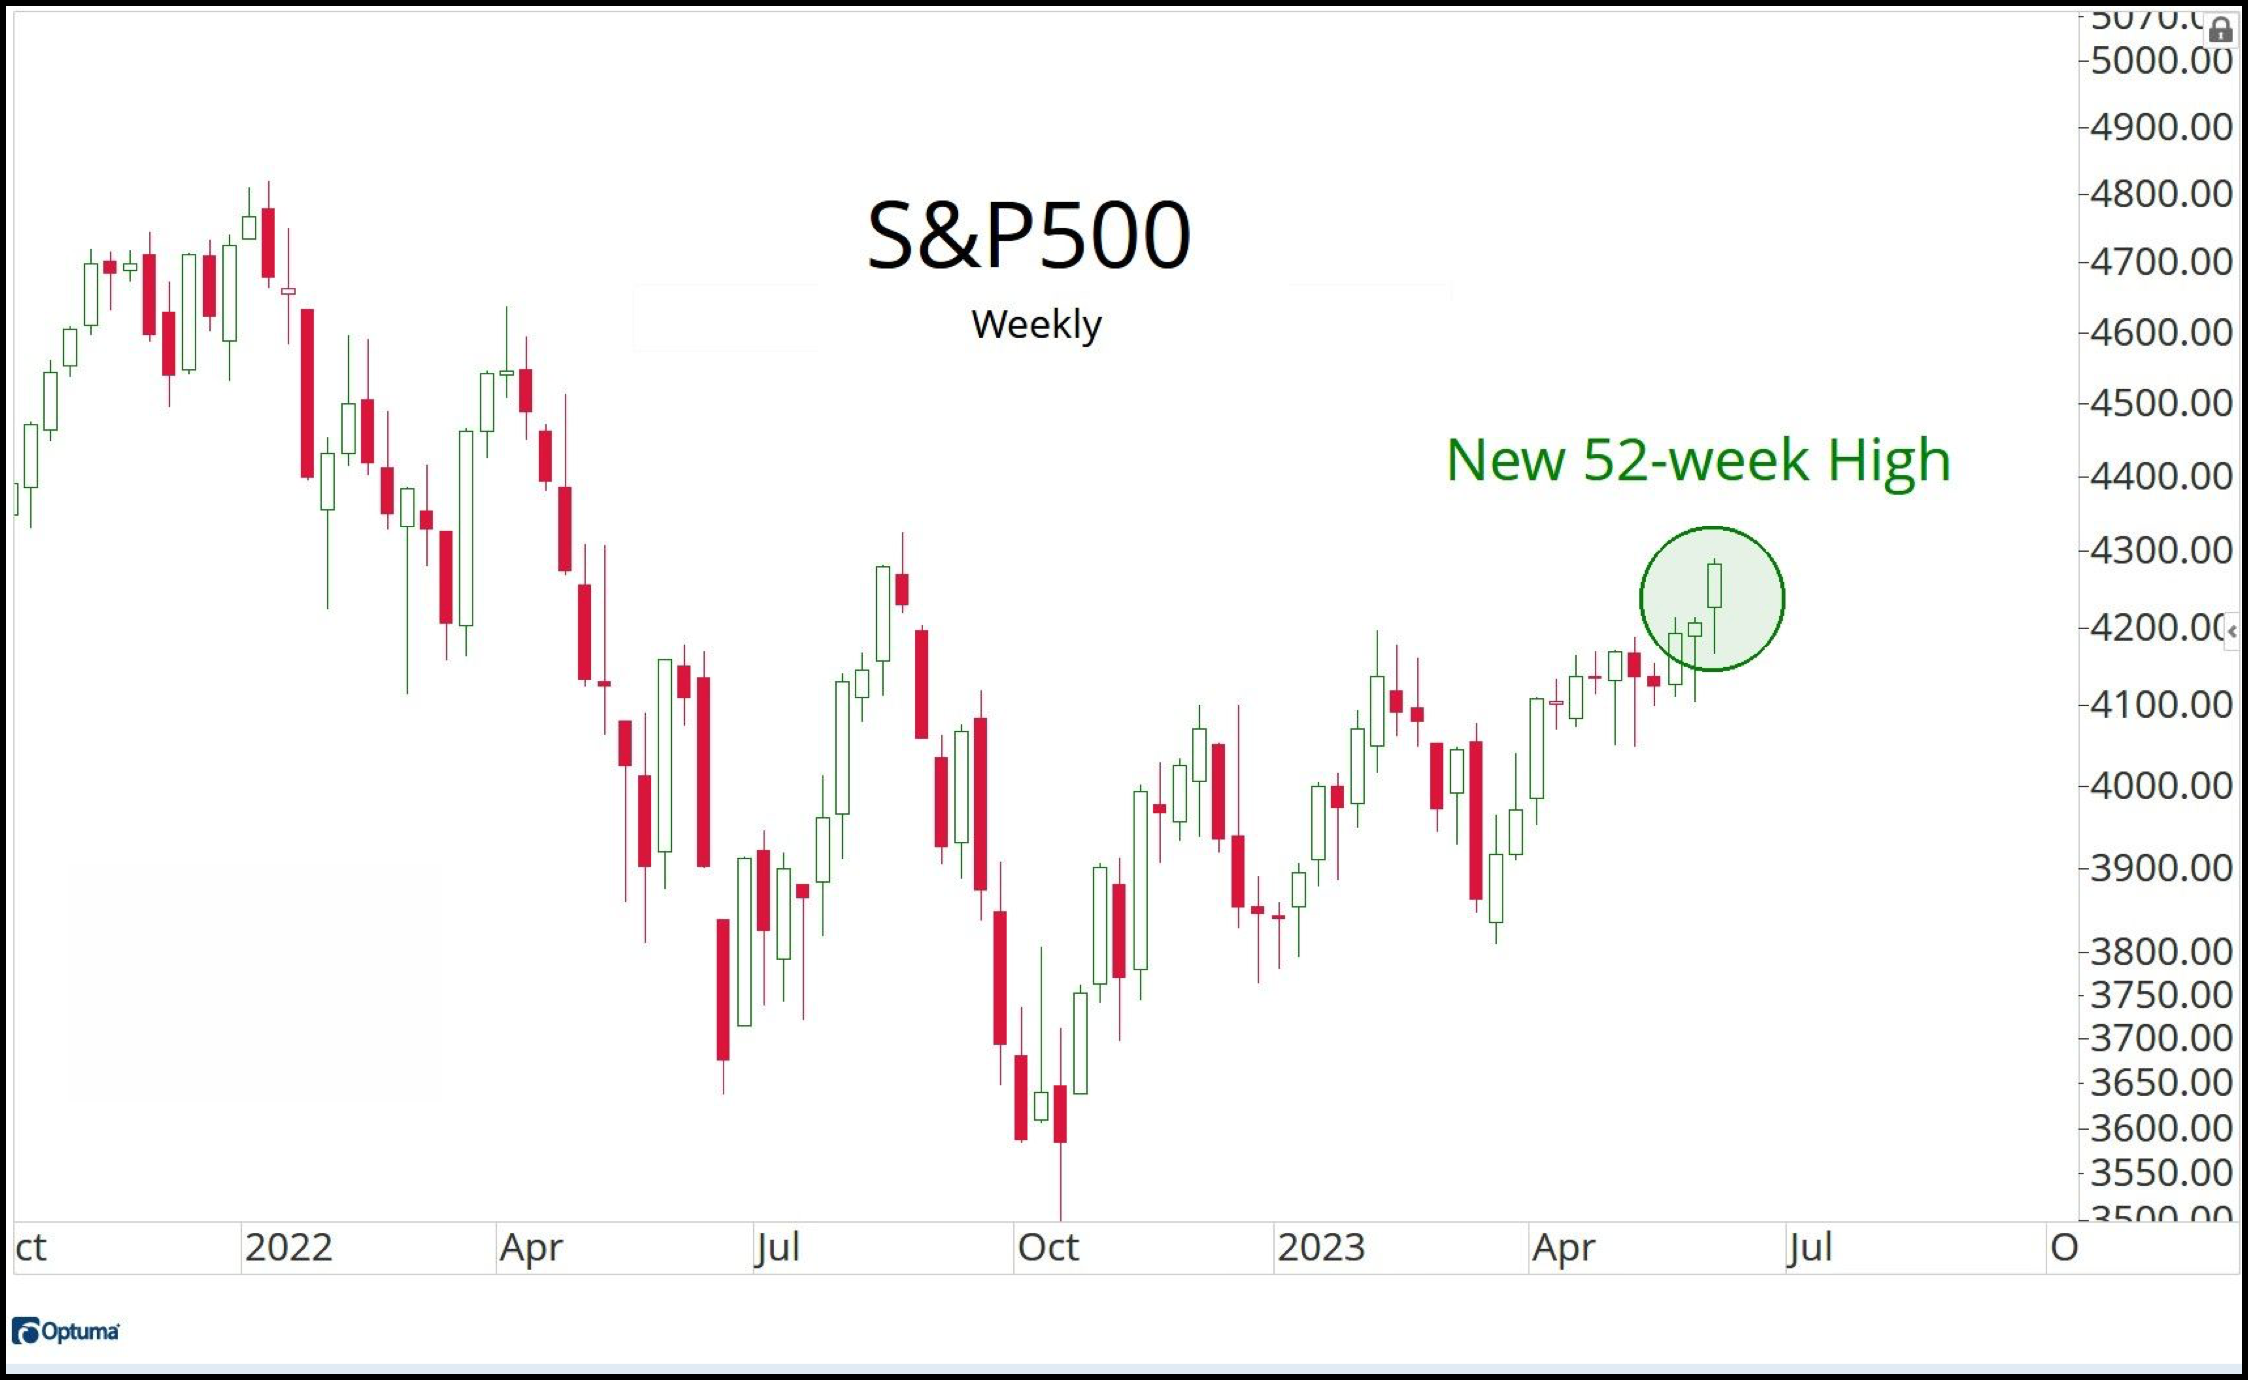
Next, we’re zooming in on the S&P 500 using a weekly timeframe.
Still looks like an uptrend. We could make the argument it’s been sideways-looking, but since the October low, it’s still an uptrend.
But what’s happening under the surface where the important stuff is? This is where it gets interesting.
Financials may be the most important sector in the U.S.
We don’t have bull markets in the U.S. without financials at least participating.
They don’t have to lead the pack, but they need to get an invitation to the party. They need to be in the mix. And when they don’t, bad things usually happen.
See what happened back in 2007 and again in 2018 and 2020 when financials broke down? Everything else went along for the ride.
Now financials are holding above a very key level. Resistance turned to support.
As long as financials (XLF) can hold above the 2007, 2018, and 2020 highs, then check one for the bulls.
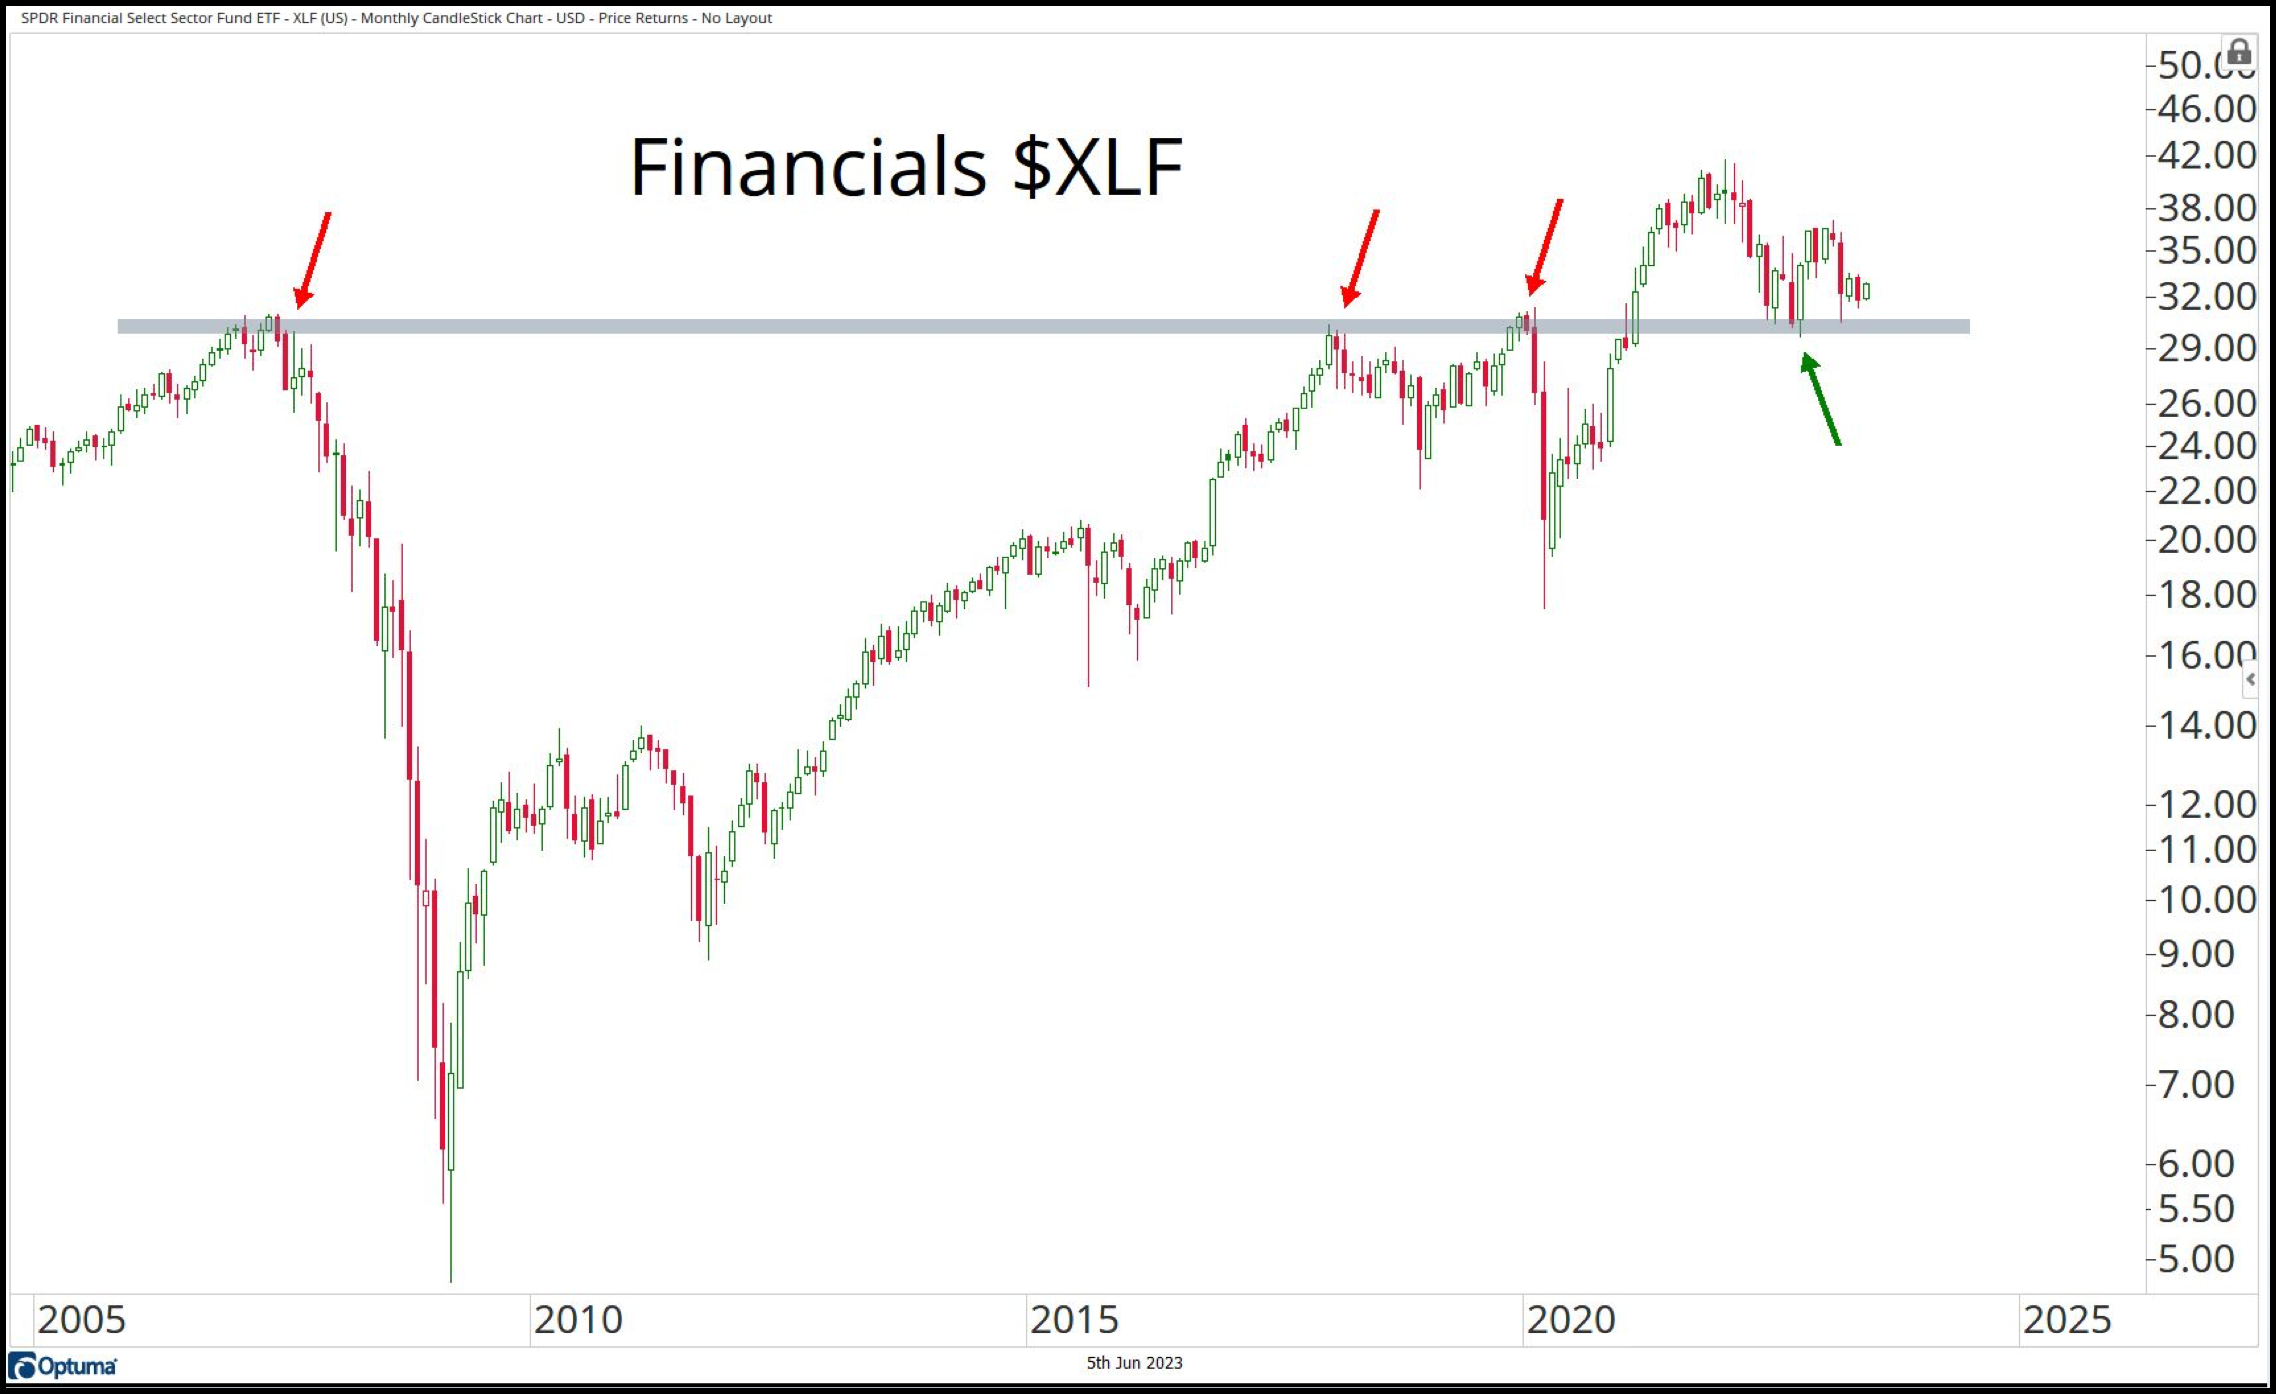
We can see a retest of that critical price level last October, and bouncing higher.
So, if the most important sector of the S&P can dig in and do what they need to do, that data goes a long way to support the argument that this bull has legs and the index can continue higher.
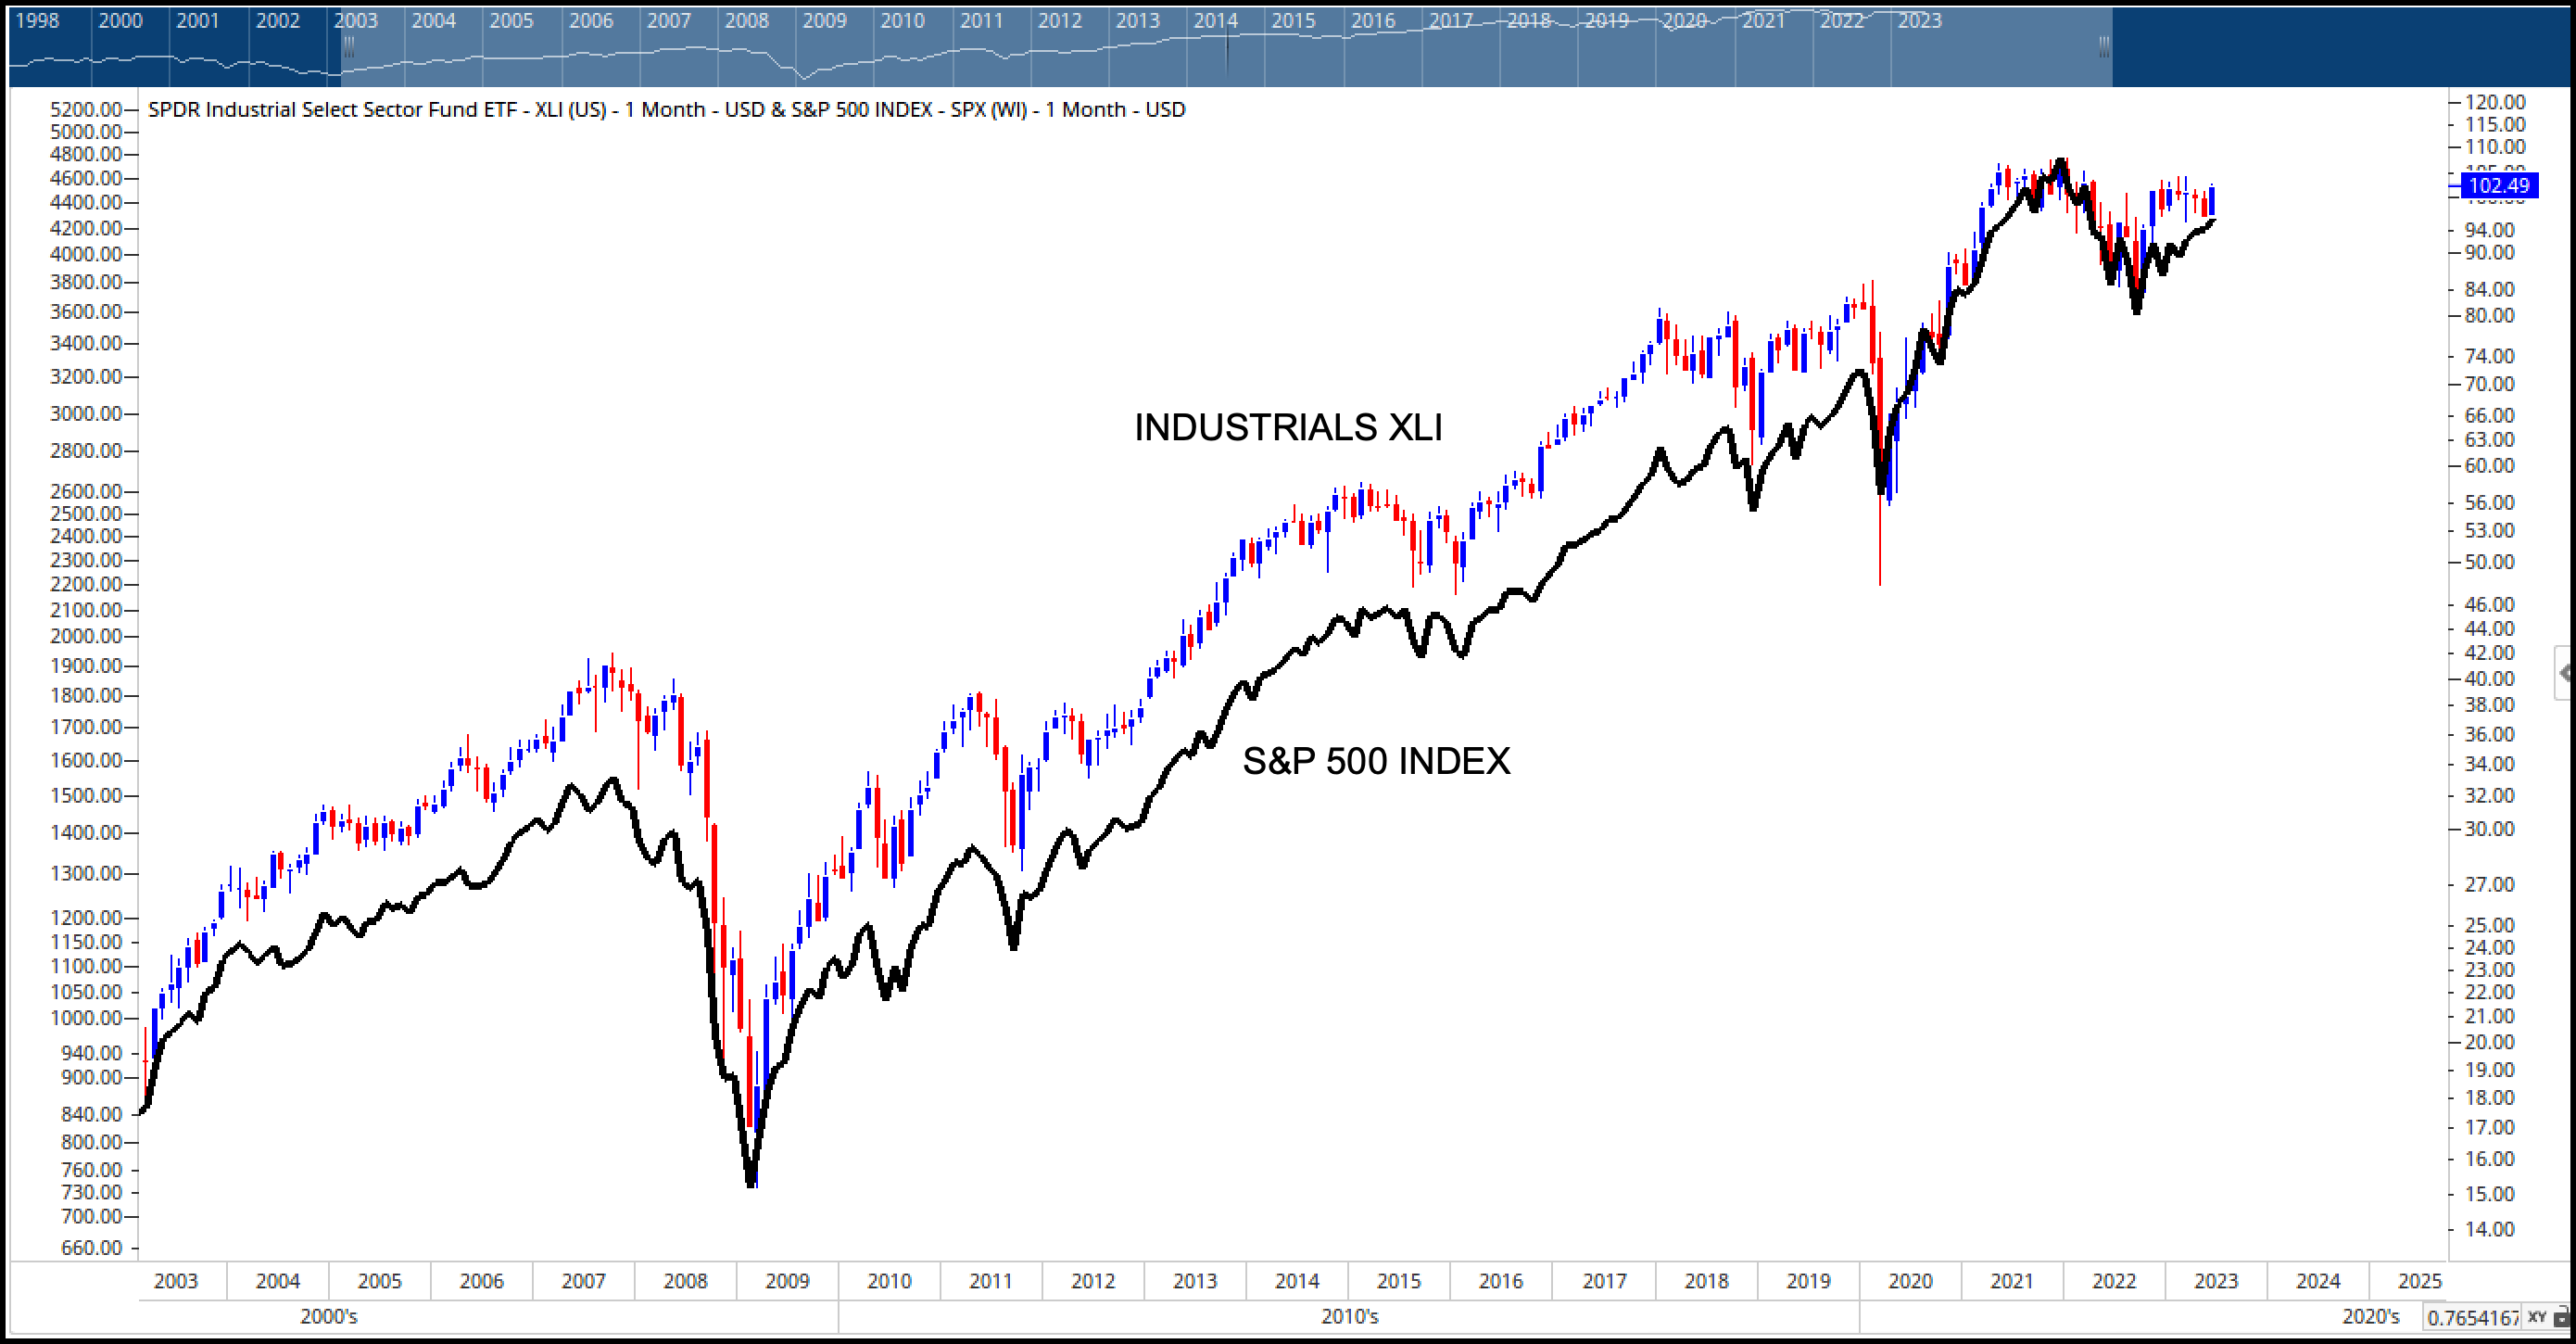
How about the sector that is most correlated to the S&P 500 index – this sector has a little bit of everything in it and tends to track right along with the S&P: Industrials.
Below is a price chart of Industrials (XLI) with an overlay of the S&P 500. They move in lockstep, so if industrials are moving higher, it’s a pretty good bet the index is as well.
Let’s wrap up with the two sectors that combined represent a full 40% of the S&P 500 index: Technology and Healthcare.
The Tech sector makes up 26% of the S&P 500, and has been on an absolute tear, gaining 33% on the year and pressing up against all-time highs. This has dragged the entire index higher.
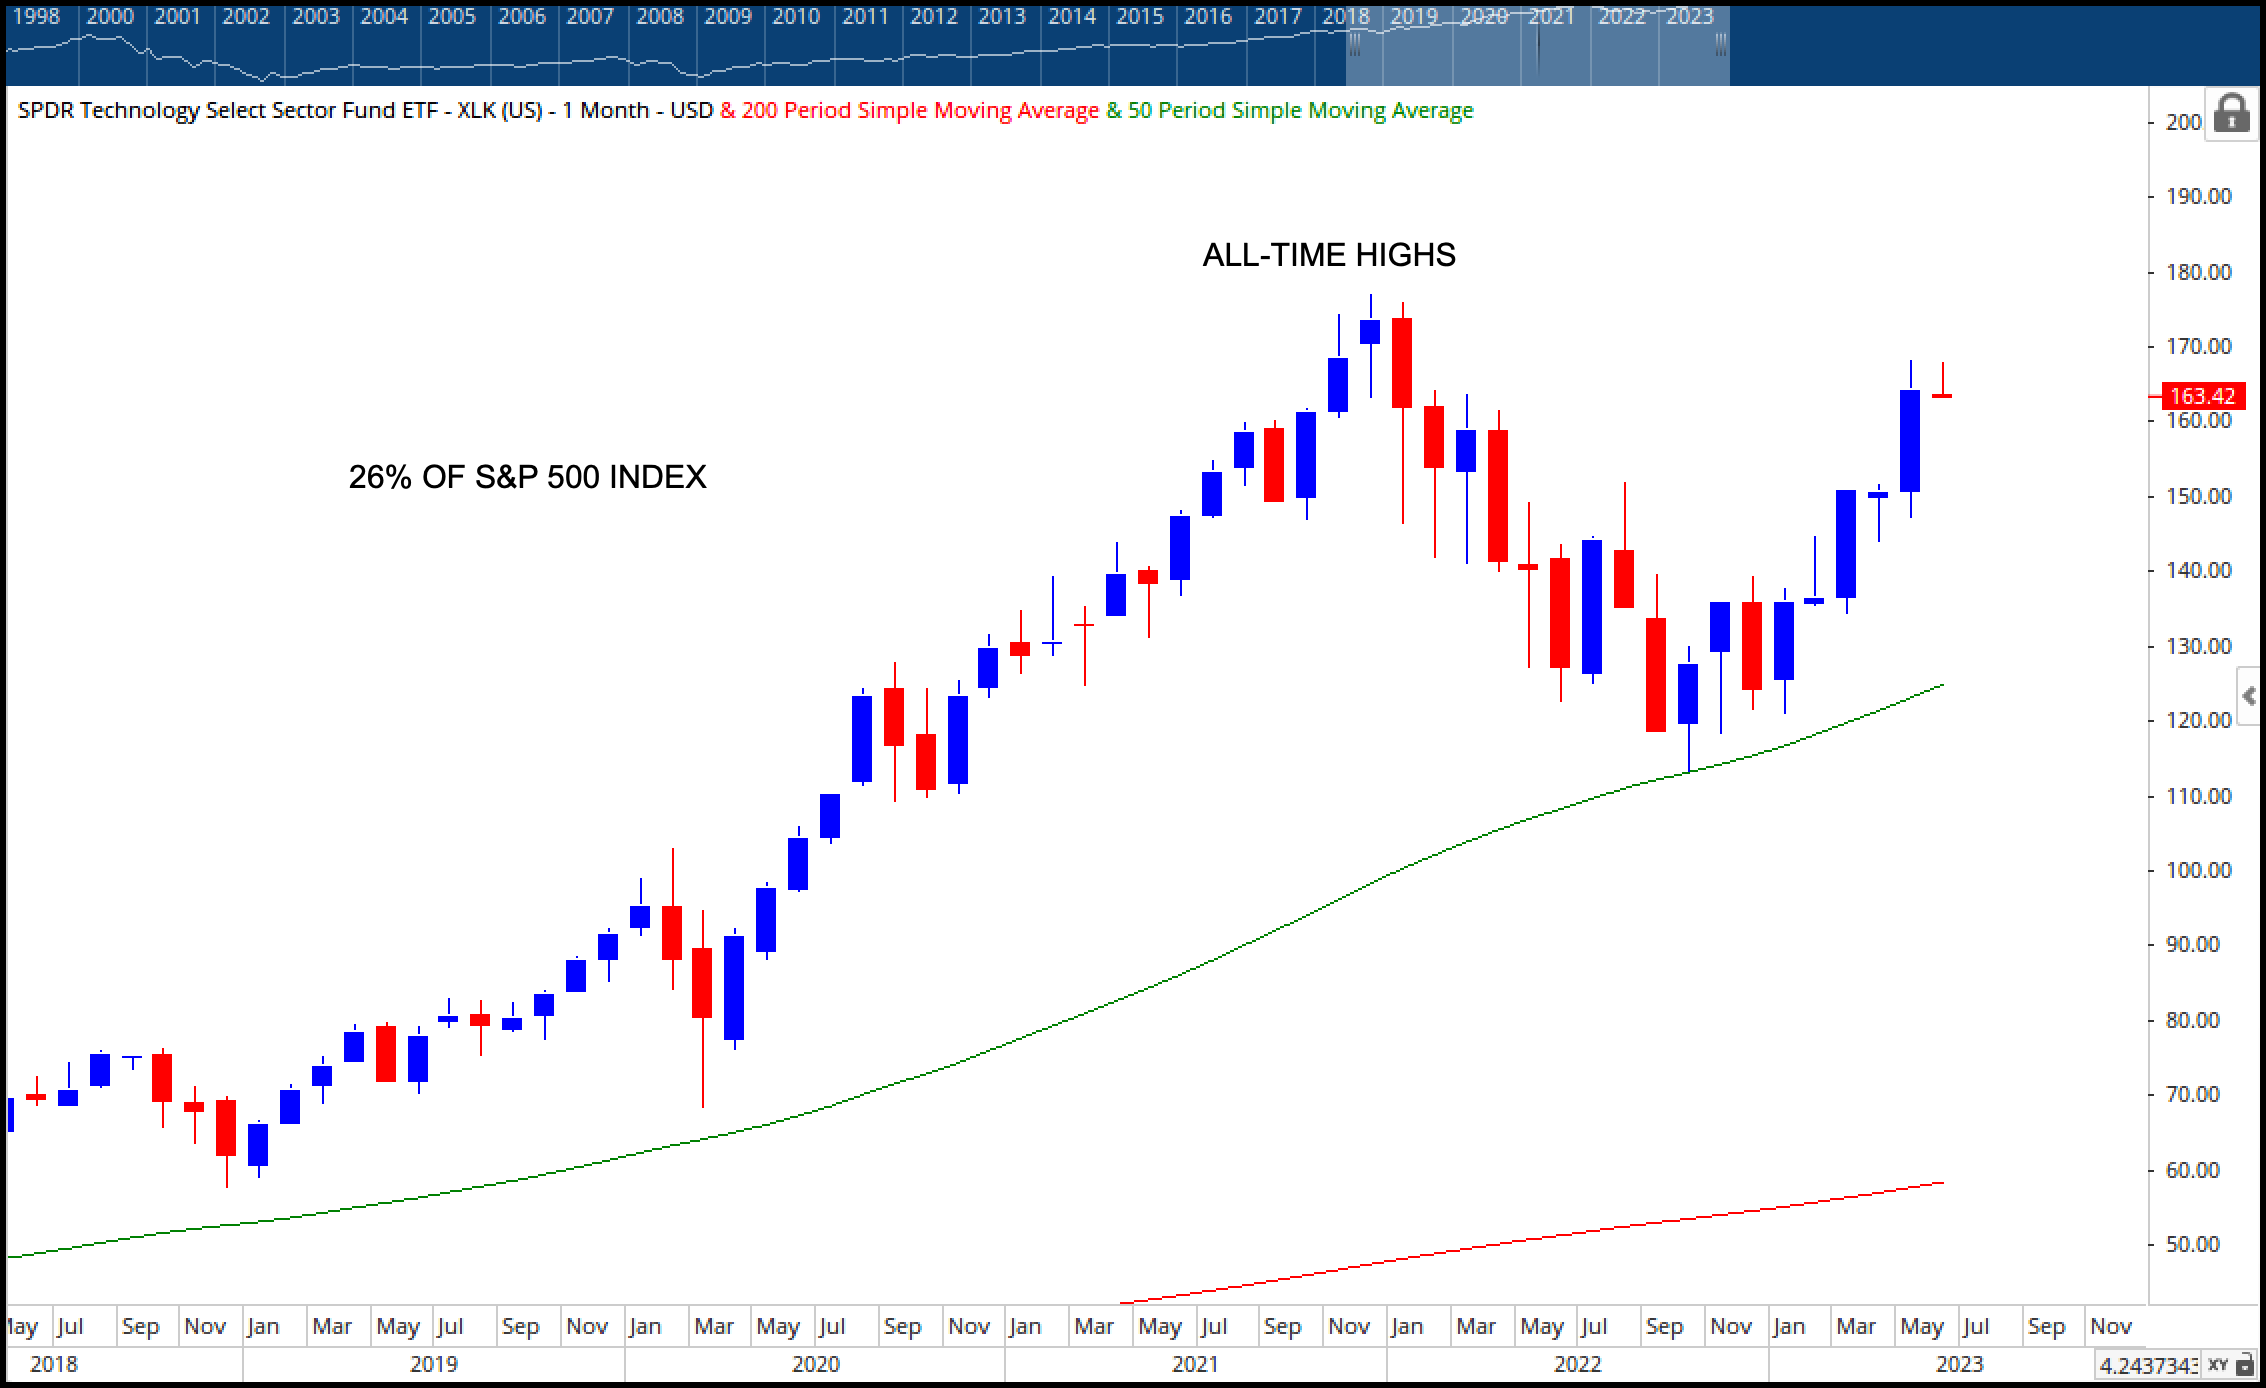
In bull markets we expect the growthy areas to outperform, and that’s what we’re seeing.
2022 was the year of value over growth – 2023 ushered in the rotation back to growth.
This kind of rotation is the lifeblood of a healthy market.
Now there’s still work to do in terms of broader leadership, but this is a bullish sign.
Then there’s healthcare, which comprises 14% of the S&P 500 so you’d better know how it’s doing.
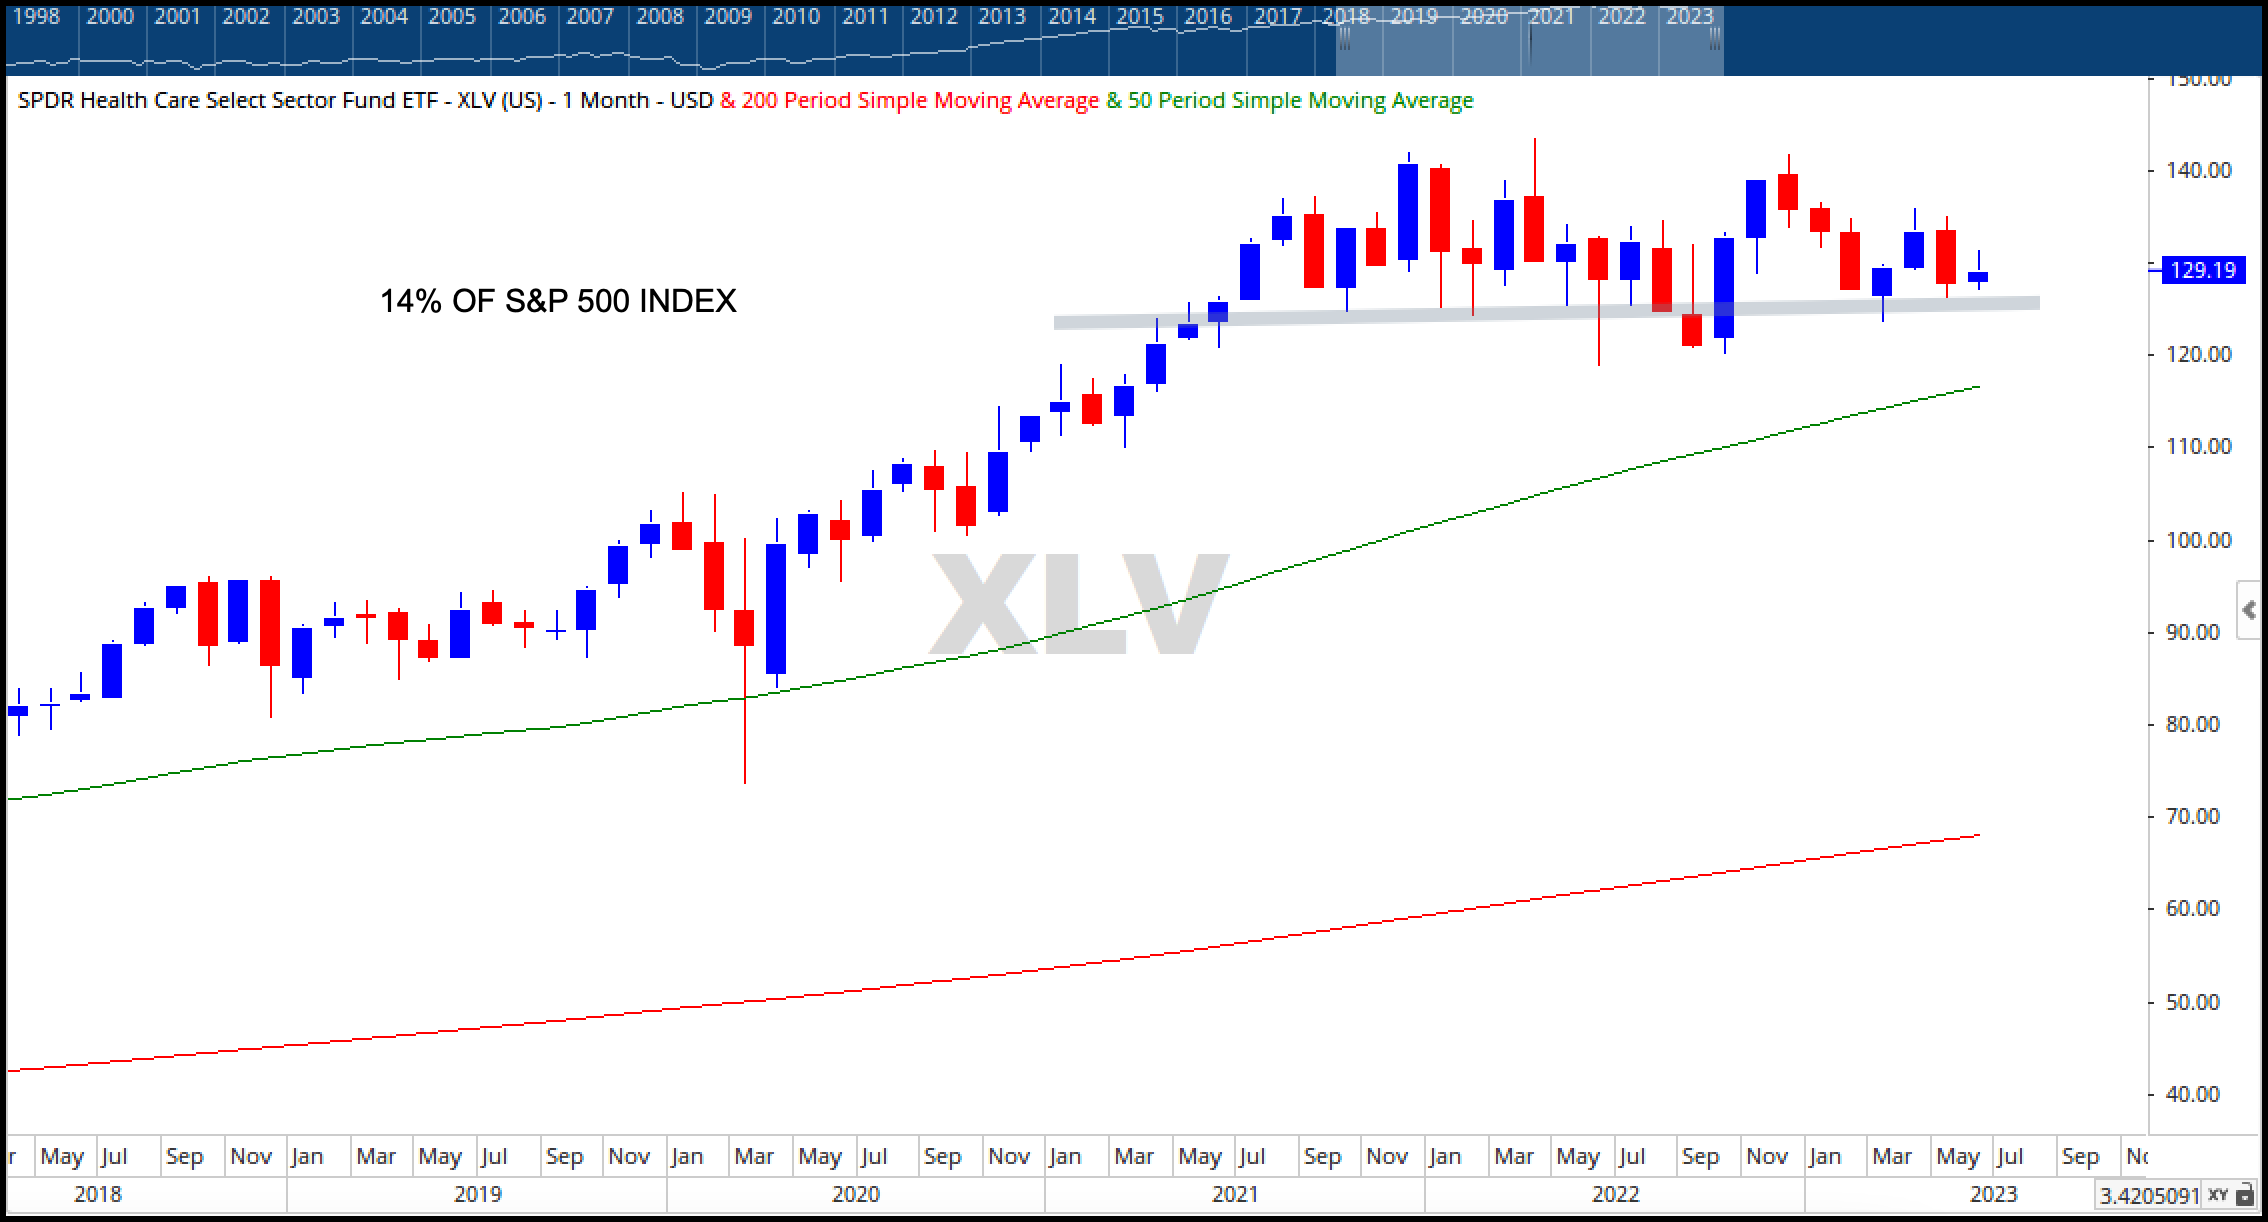
XLV isn’t making the same kind of noise that Tech has this year, but what’s important is what healthcare isn’t doing.
It isn’t breaking down. It’s not in a downtrend. Sector consolidation is normal and healthy.
So what do these charts collectively tell us?
- The S&P remains in an uptrend based on its own price chart.
- Financials remains above key levels of support.
- Tech and Healthcare, representing 40% of the entire index, remain healthy.
- Industrials are not showing signs of a breakdown.
The weight of the evidence remains with the bulls – at least at this juncture.
Things are always subject to change, which is why you must stay on top of the charts looking for any significant reversals.
Now, I’m not advocating that you dismiss evidence pointing toward a future recession…
Can that happen? Sure it can. It’s just not happening today.
So, until next time, invest wisely, and don’t forget proper risk management!
If you have any questions or have been considering hiring an advisor, then schedule a free consultation with one of our advisors today. There’s no risk or obligation—let's just talk.
Tags

Free Guide: How to Find the Best Advisor for You
Get our absolutely free guide that covers different types of advisory services you'll encounter, differences between RIAs and broker-dealers, questions you’ll want to ask when interviewing advisors, and data any good financial advisor should know about you and your portfolio.
