
Related Blogs
April 4, 2022 | Avalon Team
 Good portfolio management begins and ends with risk management.
In last week’s ADAPT, we discussed the importance of understanding maximum drawdown, a key stat that can determine the likelihood that an investor can stick with an investment strategy through both good times and bad…
And why it’s important to keep that number as low as possible.
Today we’ll cover two more performance metrics that will help you make sure that your investment strategies are performing as well as they should be given the level of risk that you are taking.
The Sharpe Ratio
The Sharpe Ratio is a mathematical formula that measures the performance of an investment relative to its assumed risk. It can also be useful when comparing two investment choices as, all else being equal, the investment with the higher Sharpe ratio is the better choice.
The Sharpe Ratio answers a fundamental question: How much return is provided per unit of risk being taken?
In other words, does the investment pay enough return for the risks being taken?
An investment with a lower return but with low risk may actually be a better choice than an investment that offers a higher return but also a much higher risk.
Formulaically, the Sharpe Ratio is the expected returns of an asset, minus the risk-free rate, divided by the standard deviation of excess returns, which is a measure of volatility.
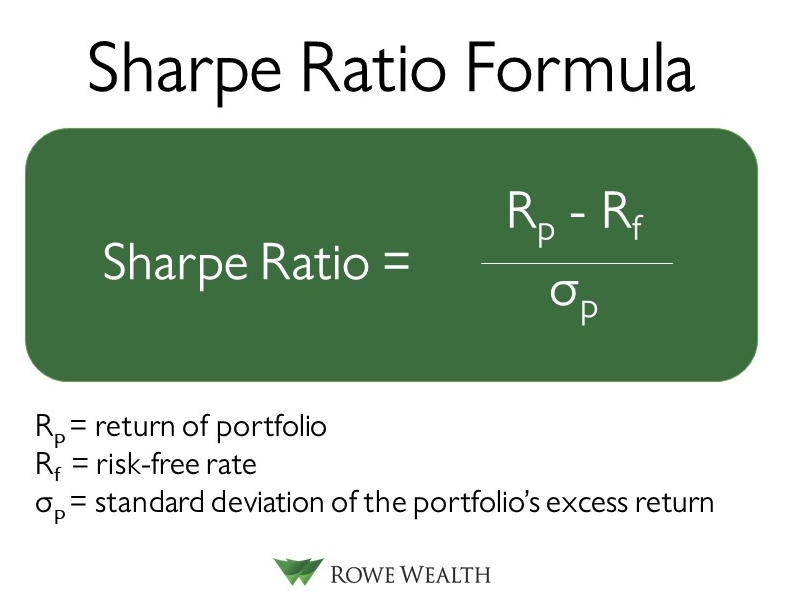
I know that may sound confusing, so let’s look at an example.
Currently, money markets offer a minuscule risk-free rate of return of around .20bps. We’ll use that for the risk-free rate of return.
The current volatility on the S&P 500 is about 19.7% This number is calculated by annualizing the daily standard deviation of returns.
If we assume the 7.2% historical annual return on the S&P 500, then the Sharpe ratio is:
[7.2% – 0.20%]/19.7% = .36
So now we have the Sharpe Ratio for an investment such as the SPY.
(Note the importance of the inputs. A higher risk-free rate of return will decrease the Sharpe Ratio as will an increase in volatility, all else being equal. A lower expected return will also decrease the ratio.)
Since a Sharpe Ratio can be calculated on any investment, it makes it easy to compare risk-adjusted returns. Here are a few comparative ratios of popular ETFs and mutual funds:
SPY (S&P 500) : 0.37
AGG (Aggregate Bonds): 0.46
EEM (Emerging Markets): 0.42
EFA (International stocks): 0.30
VTI (Vanguard Total Stock Market): 0.47
FCNTX (Fidelity Contrafund): 0.51
(Period 2000-2022)
Now with an understanding of the Sharpe Ratio, will we move on to another way of measuring the risk-adjusted return of an investment.
The Sortino Ratio
The Sortino Ratio also measures the risk-adjusted return of an investment or portfolio, but with one important adjustment – the Sortino only measures the risk-adjusted returns that occur below a targeted rate of return (often the risk-free rate of return).
While with the Sharpe Ratio, all volatility – both upside and downside – is measured the same, with the Sortino Ratio, only downside volatility is measured.
Since most investors are happy with “upside volatility” when it occurs, the Sortino is believed by analysts to be a better gauge of downside risks.
As with the Sharpe Ratio, the higher the number the better when comparing Sortino ratios among investments.
Putting It All Together: Maximum Drawdown, Sharpe, and Sortino Ratios are all ways for investors to gauge the “quality of the ride” of an investment strategy and provide a new set of optics beyond just looking at return.
Contrary to common Wall Street advice, an investor does not need to take on elevated risk to earn a higher return.
With good downside risk management (which lowers the downside standard deviation) the resulting Sharpe and Sortino ratios can be more than double that of an unmanaged (passive) index.
As an example, I will demonstrate the released Volatility Resistant Model which actively manages against large drawdowns.
Here are the current stats.
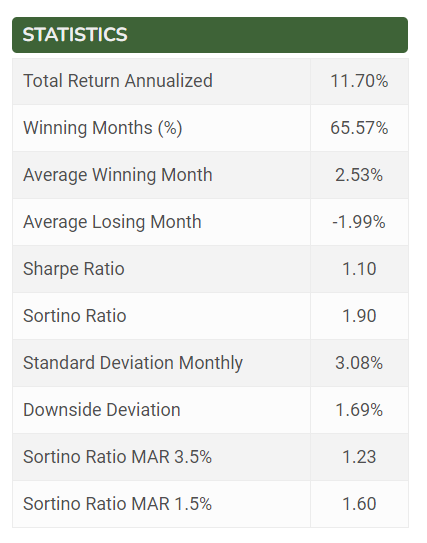
Note the Sharpe Ratio is 1.10 and the Sortino Ratio is 1.90, both very high compared to many of the mutual funds and ETFs that investors have to choose from.
On a risk-adjusted return basis, the strategy delivers nearly 3X the return of a passive investment in the SPY.
Again, such results are not difficult to achieve if active risk management is in place, so make sure you’re setting yourself up for success.
If you have any questions or have been considering hiring an advisor, then schedule a free consultation with one of our advisors today. There’s no risk or obligation—let's just talk.
Tags

Free Guide: How to Find the Best Advisor for You
Get our absolutely free guide that covers different types of advisory services you'll encounter, differences between RIAs and broker-dealers, questions you’ll want to ask when interviewing advisors, and data any good financial advisor should know about you and your portfolio.
