
Related Blogs
March 14, 2022 | Avalon Team
We’ve been doing our fair share of talking about Commodities lately, and how the Commodities market has been exceptionally strong coming off the 2020 Covid lows…
So strong in fact, that no other asset class has been stronger. But Commodities aren’t the only asset class investors will consider.
Pick up any textbook teaching market and trend analysis and you’ll find a chapter dedicated to understanding the “primary asset classes” consisting of Stocks, Bonds, Currencies, and yes, Commodities.
That’s four asset classes. But, as many of you may know, we consider markets to consist of six asset classes, rather than four.
We break stocks into two groups – Domestic and International, allowing us to further define areas of strength and/or weakness.
And because we measure the aforementioned asset classes versus cash on a relative basis, we consider Cash the sixth asset class.
Through analysis of these asset classes and the relationship between them (intermarket relationships), investors can gain helpful insights into where market strength and weakness may be found…
Some even refer to this as their “market edge”…
With that as our backdrop, let’s break down the current major market themes.
To sum up, since peaking in the first half of last year, most risk assets have been stuck in sideways consolidations.
What are risk assets? Let’s define them as anything “growthy.”
Markets have become increasingly messy with very few consistent leadership trends pointing toward risk assets (growth).
And when looking at U.S. equities, this market is as bifurcated as it’s been in years.
Some stocks and sectors are in uptrends or at least holding their own, while other stocks and sectors are getting smashed.
Stocks and other risk assets are literally moving in opposite directions.
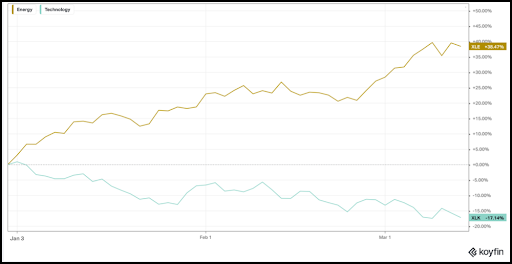
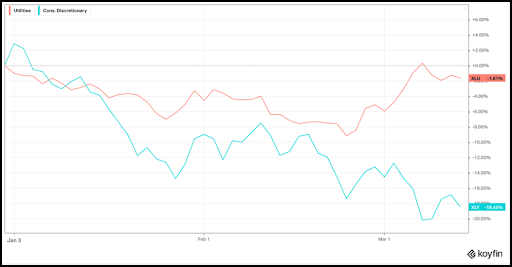
On the sector level, the difference between Energy and Technology or the difference between Utilities and Consumer Discretionary stocks both exemplify this bifurcated market.
Energy is up over 38% year to date, Utilities are holding up, down just over 1%, while Tech and Consumer Discretionary Stocks are getting crushed, down over 17% and remain in downtrends.
Energy stocks vs. Technology stocks:
Utility stocks vs. Consumer Discretionary stocks:
And when we look at markets through the lens of intermarket relationships, specifically risk-appetite ratios (Relative Strength ratios comparing growth assets vs. defensive assets), we’re not getting a very clear picture for a directional bias.
Many of these ratios are still stuck in the same ranges they’ve been in for the better part of 12 months.
Here’s what I mean – check out these four intermarket ratios, one each from Stocks, Bonds, the Currency market, and the Commodity space. They all look very much the same.
So, whether we’re looking at High Beta vs. Low Volatility stocks, High-Yield Bonds vs. Treasuries, the Aussie dollar vs. the Japanese Yen, or Copper vs, Gold, they’re all consolidating in ranges.
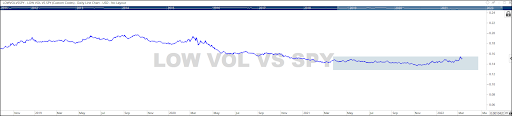
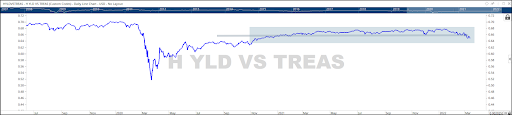
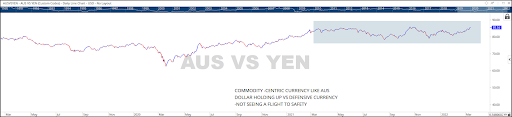
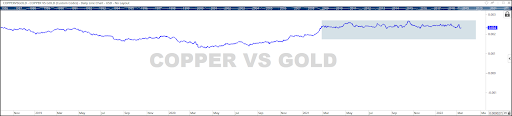
Regardless of which asset class we’re analyzing, they’re all sending the same signal – sideways consolidations.
A lot of the ratio charts we track started going sideways early last year, and they are still going sideways today.
There is no clear directional signal to share. These charts are just confirming what we’ve seen from stocks throughout 2021 and now into early 2022.
So what’s the take here?
I’m sorry to say it but messy for longer… The bias remains neutral.
You may not like the message… I get it, but not everything is always black and white.
Do you want the truth or do you want what feels good?
Why do you think we’ve been leaning so hard into Energy and Commodities? They’ve been the only thing working!
You know what else works? Cash. It’s an asset class.
And trying to force a trade in a market like this can be a frustrating and costly endeavor.
See the market clearly and invest accordingly. And keep in mind what we’re up against.
Rising interest rates, rising inflation (at 40-year highs), and the Fed removing liquidity from the system – we’re seeing all this for the first time in over a decade.
None of that is going away anytime soon.
And let’s not underestimate the impact of a very unsettling geopolitical environment.
Check back on this one because when one of these risk appetite ratios makes its move, the others are likely to follow – then you’ll have your directional bias.
If you have any questions or have been considering hiring an advisor, then schedule a free consultation with one of our advisors today. There’s no risk or obligation—let's just talk.
Tags

Free Guide: How to Find the Best Advisor for You
Get our absolutely free guide that covers different types of advisory services you'll encounter, differences between RIAs and broker-dealers, questions you’ll want to ask when interviewing advisors, and data any good financial advisor should know about you and your portfolio.
