
Related Blogs
March 17, 2022 | Avalon Team
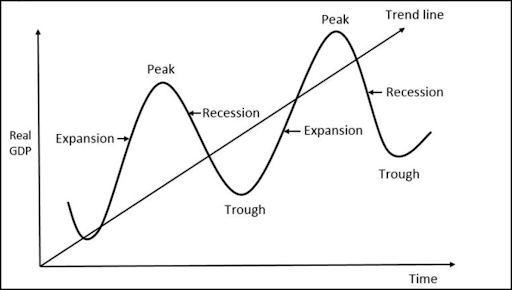 Over the centuries, the American economy has gone through repeated up and down cycles. From expansion to contraction and back again.
Some of these cycles were muted and went virtually unnoticed, while others have been dramatic and painful – like the Great Depression of the 1930s, the runaway inflation that marked the 70s, and the Financial Crisis of 2008.
However, during every cycle, expansion, peak, or contraction, like clockwork, some asset classes and sectors are usually “the place to be.”
Investors who understand these cycles are giving themselves a better shot at outperforming their peers.
Intermarket analysis is the tool to see, in real-time, the rotation that takes place between stocks, bonds, and commodities at major turning points in the business cycle.
For example, did you know that Stocks usually peak after Bonds?
As cycles go, Bonds peak first and mark major turning points in the market cycle.
Rising interest rates – and the fear of even higher rates – eventually cause Stocks to peak.
And typically, the main factor pushing rates higher is a strong surge in Commodity markets, oil in particular. This is often caused by some kind of shock to the supply chain.
For example, in the 1970s an oil embargo caused a disruption to the supply chain – does anyone remember the fuel shortages and only filling your tank based on odd or even license plate numbers?
This isn’t just a history lesson… this is playing out before your very eyes!
Look at the chart below – it does a good job of showing the rotation of price strength that rotates between Stocks, Bonds, and Commodities.
In this chart Bond prices, Stock prices, and Commodities can be seen rotating from strength to weakness beginning with Bonds, followed by Stocks, and ending with Commodity prices surging last.
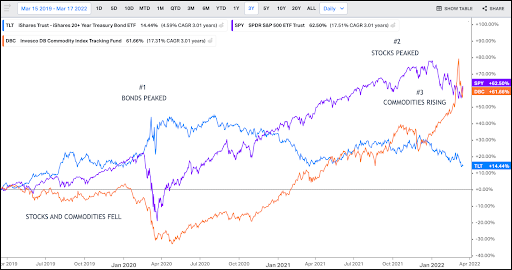
The blue line shows Treasury Bond prices peaking during 2020 at the height of COVID fears – simultaneously, Stocks and Commodities sold off.
Stocks normally peak next after Bonds. The purple line shows the S&P 500 moving sharply higher off the COVID lows, finally peaking in January 2022.
The orange line represents Commodities. Like Stocks, Commodity prices moved continually higher off the 2020 lows and began to accelerate sharply late last year and have continued to rip higher ever since.
Rising Commodity prices are historically a major reason for the stock market to peak. When Commodity prices move too high, consumer spending suffers…
Then the Fed steps in and starts rising interest rates to combat that inflationary spiral… that normally causes the economy to slow, which often, but not always, leads to a recession.
So that’s the big picture, but let’s dig a little deeper…
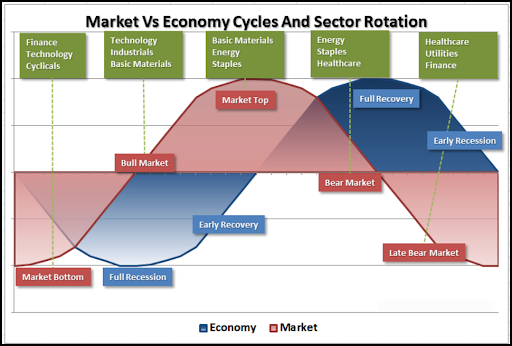
Just as asset classes rise and fall in terms of strength or weakness, so too do sectors.
Some sectors perform better during certain phases of the business cycle, so by tracking the business cycle it’s possible to anticipate which sectors might offer the best bang for your buck – pretty cool right?
We know historically that Energy, Consumer Staples, Basic Materials, and Utilities are traditional leaders during later expansion or early contraction of the economic cycle.
Said another way: When we see these sector groups in the lead, we have a pretty good idea where we are in the cycle.
We’ve seen this play out in cycles before.
Much like today, Energy stocks were leaders back in 1999 at the end of that cycle’s economic expansion. This was followed by a rotation to Consumer Staples (early spring 2000) that signaled the start of that cycle’s contraction.
The four top sectors during the first 10 months of the year 2000 were Energy, Consumer Staples, Utilities, and Financials.
The rotational leadership from the Energy sector to the three defensive sectors of Utilities, Financials, and Consumer Staples followed the normal rotation we’d expect to see as the economy moves from expansion to contraction.
I’m telling you this because we are in a similar setup with today’s market and today’s sector leaders.
Let the cycles be your guide.
If you have any questions or have been considering hiring an advisor, then schedule a free consultation with one of our advisors today. There’s no risk or obligation—let's just talk.
Tags

Free Guide: How to Find the Best Advisor for You
Get our absolutely free guide that covers different types of advisory services you'll encounter, differences between RIAs and broker-dealers, questions you’ll want to ask when interviewing advisors, and data any good financial advisor should know about you and your portfolio.
