
Related Blogs
May 31, 2023 | Avalon Team
In Part 1 and 2 of our Rules-Based Investing series, we reviewed the elimination of human emotion from investing and how to predict our outcomes based on expected returns.
Today, we’ll talk about one of the most important topics of all: Risk Management.
While risk management is not unique to systematic investing, a good rules-based system will include a built-in process to manage risk.
Let’s begin by defining risk.
In finance, risk refers to the degree of uncertainty about the rate of return on an asset and the potential harm that could arise when financial returns are not what the investor expected.
In general, as investment risks rise, investors seek higher returns to compensate them for taking on such risks.
I would like to propose I much simpler definition.
Risk is not having what you need when you need it.
Framing it this way does a better job of bridging the gap between financial planning and asset management.
We can break this down further into what you control (saving, spending, goals, etc.) and the results of the asset management.
Imagine for a moment, boarding a flight in L.A. bound for New York City.
Now imagine, as the wheels touch the ground, the pilot’s voice comes over the speaker and says, “Welcome to Cincinnati. I am sorry that our flight landed a little short today of our destination, but have a good day.”
Would the passengers stand for this? Never.
Yet, in financial planning, how many plans fail to reach their intended destination? And why is it any less unacceptable?
Planes fly by a programmed computer guidance system that constantly adjusts the plane’s navigation to make certain that the intended destination is reached.
Your financial plan is equivalent to the plane’s flight plan. It defines both a destination and an ETA.
Systematic investing is your plan’s guidance system, adapting and adjusting along the path.
Creating Your Personal Benchmark
A financial plan is governed by several factors.
- How much do you have today?
- How much will you need in the future?
- How much can you save between now and then?
- How much will you spend between now and then?
Whatever the difference between where you are and where you want to be, divided by the number of years remaining, defines the return needed on the assets available.
It’s really not any more complicated than that.
I like to refer to this number as your personal benchmark.
It’s the only number that you need to be comparing to every year to see if you’re on track to reach your financial goals.
Not the S&P 500 or some arbitrary benchmark that has nothing to do with your personal needs. You just need your personal benchmark.
If you’re lucky, the return required on the assets is low enough to achieve without taking undue risk with the available capital.
But regardless of the “number,” the goal should always be the same: To minimize downside losses.
The math of losses is a cruel fact of investing.
For example, if your portfolio drops by 50%, it must then grow by 100% to get back to even.
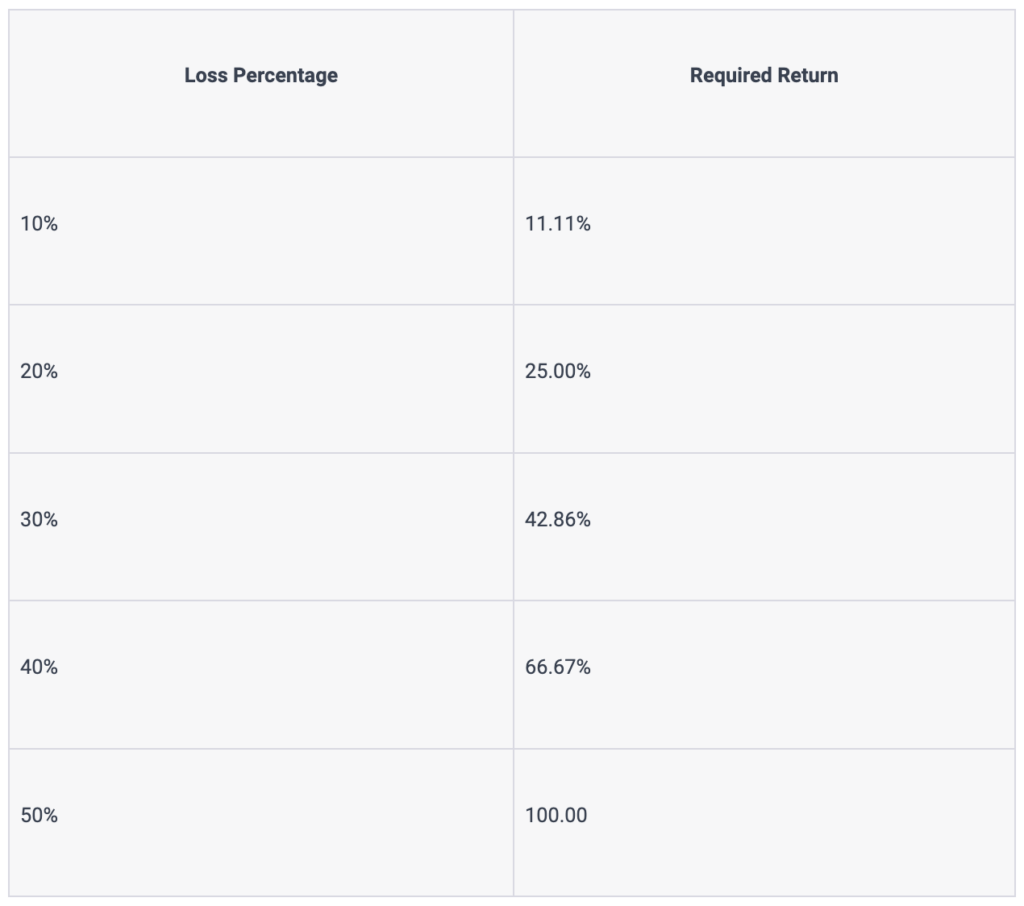
The laws of compound growth demand that losses be kept small due to the power of compounding and the effects it has on long-term returns.
Losses have a compounding effect, just like gains.
If you experience a significant loss, you not only lose the initial investment, but also the potential growth on that investment in the future.
Large losses can be challenging to recover from since the remaining capital must work harder to make up for the loss before it can start generating significant returns again.
The laws of compound growth emphasize the importance of minimizing losses to maximize long-term returns.
By keeping losses small, you preserve capital, benefit from the compounding effects of growth, reduce recovery time, manage risk, and maintain emotional stability during turbulent market conditions.
And this is where a good rules-based system can help.
When presented with an investment strategy, the first thing to look for is the risk metrics.
What has been the maximum drawdown? What are the Sharpe and Sortino ratios saying?
We should only be interested in strategies that minimize downside risk and provide a lot of return per unit of risk.
And since systematic investing allows for these details to be known in ADVANCE, it can go a long way in making sure that we’re selecting a suitable strategy to fit our needs.
Take for example, the Avalon Volatility Resistant Model (VRM).
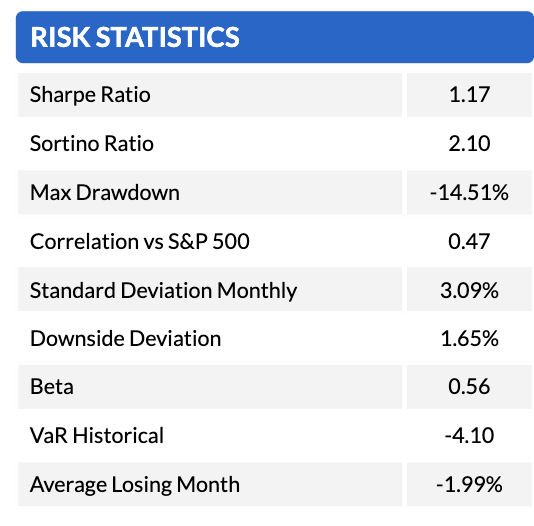
A quick glance at the risk statistics tells us everything we need to know.
The Sharpe ratio is a measure used in finance to assess the performance of an investment in relation to its risk. It provides a way to compare the return on an investment, such as a security or portfolio, with the return on a risk-free asset after accounting for the investment’s risk.
The Sharpe ratio is important for several reasons.
First, it helps investors evaluate investments by considering both their return and risk. By looking at the ratio, investors can compare different investments and assess which ones provide a better balance between returns and risk.
A higher Sharpe ratio suggests that an investment has generated a higher return relative to its risk, making it potentially more attractive.
As an example, the S&P 500 SPDR has a Sharpe ratio of 0.49, so the fact that VRM has over twice the value is very good.
A second benefit of studying the Sharpe ratio is that it allows investors to assess the performance of investment managers or portfolios by adjusting for the level of risk taken.
It helps determine whether an investment manager has achieved higher returns by taking on more risk or by making smart investment decisions that deliver superior risk-adjusted returns.
As important as the Sharpe ratio is, no metric is probably no more important than the Maximum Drawdown (MDD).
Imagine you have a piggy bank where you keep your savings. Sometimes the value of your savings in the piggy bank goes up, and sometimes it goes down.
Maximum drawdown is like measuring how much the value of your savings has gone down from its highest point to its lowest point.
For example, let’s say your piggy bank had $100 as its highest value, but then the value dropped to $80. The maximum drawdown would be $20 because that’s how much your savings went down from the highest value. It tells you the biggest loss or decrease in value you experienced during a specific period of time.
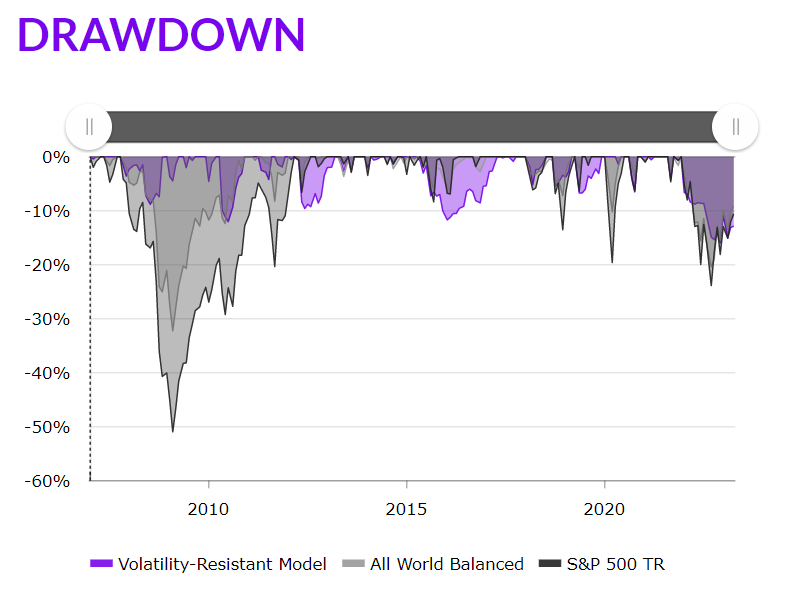
Again, referencing VRM, we can see that the strategy has an MDD of only -14.51%. Considering that in a similar time frame, the MDD for the S&P 500 is -55.2%, this is very good as the strategy has experienced only a quarter of the loss of the market but yet has managed to perform better than the market.
The advantage that systematic, rules-based strategies have is the ability to automatically include downside risk management rules to protect against sizeable and potentially devastating losses.
In the case of VRM, should any risk asset perform worse than a risk-free return over a specified period, the strategy automatically moves to a defensive position.
This one simple rule can all but guarantee that an investor will never have to experience the painful declines associated with protracted market declines.
To summarize, Risk is ending up with not enough based on what you want or need.
Risk Management is the necessary process implemented at the portfolio level to make sure that you stay on course and can make the required adjustments along the way.
If you have any questions or have been considering hiring an advisor, then schedule a free consultation with one of our advisors today. There’s no risk or obligation—let's just talk.
Tags

Free Guide: How to Find the Best Advisor for You
Get our absolutely free guide that covers different types of advisory services you'll encounter, differences between RIAs and broker-dealers, questions you’ll want to ask when interviewing advisors, and data any good financial advisor should know about you and your portfolio.
