
Related Blogs
January 10, 2023 | Chris Rowe
Last year was a challenging year for the stock market, with all kinds of economic and political uncertainties causing significant volatility.
But as we begin this new year, it’s important to keep a long-term perspective and not get swayed by short-term market fluctuations.
Technical analysis is a helpful tool in this regard because it allows us to analyze market trends objectively to make smart decisions about where to allocate investments.
Today we’re going to take a closer look at the current state of the stock market through the lens of technical analysis and see how investors can potentially capitalize on market trends.
Despite the challenges of the past year, there is always hope for growth and success in the stock market for those who are willing to do their due diligence and make strategic investment decisions.
Technical Analysis
The most basic of all technical analyses is trend analysis.
Are prices moving up or down?
As the old saying goes, “the trend is your friend.” As easy as it is to follow, so many investors just don’t.
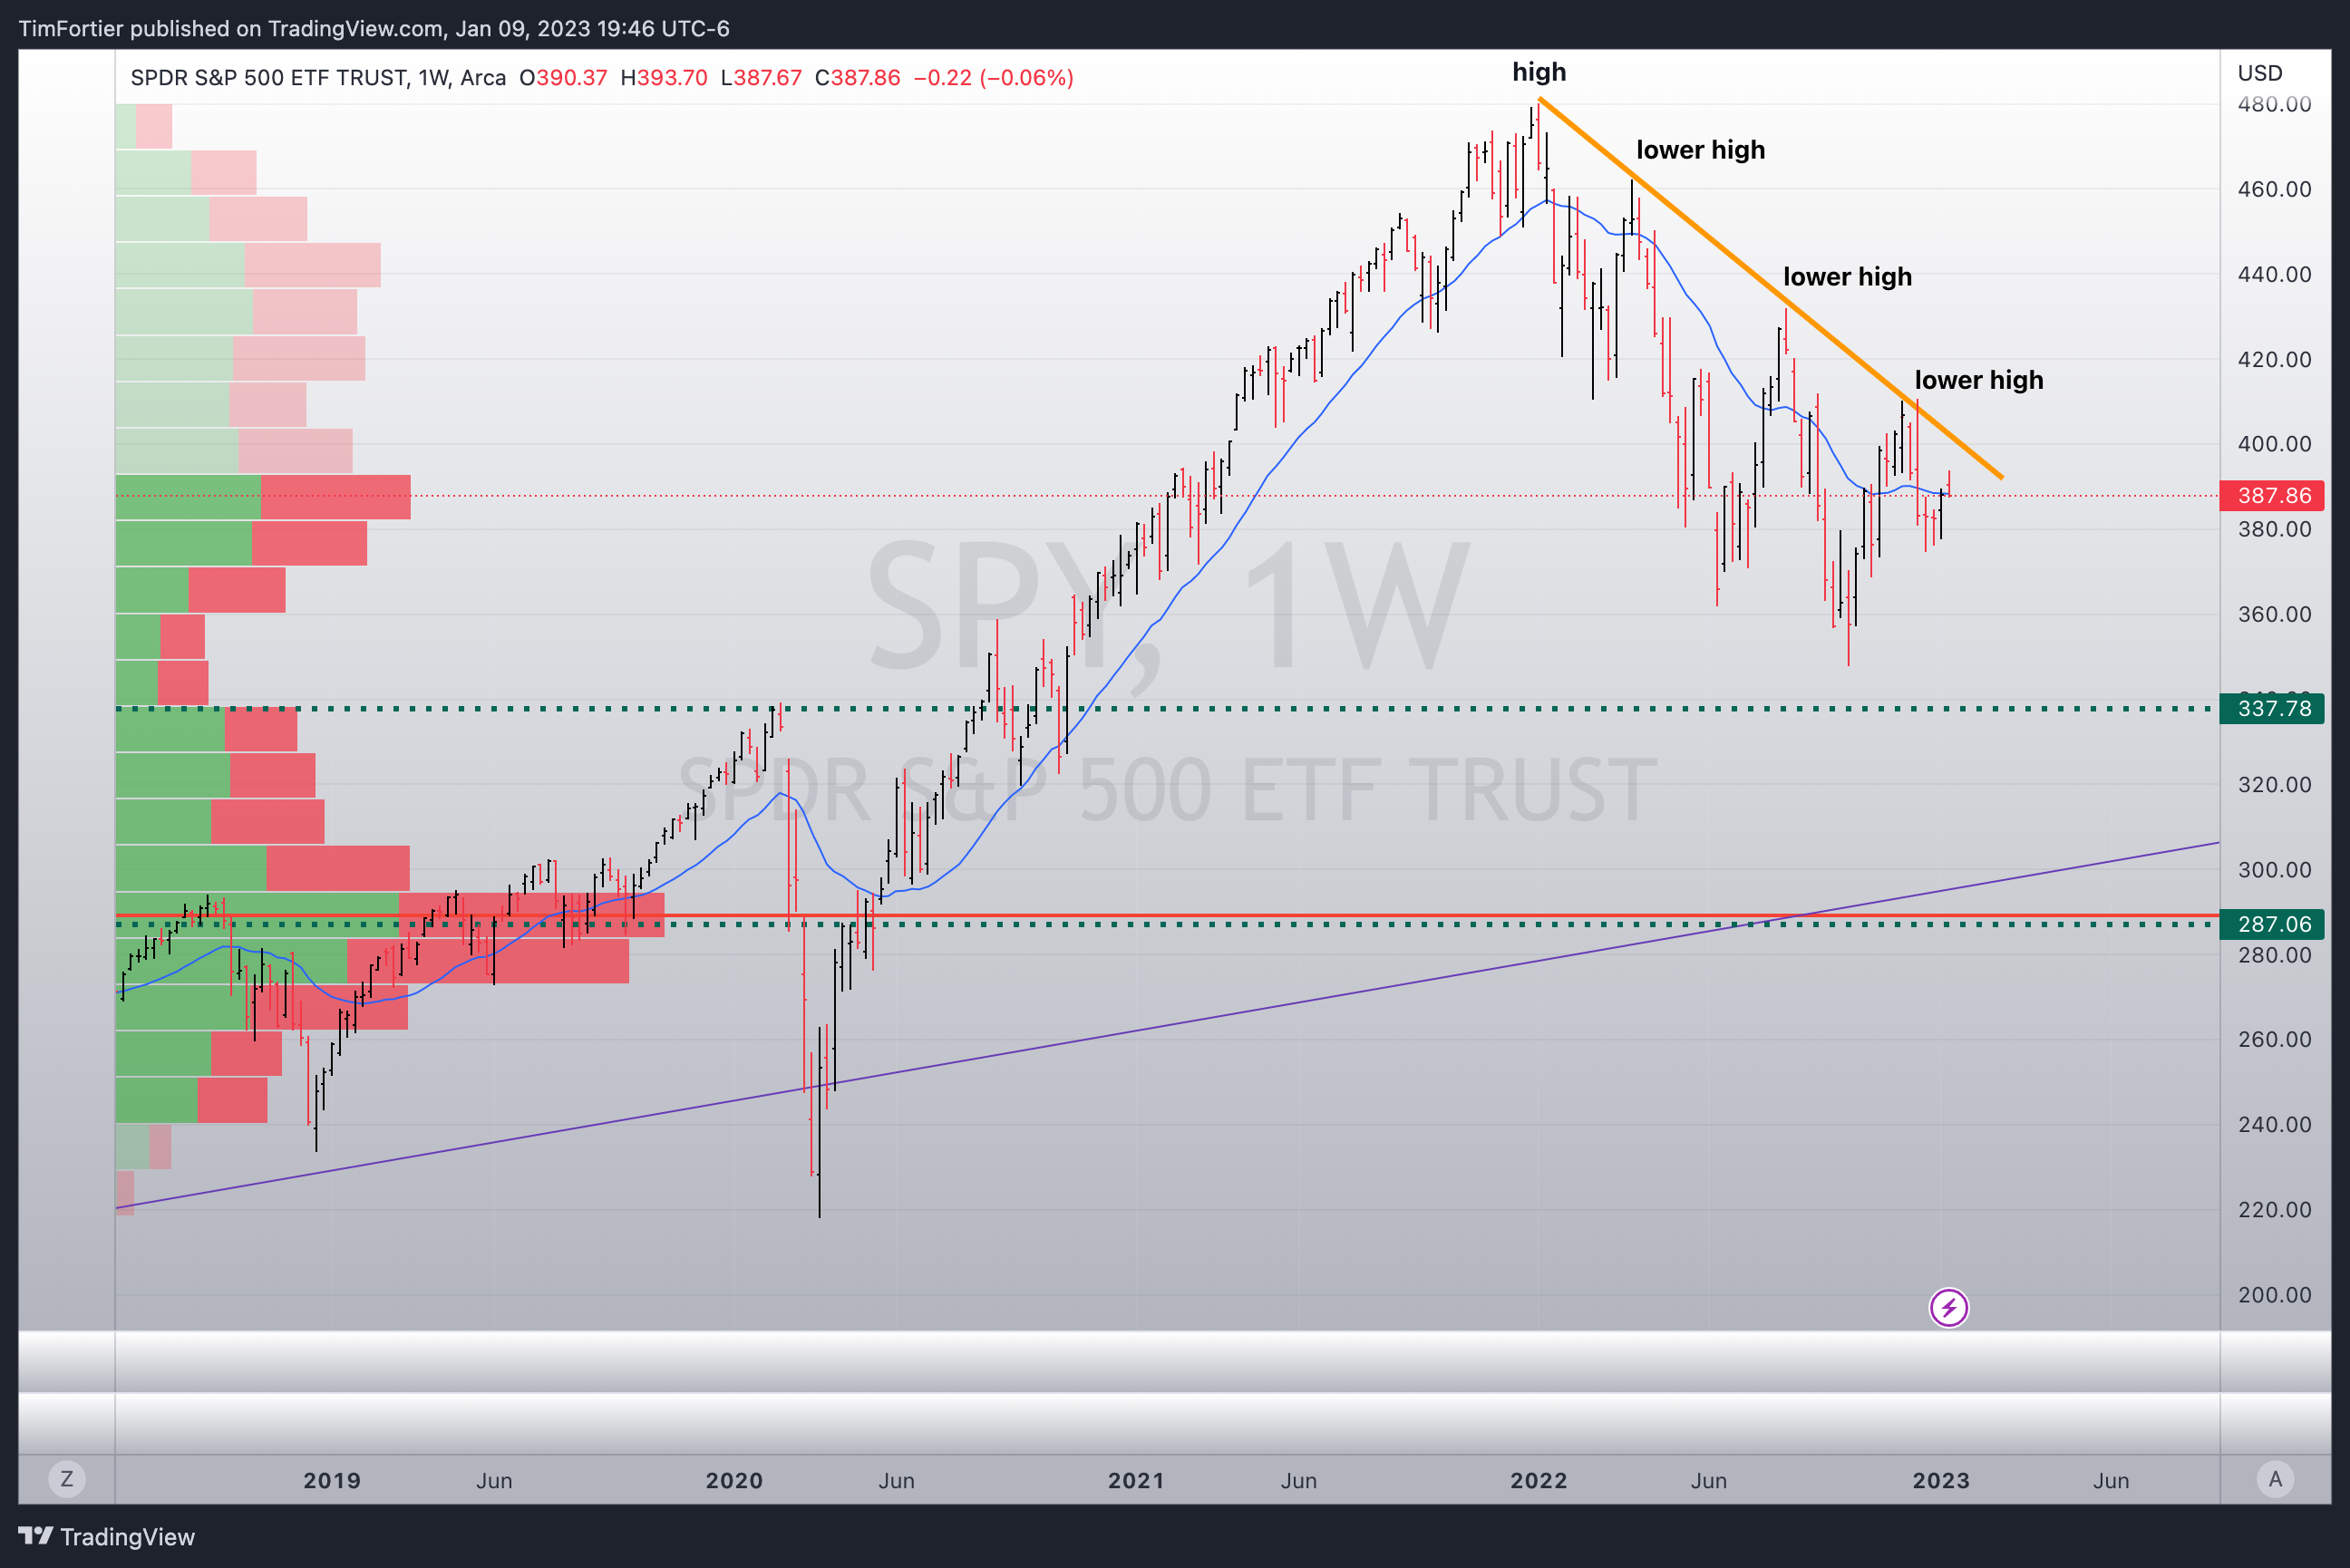
When it comes to trend analysis, it’s typical to begin by looking at larger time frames (like a weekly or monthly chart) before looking at daily or hourly charts.
Starting with the weekly S&P 500 SPDR (SPY), you can see that the dominant pattern remains a pattern of lower highs that form a trendline lower.
Stepping down to the daily time frame, it may surprise people to see that the market is trading around the same level it was last summer.
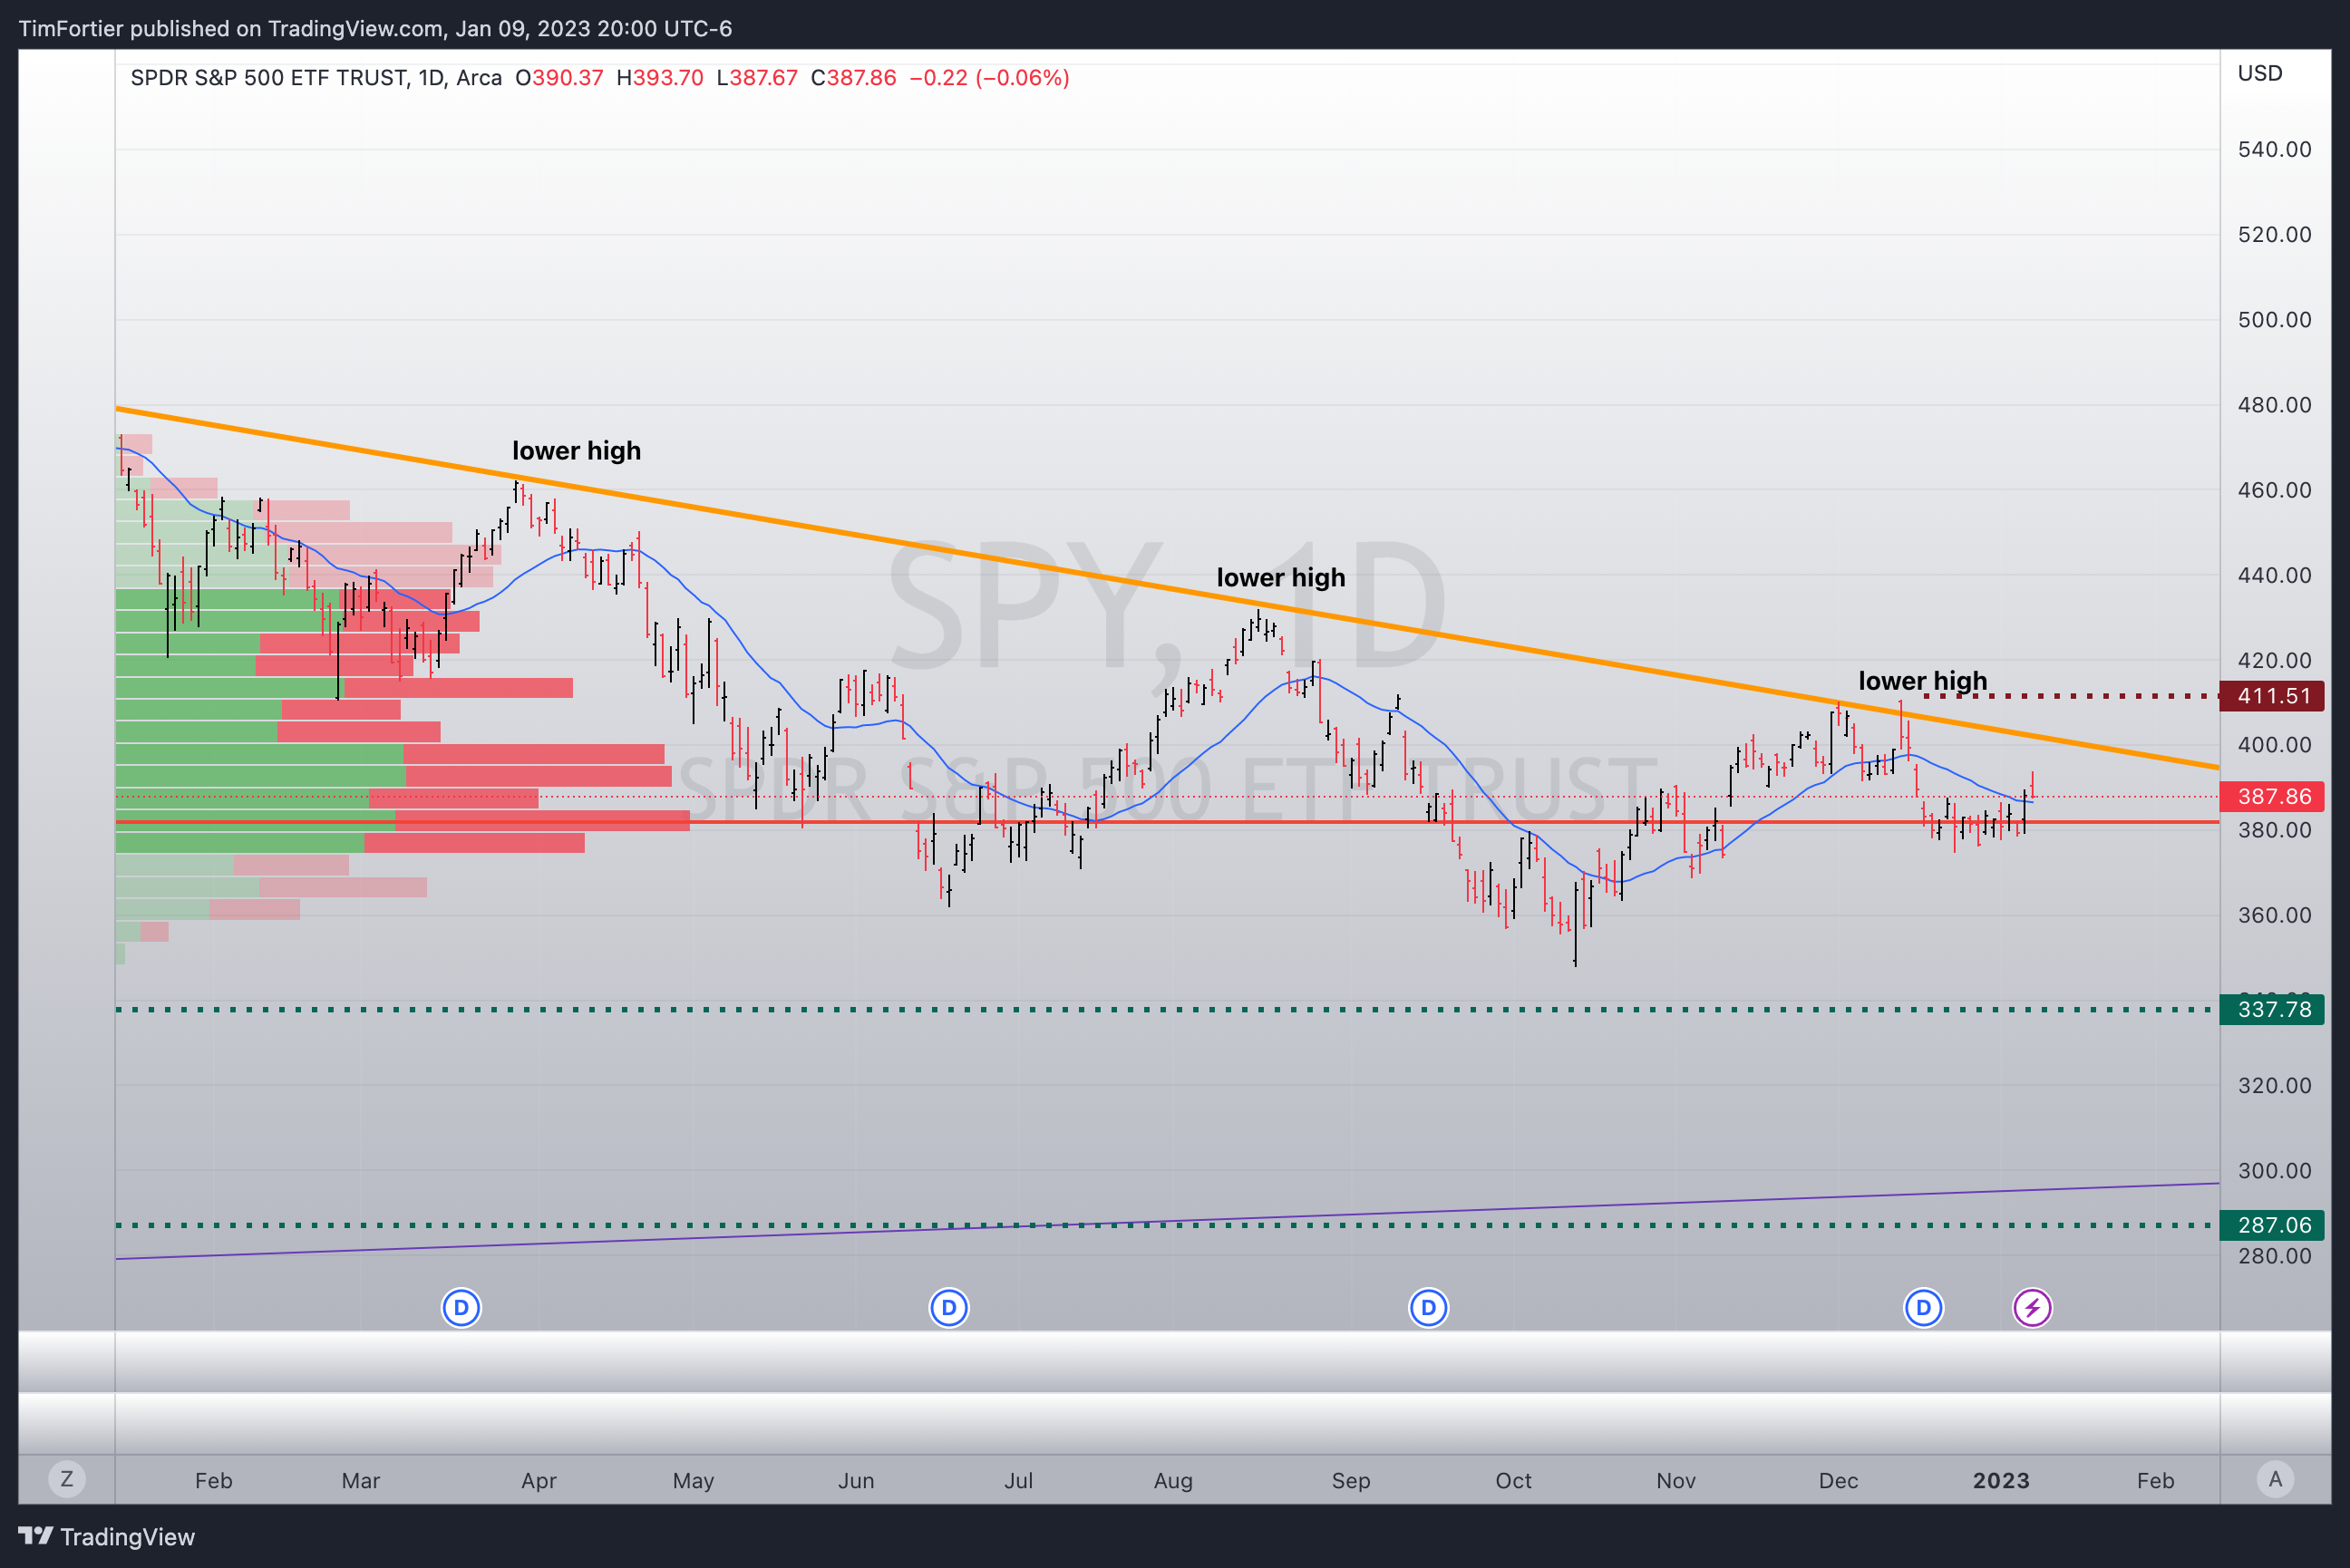
SPY has traded about 8% higher and 8% lower than the current level, but the performance over the last six months is essentially flat.
Conclusion: The next few weeks are going to be important, so we’ll be keeping a close eye on this.
Looking at the Russell 2000 Smallcap (IWM) the picture is less clear.
The weekly chart displays a higher high, but since then, the price has been choppy and the pattern remains in limbo.

Looking closer at the daily chart, the key levels are $192 on the upside and $162 on the downside.

For now, the pattern remains inconclusive as the price is generally choppy and range bound. Like the SPY, IWM is trading at levels similar to last summer.
Now, something I alerted you to recently was how international stocks have started to perform better than U.S. stocks – that trend is continuing.

Looking at the weekly chart of the MSCI EAFE Index (EFA) we can see that EFA has also reached a higher high, something that the SPY has been unable to do.
Additionally, the relative strength of EFA vs. SPY (on the bottom pane) continues to climb, telling us that EFA is the stronger of the two.
While the collective wisdom of the world has everyone trying to guess what the Federal Reserve is going to do next, Asia has been quietly outperforming.
Stocks from Hong Kong, Asia, and Europe are all in a bull market.

The market is seeing a successful kickstart to the Chinese economy as Hong Kong and Chinese stocks have been driven by the strong rebound in Chinese tech shares.
Additionally, the U.S. Dollar has been weak, which drives added money to flow back to Asia. This allows the non-U.S.-Dollar-denominated regions (such as Asia) to reflect the better valuation that they have.
Conclusion: EFA is in a rising trend and should be overweight vs. SPY.
Absolute Momentum
Another way we can look at the market is through the lens of Absolute Momentum.
Absolute Momentum investing focuses on the absolute price performance of an asset, while Relative Strength investing focuses on an asset’s relative price performance compared to a benchmark or reference group.
Both strategies can be used to identify potentially profitable investments, but they differ in the specific approach and criteria they use to identify these investments.
The advantage of using Absolute Momentum is that when the price of the majority of asset classes and sectors are trending lower, as in 2022, Absolute Momentum will help prevent allocating to securities that are falling in value to a lesser degree.
And the picture is looking better.
After keeping investors in cash for much of last year, the number of assets ranking positive by Absolute Momentum is increasing.
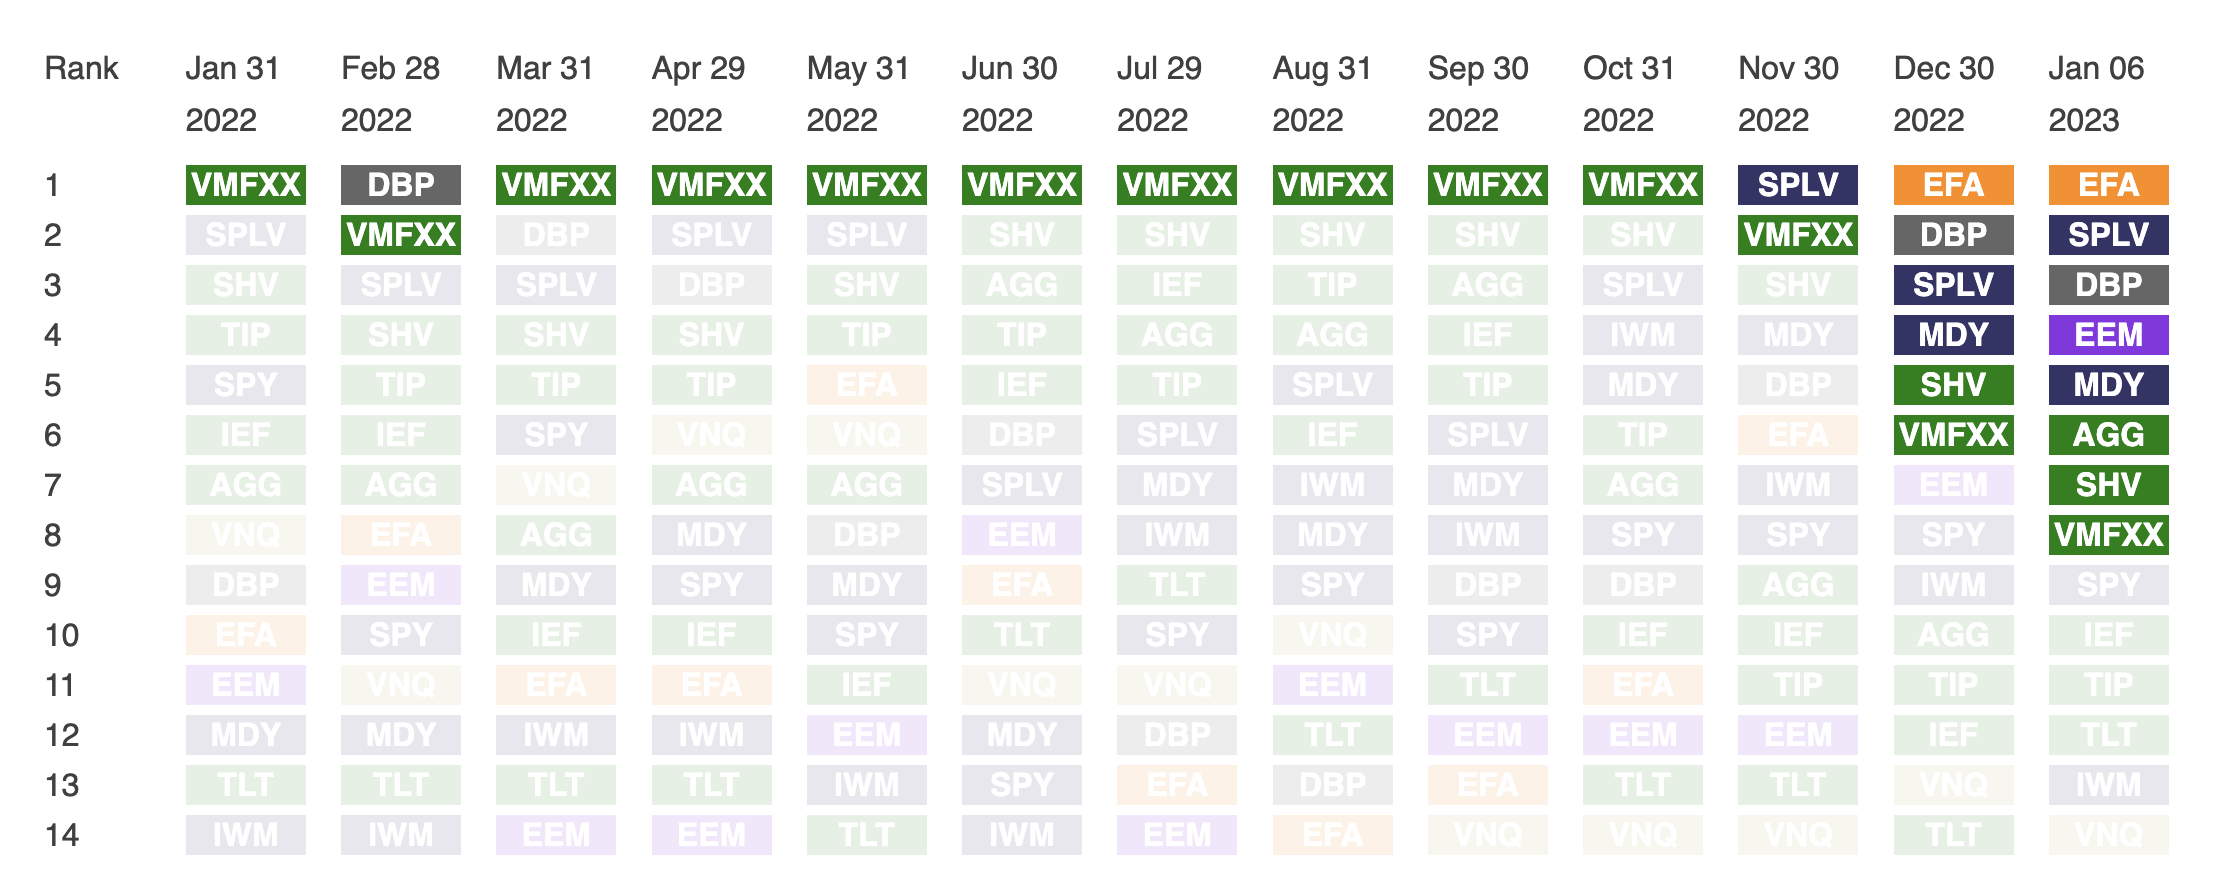
As of 12/30/22, the top-ranked asset classes were EFA (MSCI EAFE Index), DBP (Precious Metals), SPLV (Invesco S&P 500 Low Volatility ETF), and MDY (S&P MIdCap 400 SPDR).
This points to improving performance among the major asset classes.
We can get another clue by looking at market internals, as they oftentimes lead price action.
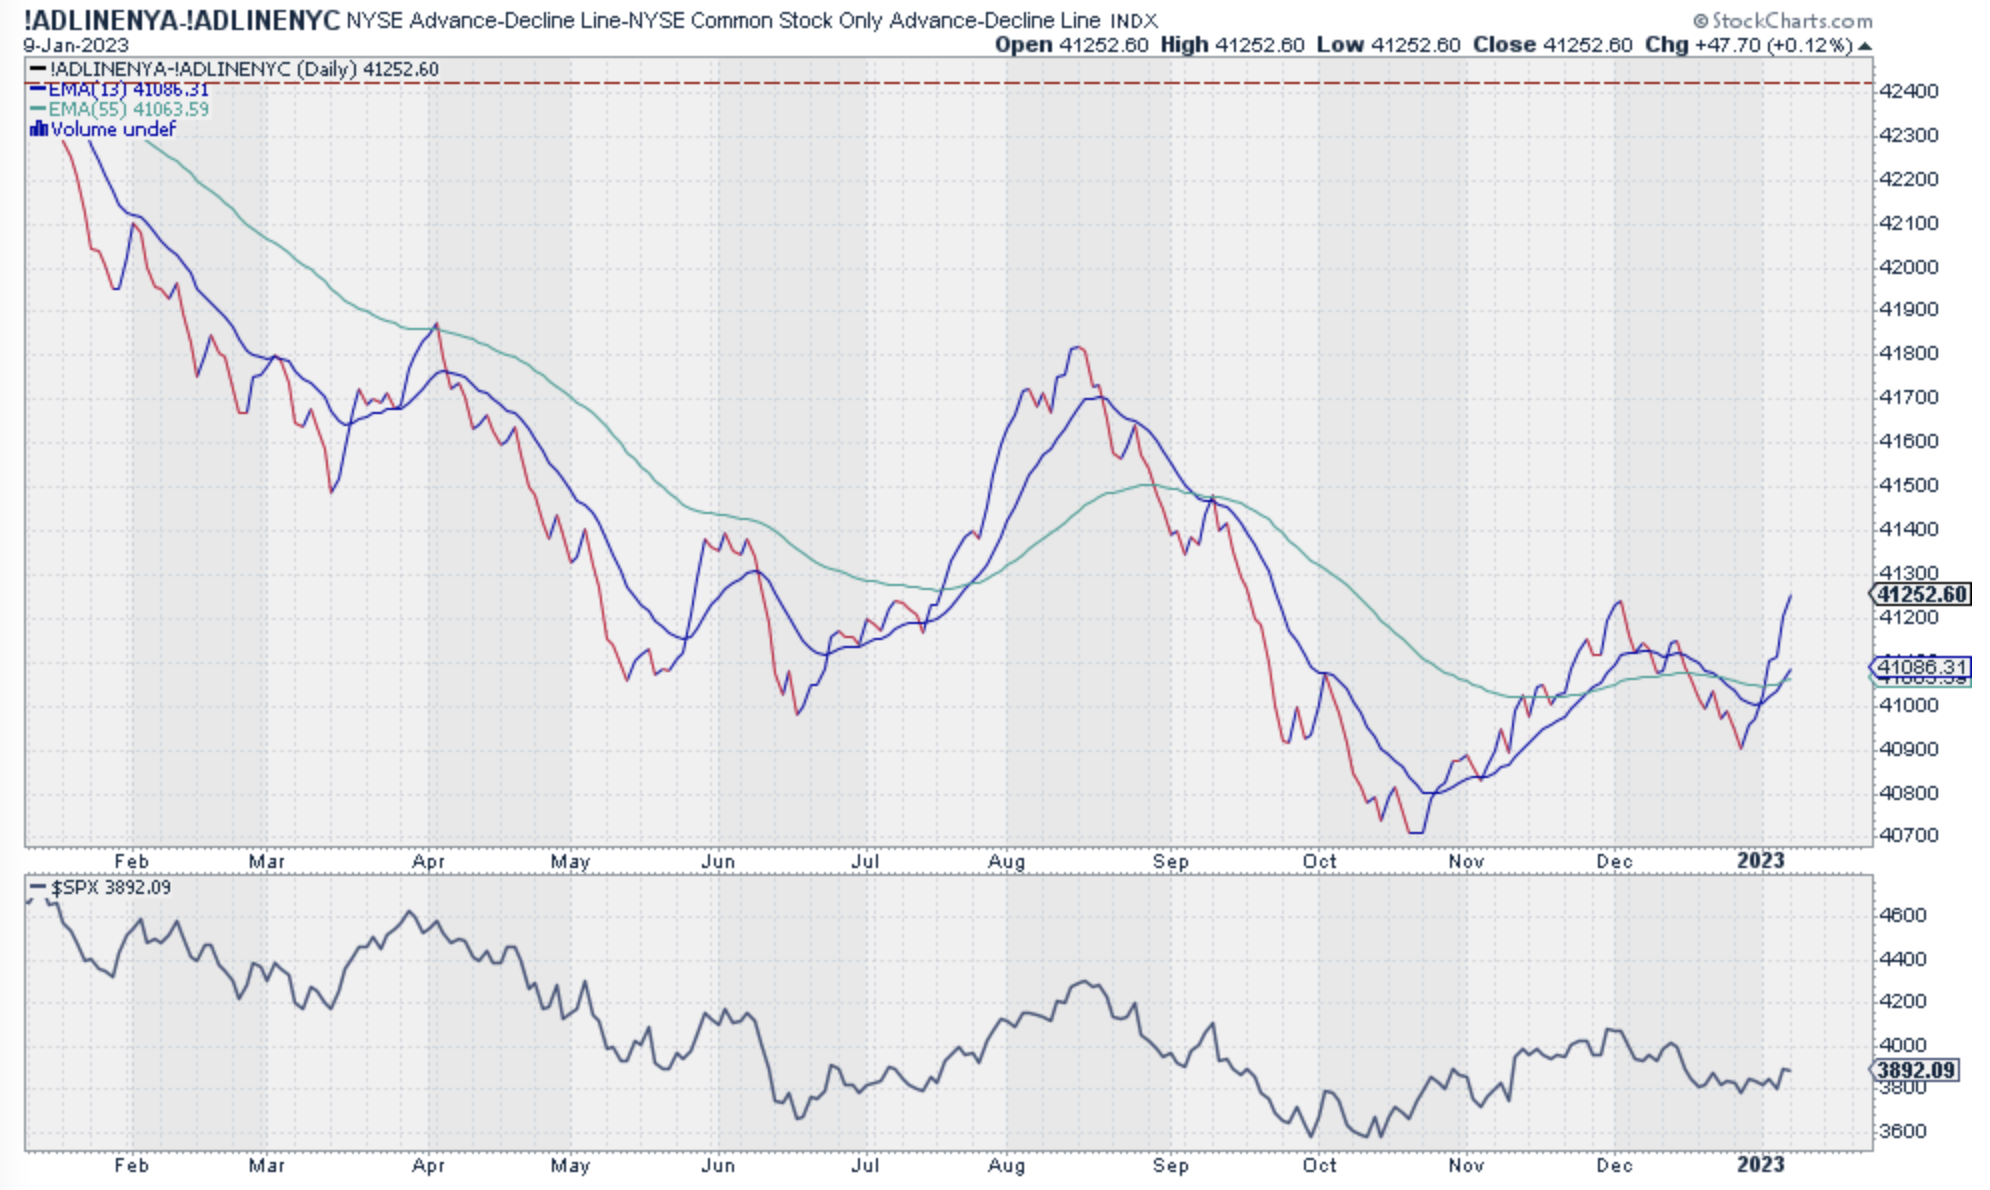
Take a look at this – the NYSE Advance Minus Declines is rising.
This is calculated by taking the number of stocks that have advanced (increased in value) and adding them to a running total, then subtracting the number of stocks that have declined (decreased in value) from that total.
The resulting line can be used to determine whether a particular market or sector is experiencing bullish or bearish sentiment.
One use of ADL is to compare its performance versus a benchmark index.
When the advance-decline line is trending higher and outperforming the benchmark index, it can be seen as a positive sign, indicating that the market is in a bullish state and that investors are buying a broad range of securities.
So currently, the ADL is starting to increase, which can be interpreted bullishly.
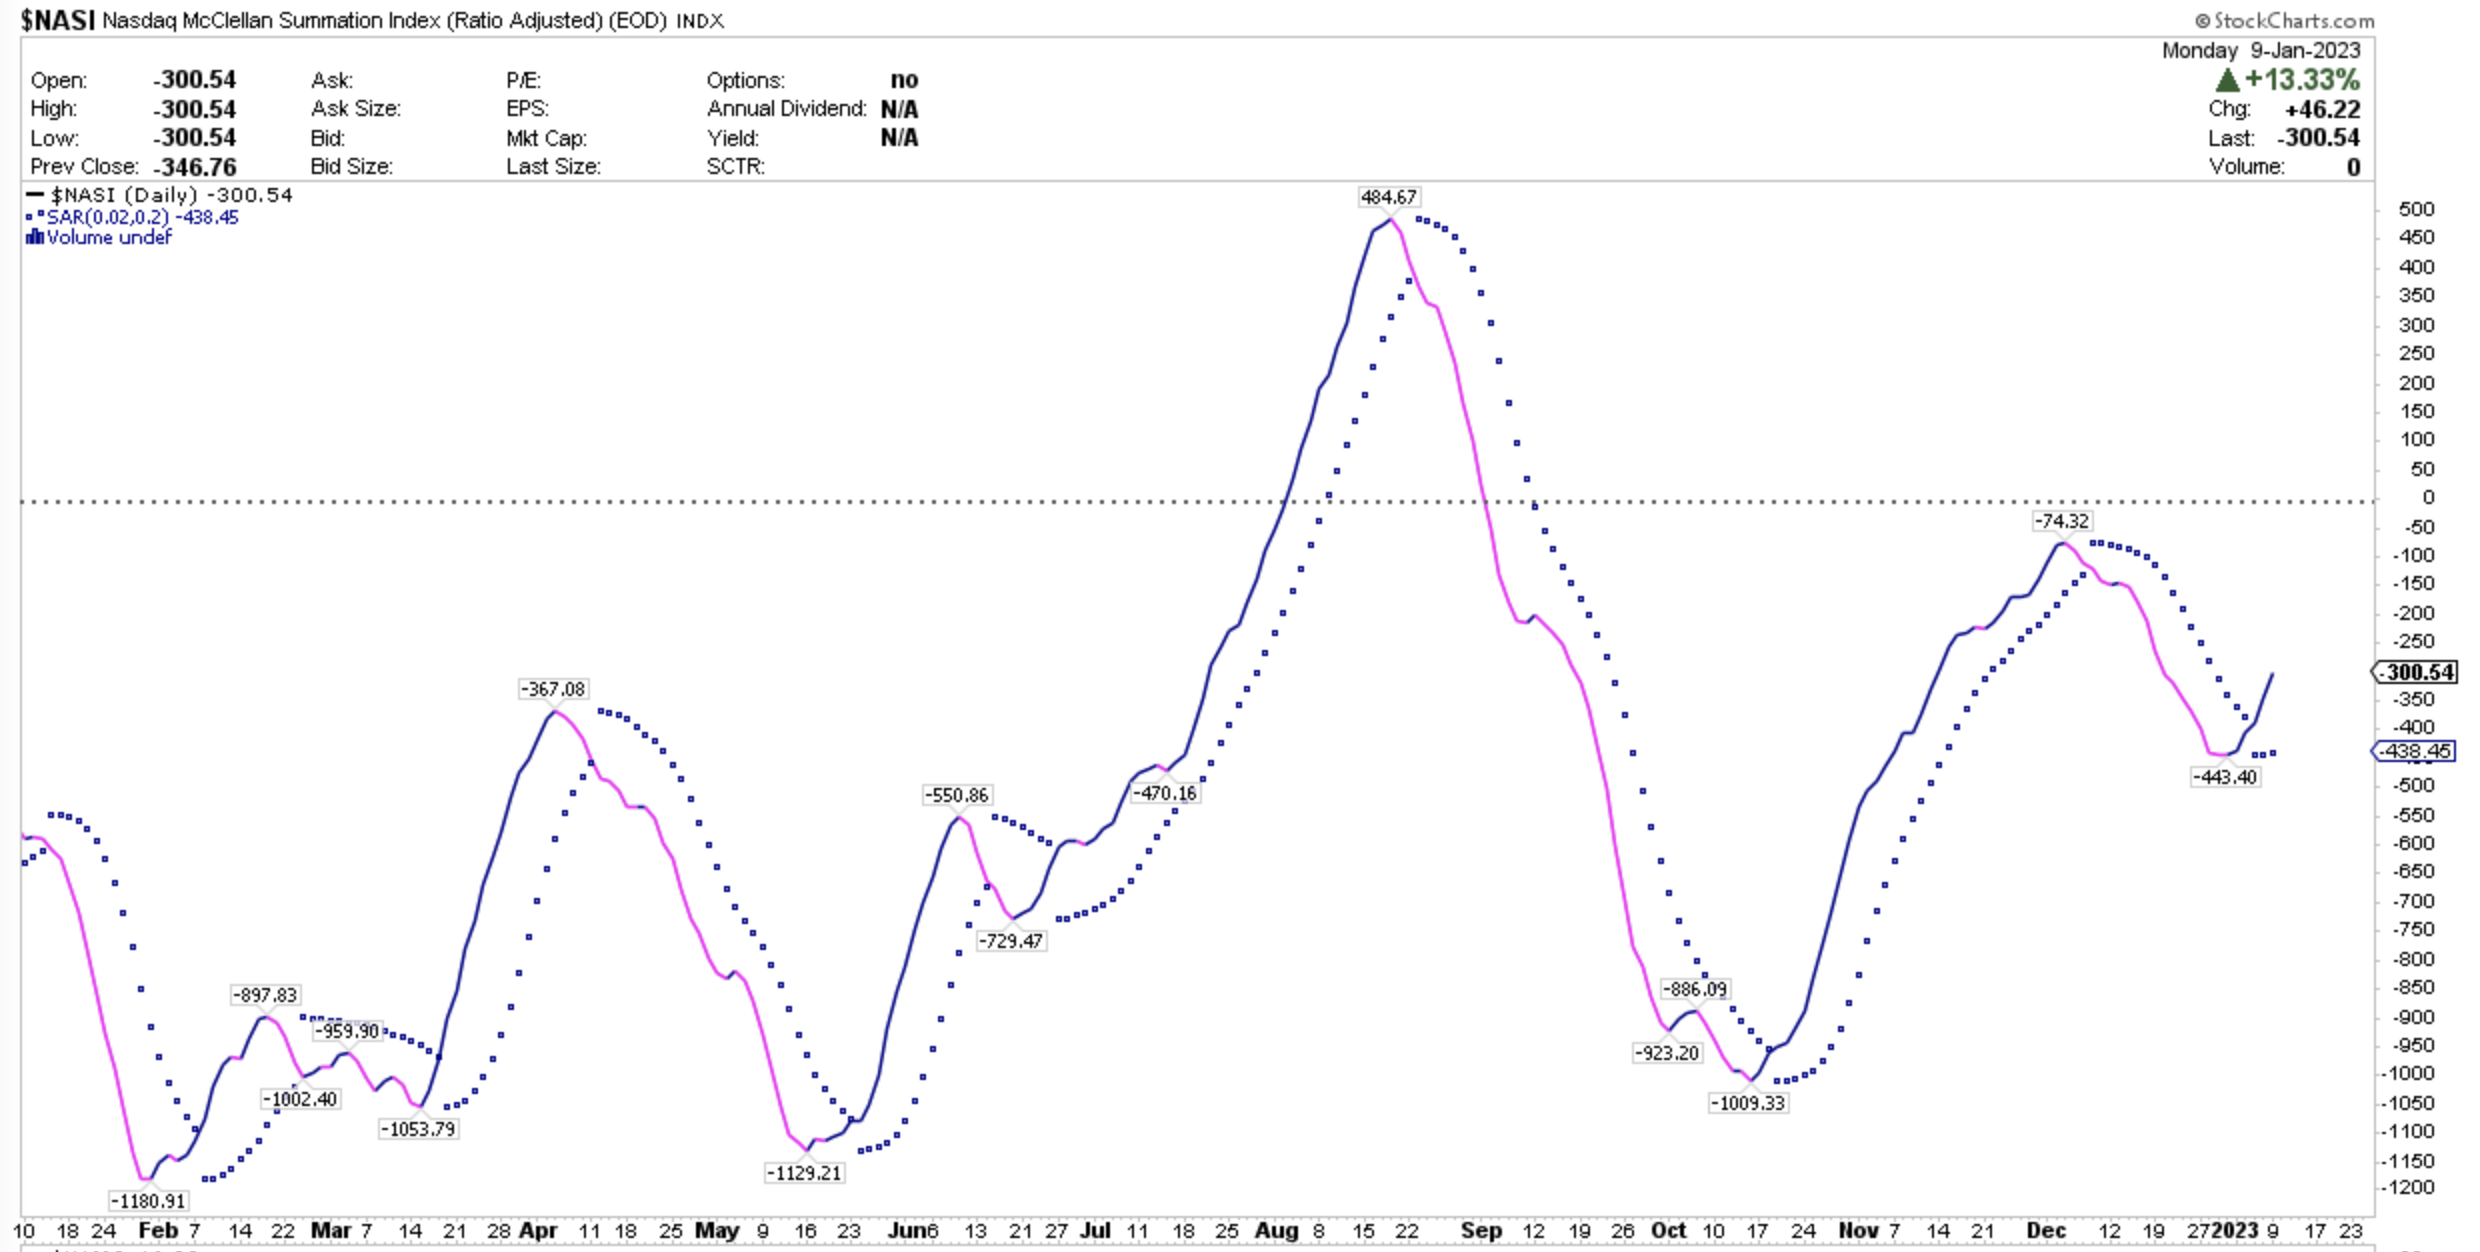
The Nasdaq McClellan Summation Index has also recently turned up. This is another breadth indicator and it tells us that internally, the market dynamics are improving.
Now let’s look at the percentage of stocks that are above their 200-day, 150-day, and 50-day moving averages.
Each of these indicators is near or above 50%. This is good, as it shows us that a growing majority of stocks are getting healthier on their charts as they climb above key levels.
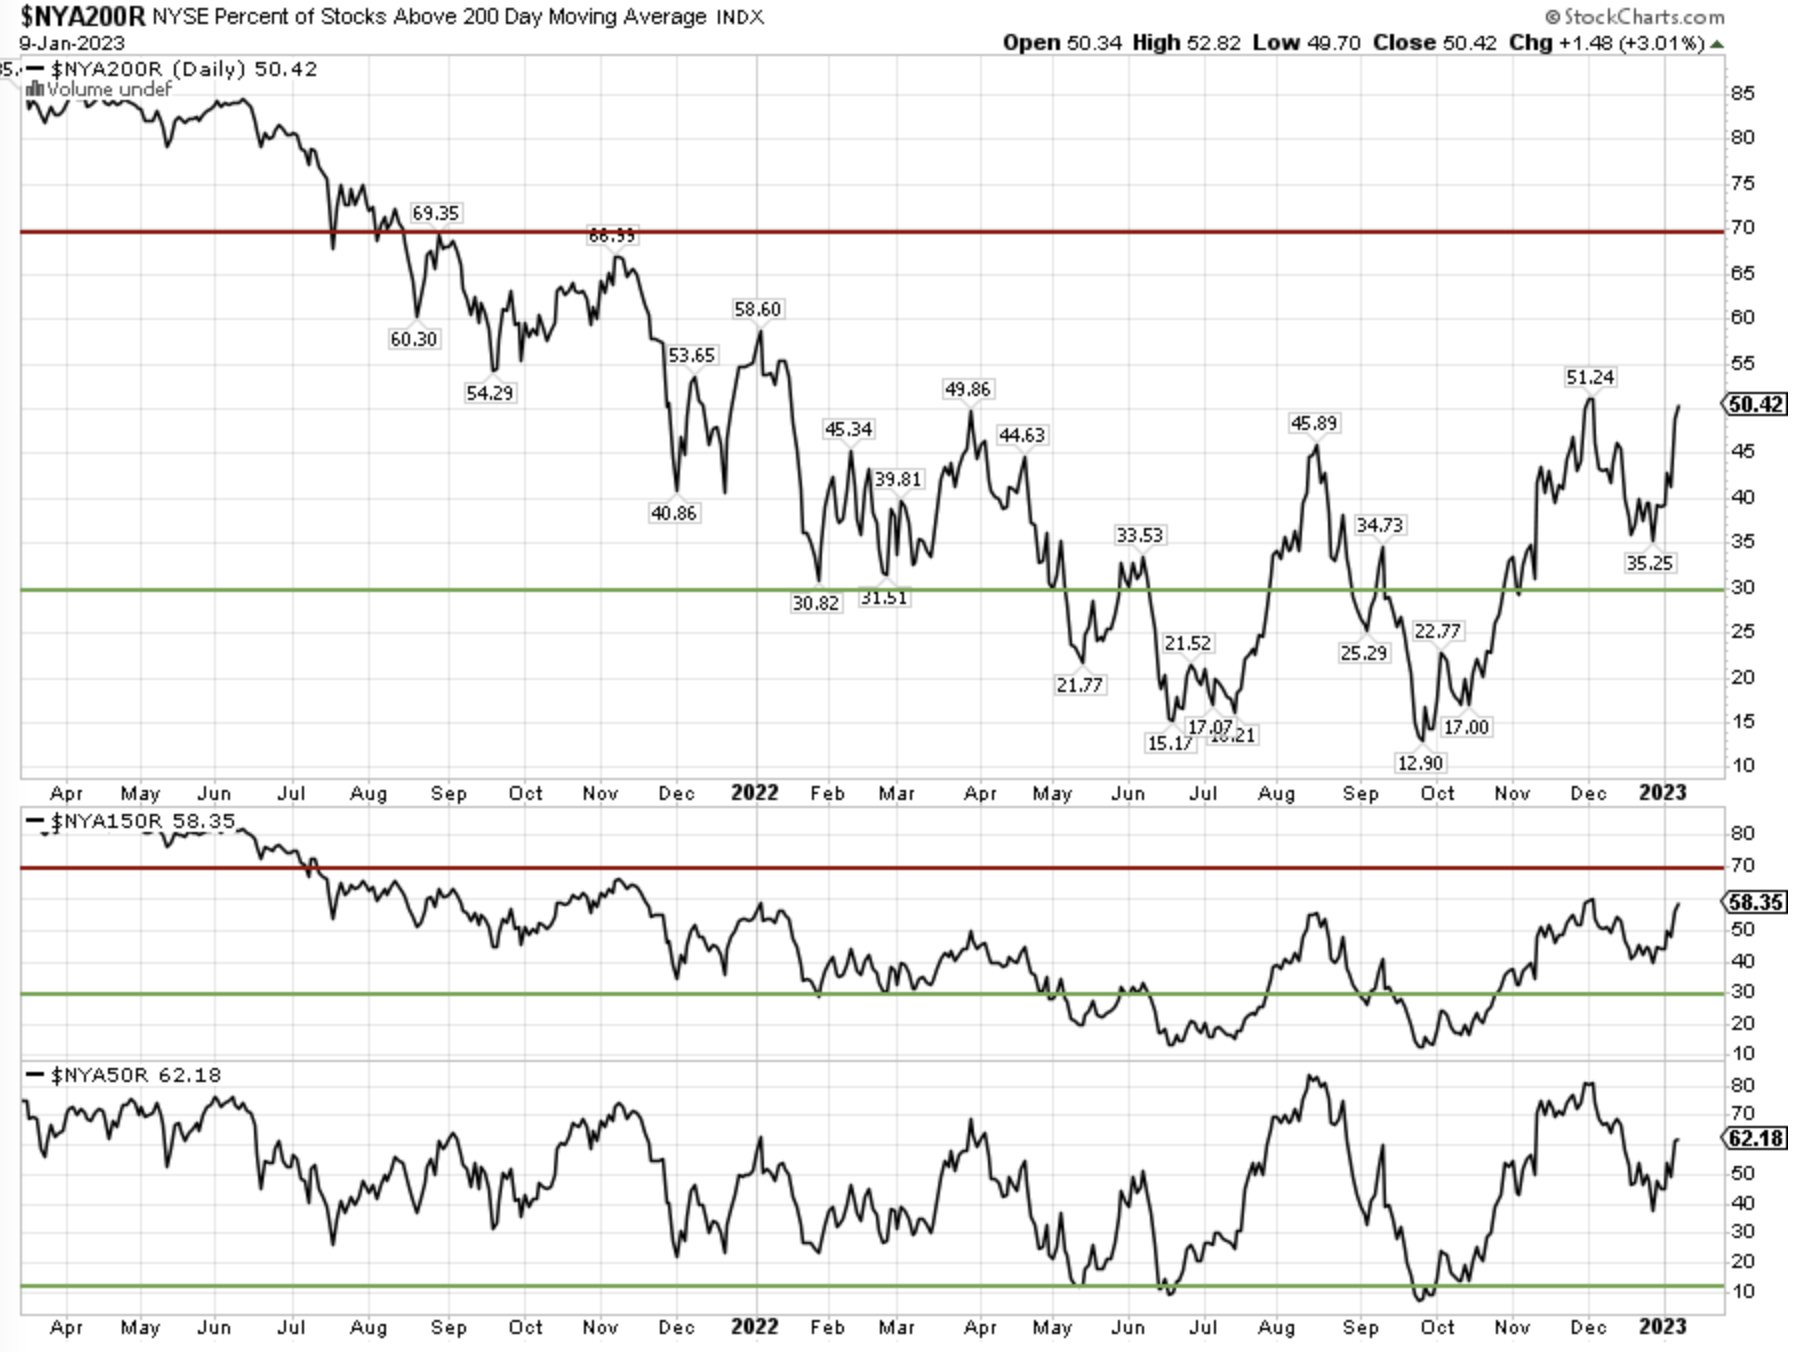
Given the importance that investors place on the 200-day moving average, it’s worth pointing out that there is a significant improvement in this indicator as compared to last summer, and points to an improving characteristic of the current market.
This all leads to this one final chart, the relative comparison between the equal-weight S&P 500 and the cap-weighted S&P 500.
As the chart clearly shows us, the performance of the equal-weight is much better than the cap-weighted index.
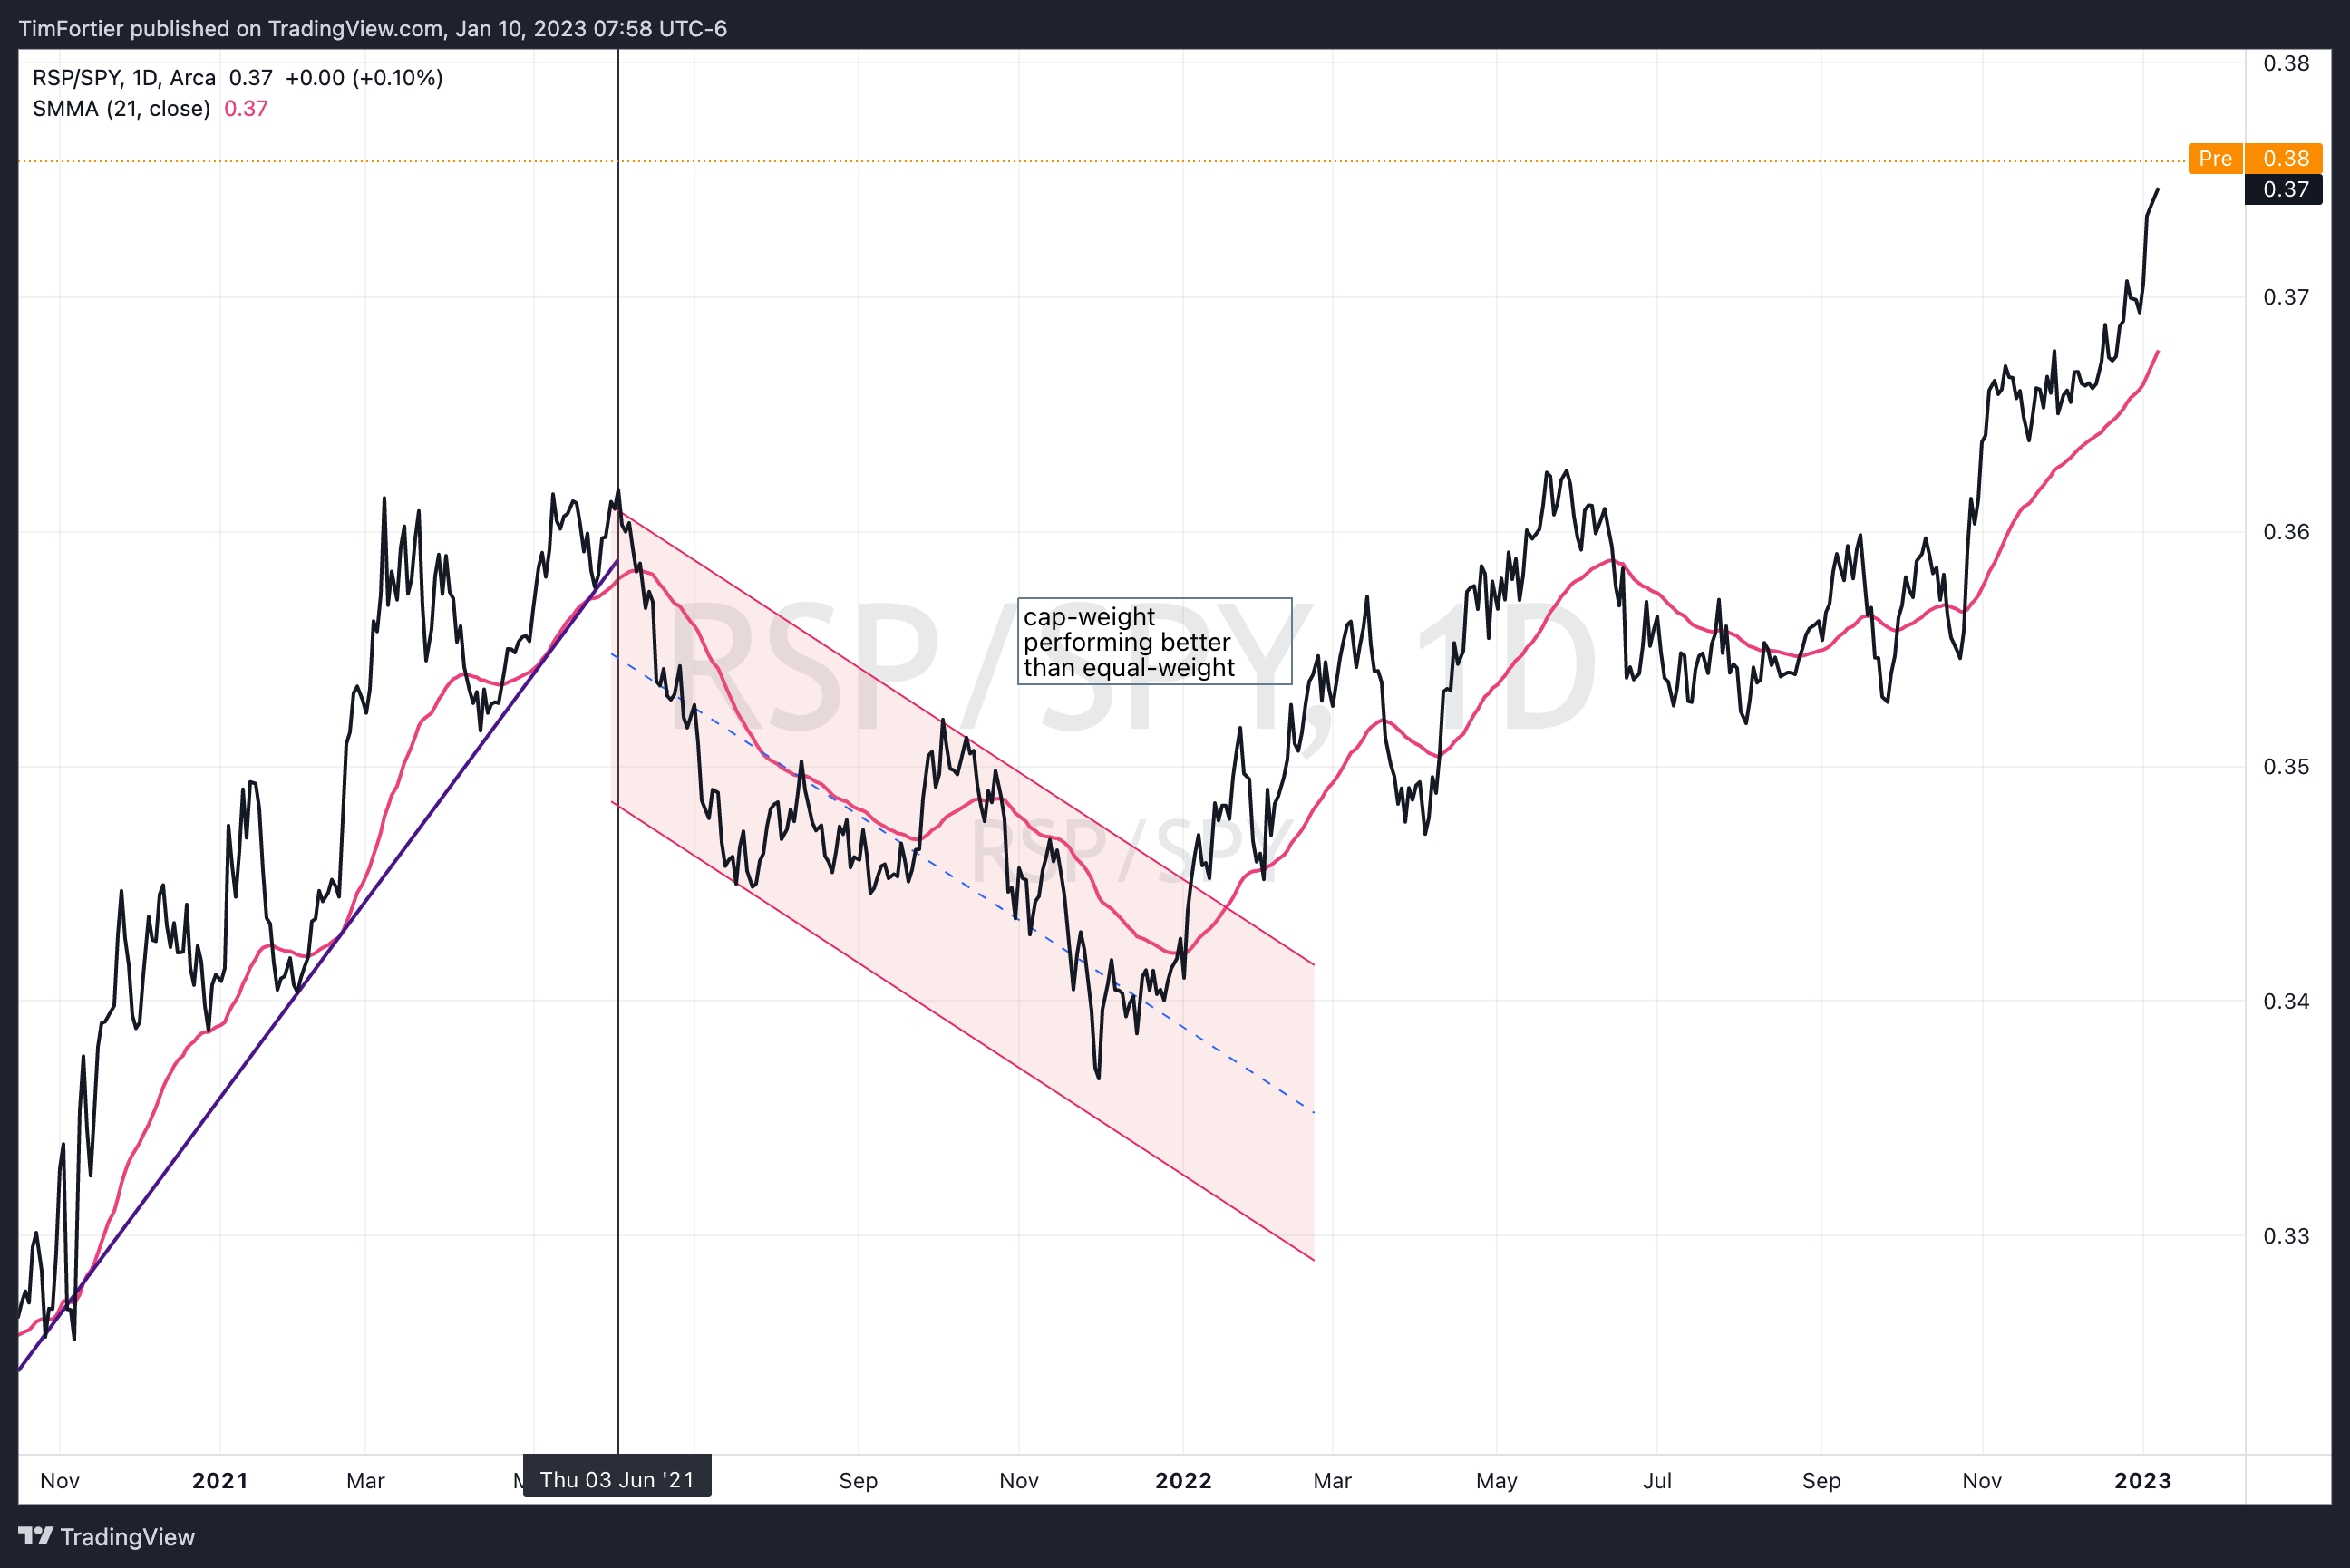
This tells us that the weakness in the mega-caps is masking a general improvement in a broader number of stocks.
So to sum up for this week, while on the surface the action may seem still uncertain, there is growing evidence of improving market internals and expanding opportunity sets that should give investors some reasons to be optimistic.
If you have any questions or have been considering hiring an advisor, then schedule a free consultation with one of our advisors today. There’s no risk or obligation—let's just talk.
Tags

Free Guide: How to Find the Best Advisor for You
Get our absolutely free guide that covers different types of advisory services you'll encounter, differences between RIAs and broker-dealers, questions you’ll want to ask when interviewing advisors, and data any good financial advisor should know about you and your portfolio.
