
Related Blogs
March 21, 2019 | Michael Reilly
During WWII the air forces of the United States used a very special, very secret device designed to pinpoint their targets.
It was so secret that if a plane were ever at risk of being shot down, the crew was ordered to throw the secret device out of the aircraft so it would be destroyed and not fall into the wrong hands.
This top secret devise was the Norden Bombsight and it helped change the course of history.
Here we are some 80 years later, and the invention that gave American flyers an edge is now a part of history.
The world has certainly changed a lot over the last 80 years. But what hasn’t changed is human psychology…and the search for an edge.
In our case, it’s the search for an investment edge.
Although finding an investment edge doesn’t have nearly the implications the Norden bombsight did back in the 1940’s, identifying an investment edge is important to investors looking to target some of the strongest momentum investments around the globe.
Today, instead of a bombsight, our edge comes in the form of Relative Strength algorithms – designed to track institutional money flows.
We can create an edge by understanding what the big money players are thinking – and having an inside track to where their investing dollars are headed.
Because where there is strong institutional demand for stocks – that’s where prices will likely be pushed higher.
Without finding myself too far in the weeds on the topic, the concept of relative strength is simply a process of targeting price momentum and relative strength of one investment vs. another.
You can apply relative strength investing to almost any investment approach – stocks, bonds, annuities, you name it.
But one way investors often employ a relative strength study is in comparing the strength of various market capitalization and weighting investment capital to the strongest group.
Mainstream media is of little use in answering this question, because they focus too much attention on broad market indices, such as the DOW, S&P 500 and NASDAQ.
As a rule of thumb, investors need to look deeper than that if they hope to find any meaningful outperformance.
Today, I want to bring to your attention a market segment that very few people seem to be talking about, but it’s an area offering returns double that of the “hot” S&P 500 index.
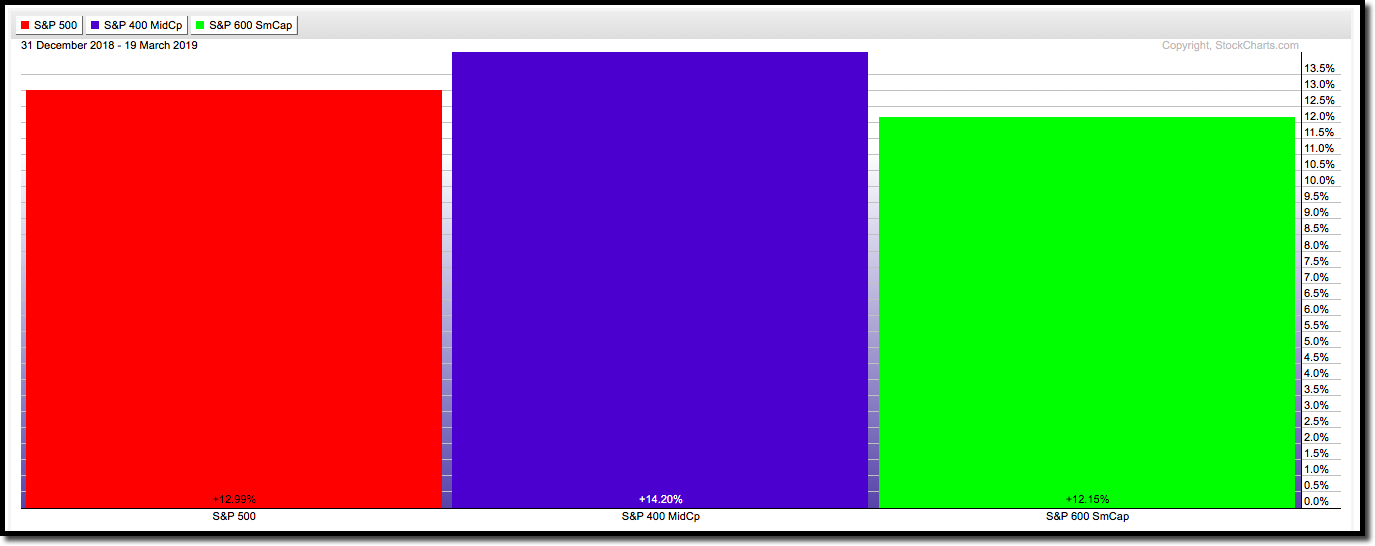
That’s right, we all know the “stock market” – the S&P 500 for most investors, is off to its best start in decades. The S&P 500 is a large cap index – so it’s the big guys – 3m, Abbott Labs, Amazon, VISA, and Nvidia – to name a few.
But what you may not know is mid-cap stocks are outperforming both the large cap index (S&P 500) and the small cap index (S&P 600 Small Cap)
So while the S&P 500 index has gained 12.99% through March 19, 2019, and the S&P 600 Small Cap Index has gained 12.15%, the clear edge belongs to the S&P 400 Mid Cap, which is up 14.20% YTD.
Below is a relative strength matrix consisting only of mid-cap ETFs.
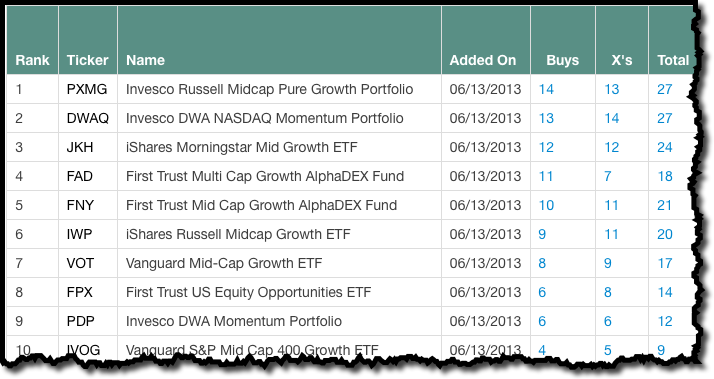
As you can see in the performance bar chart below the top 5 mid cap ETFs from our matrix above have all outperformed the S&P 500 by a sizable margin.
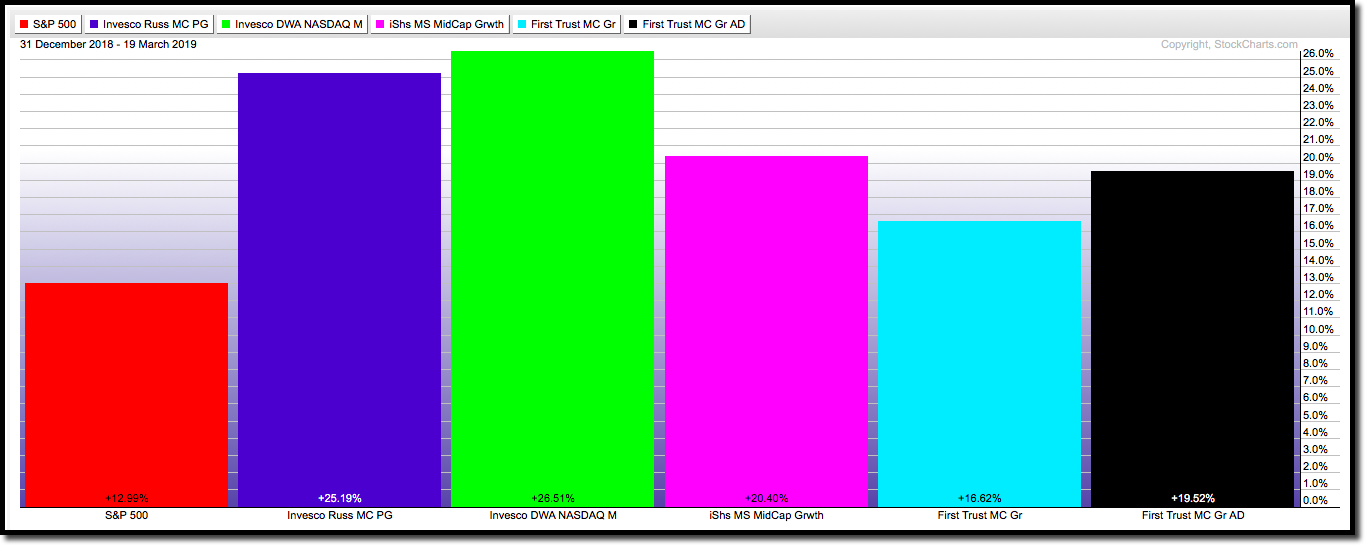
The, Invesco Russ Mid Cap growth fund (PXMG) has more than doubled the return of the S&P 500 – rewarding investors with a return of 25.19% YTD. The Invesco DWA NASDAQ mid cap growth ETF (DWAQ), has gained 26.15%, while the iShares MS mid cap growth ETF (JKH) is up 20.40% this year.
Investors can use the matrix above and review these funds for possible inclusion in a portfolio if a mid-cap growth position is needed.
The best part about using Relative Strength algorithms to compare ETFs like the ones above is that it often allows us to spot these price trends before they happen. We often joke that Relative Strength techniques allow us to “see the future”, because we’re able to spot price trends before they’re in full swing.
As an investor you already know how helpful this can be, as rebalancing your portfolio on a regular basis based on Relative Strength data can allow you to capture a lot more of the upside from ETFs that are outperforming the “mainstream” markets.
If you haven’t already had the contents of your portfolio evaluated for their Relative Strength scores, now is a great time to do so.
We offer completely free evaluations to investors with at least $500,000 of investable inventory. This can allow you to quickly identify holdings you can expect to do well, and which ones may need to be changed in order to maximize your growth potential.
Click here now to see available call times.
As always, invest wisely.

Get Our FREE Guide
How to Find the Best Advisor for You
Learn how to choose an advisor that has your best interests in mind. You'll also be subscribed to ADAPT, Avalon’s free newsletter with updates on our strongest performing investment models and market insights from a responsible money management perspective.
