
Related Blogs
August 23, 2022 | Avalon Team
The S&P 500 index just staged a very impressive rally off the June lows.
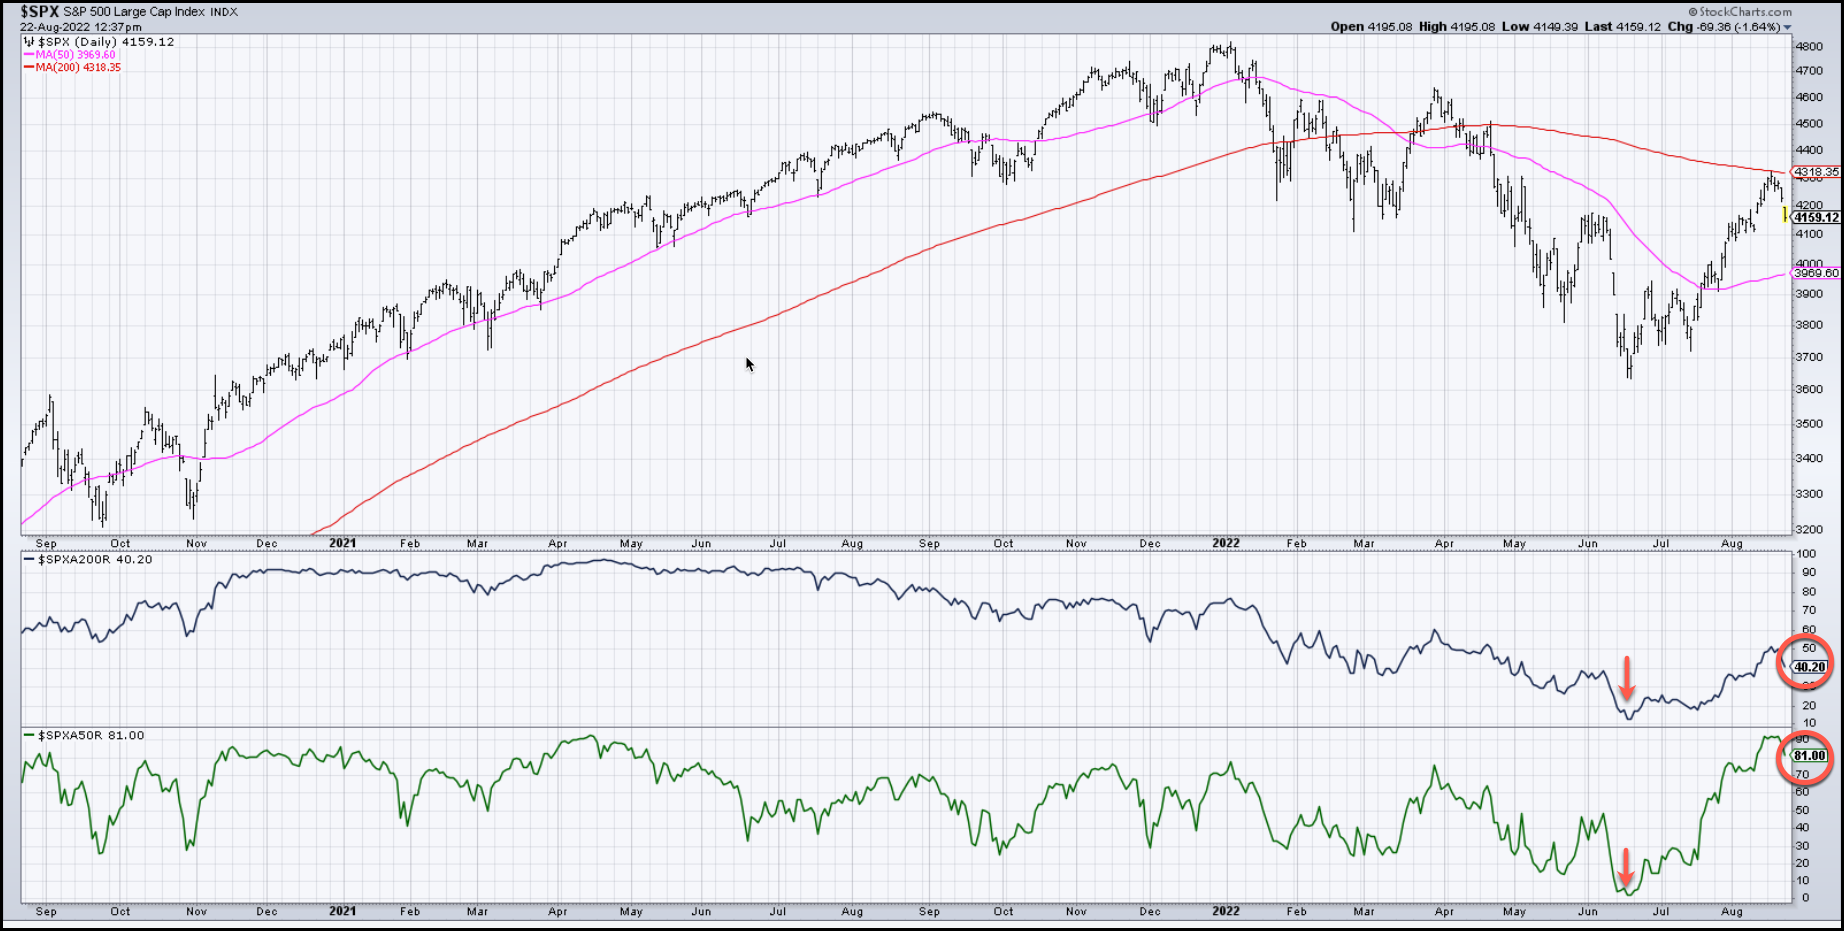
Not only did prices rally, but we saw some much-improved breadth conditions – meaning more stocks have participated in the June rally than did in April/May.
Healthy Bull Markets require broad stock participation – and as you can see, the percentage of stocks above both their 50- and 200-day moving averages moved off single digits to 81% and 40% respectively.
The improvement in breadth contributed to our optimism. However, a healthy dose of caution looks to be in order.
Piece by piece, the weight of the evidence is beginning to lean towards at least a pause of the current rally.
For those of you new to ADAPT Weekly or Rowe Wealth Management, we rely heavily on technical analysis (the study of price behavior) as a means to see markets clearly.
And right now, we’re seeing some signs that the rally off the June lows is losing some steam.
But does that mean you should panic and sell, sell, sell? No, not necessarily.
It comes down to time frame. Every reader’s time frame is different from the next.
Some of you have very short time frames, possibly just days, while other readers view markets in weeks, months, or even longer.
So, although each of you is reading the same article, and analyzing the same price and breadth charts, how you will apply this information will likely vary greatly.
There is no one-size-fits-all.
With that said, let’s look at some charts that make us a little skeptical of at least a short-term pullback.
Today I want to focus your attention on overbought conditions as well as resistance around these price levels.
I’m going to highlight one breadth indicator that has identified the previous major swing tops in 2022.
Let’s start with the price chart of the S&P 500 index. Focus on what happened to the S&P when it last ran up to its 200-day MVA in April. I don’t think it’s a coincidence…
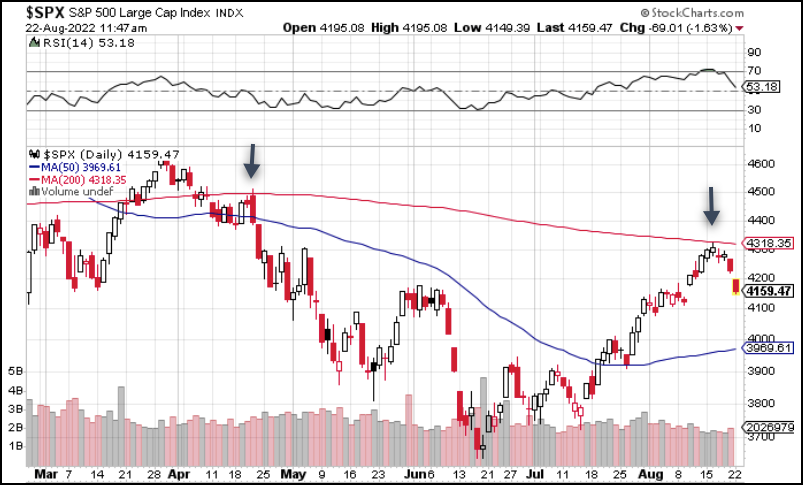
Although we say moving averages don’t have price memory, the 200-day has proven itself a difficult hurdle for the S&P 500.
The 200-day moving average is where the S&P previously reversed lower in April.
Fast forward to the end of last week… just as in April, the S&P is being turned back at the 200-day MVA.
Keep an eye on that area. If the S&P can break out above the 200-day it will be a very Bullish development. But I’m not counting on it just yet.
I think investors should remember 4300. Look at all the congestion the S&P 500 is running into around 4300 going back over the previous year.
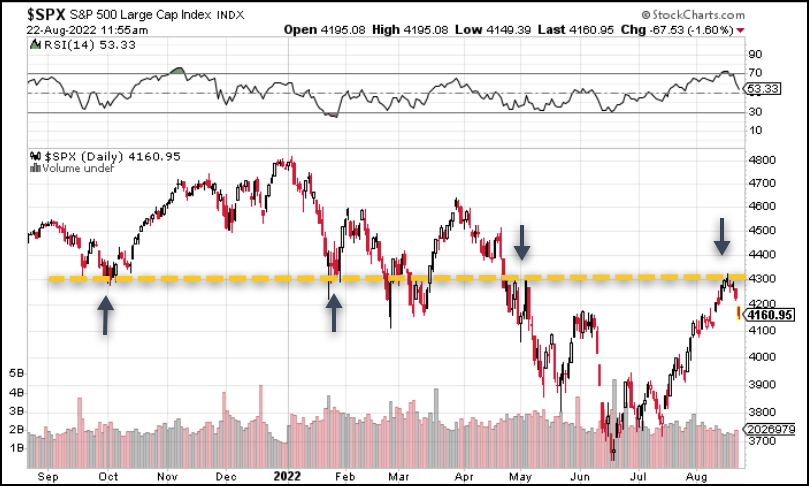
The 4300 area is a logical place for the index to run into overhead supply, just as it did in May 2022. This is polarity at work.
Then there’s this little old down trendline to consider.
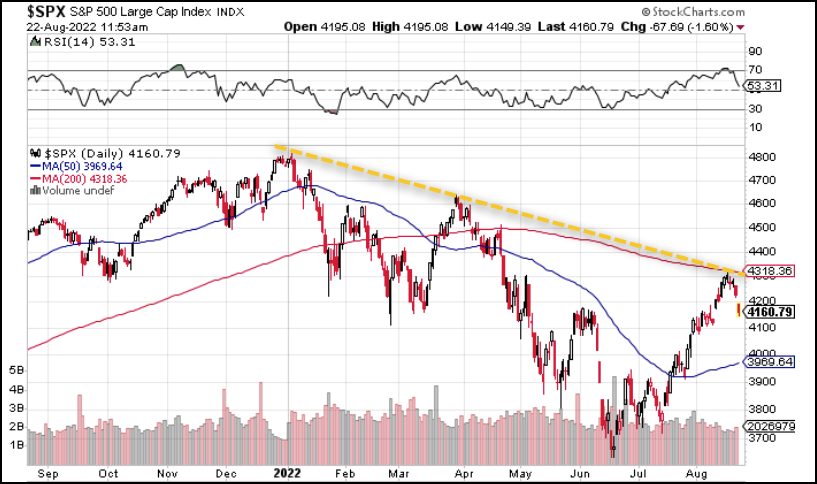
When we extend out a trendline from the January 2022 S&P index high to its next lower peak in April and then extend that line to today, the S&P was unable to break above the downtrend line (also marking the 200-day MVA). That is not a show of short-term strength.
Let’s round out our analysis by looking at two important breadth measures.
First volume. In technical analysis, volume = validity.
Unfortunately for all you short-term Bulls out there, volume is not cooperating – volume is falling… not exactly the Bullish data point we’d like to see. Bulls want to see continued price strength with rising volume.
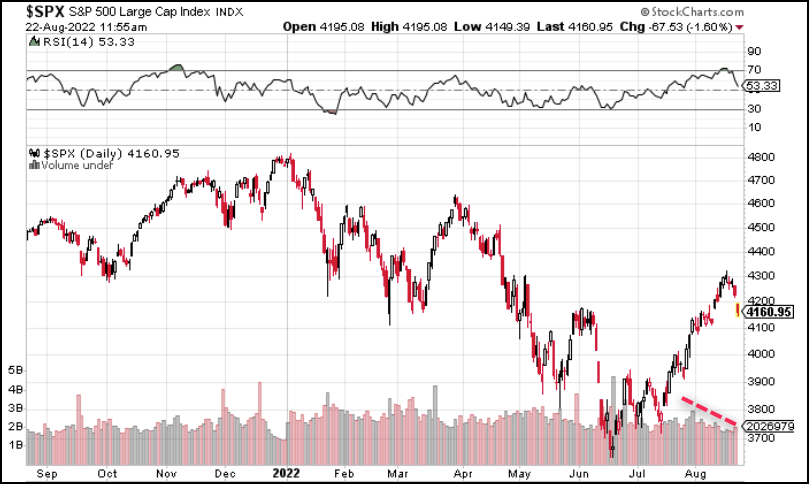
But that’s just not what we are seeing. As price continued to rise into August, it has done so with falling volume. Hard to have conviction in rising prices on falling volume.
There may be no other chart more important for index investors to watch right now than this one. It alerted investors to the two previous sell-offs in the S&P 500 index this year.
It’s the Bullish Percent Index (BPI) for the S&P 500. And it’s getting close to yet another sell signal.
If you’re not familiar with the BPI indicator, it’s a measure of participation (breadth) and indicates oversold and overbought levels, in this case the S&P 500 index.
The Bullish percent chart for the S&P 500 illustrates, in a single chart, the number of stocks trading on the S&P index that are on buy signals on their own price charts.
It’s a quick and powerful glance at the “bigger picture” – the entirety of the S&P vs. looking at 500+ charts of individual names.
For simplicity, I’m illustrating the SPX-BPI as a line chart. You might see similar charts using traditional Xs and Os, but for our purpose, a line chart does the trick.
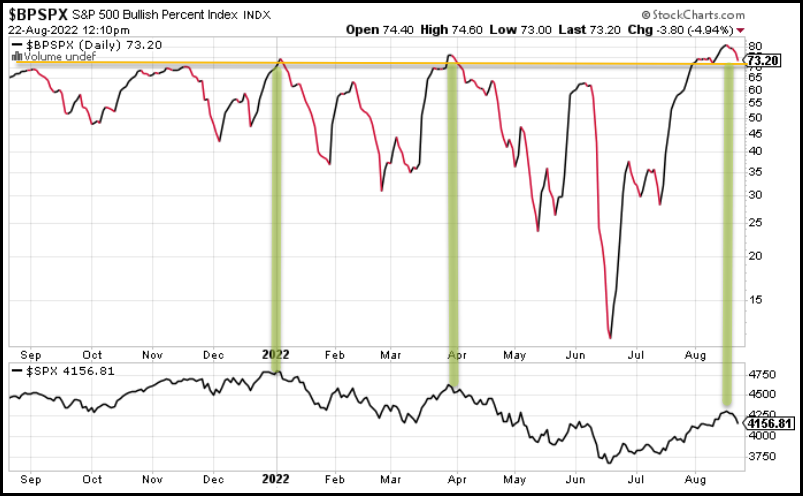
Here’s what you want to know about this chart today: When the line gets above 70% (at the yellow line) and then reverses below 70%, it’s considered a sell signal.
I’ve marked the two previous occurrences in 2022 when the SPX-BPI moved above 70% (considered overbought) and subsequently reversed lower.
The lower panel is the S&P 500. Note that during the two previous reversals of the BPI from above 70% to below 70%, the prices of the S&P 500 index reversed lower.
Now, look to the far right of the chart. During this most recent rally, the SPX-BPI moved as high as 80%. However, the last few trading days have seen the BPI moving lower, but still above what is considered overbought readings – 73.20%.
If the SPX-BPI falls below 70% in the next few trading days, this will be a sell signal.
So we know the S&P index has run headlong into resistance at its 200-day moving average, a downward sloping trendline from its January peak, and price congestion at ~4300.
Meaning that a move lower or even sideways from here should not come as a major surprise.
We also know that, based on BPI data, the S&P 500 sits at overbought conditions – and the two previous times in ‘22 that the BPI got overbought and reversed lower, the S&P 500 sold off.
I think investors need to ask…
Is this just a short-term pullback within the context of an ongoing reversal from bearish to bullish? So maybe it’s a buy the dip.
Or is this the end of the most recent Bear Market rally – where you may sell to protect profits or even use bearish puts as a mechanism to participate from the downside?
The answer is another question: What is your time frame and what is your tolerance for volatility?
If you have any questions or have been considering hiring an advisor, then schedule a free consultation with one of our advisors today. There’s no risk or obligation—let's just talk.
Tags

Free Guide: How to Find the Best Advisor for You
Get our absolutely free guide that covers different types of advisory services you'll encounter, differences between RIAs and broker-dealers, questions you’ll want to ask when interviewing advisors, and data any good financial advisor should know about you and your portfolio.
