Related Blogs
May 11, 2022 | Avalon Team
Regardless of daily headlines about the current direction of equity markets, what the Fed is thinking, or what Elon is doing, there are a few tried and true rules that remain pretty consistent.
And one of those rules is that without banks, there are no bull markets.
That doesn’t mean banks have to be the life of the party, but they have to at least show up.
And the problem is – they haven’t.
At a time when banks should be basking in the glory of higher rates (and a higher bottom line) banks are acting more like growth stocks than cyclical value plays.
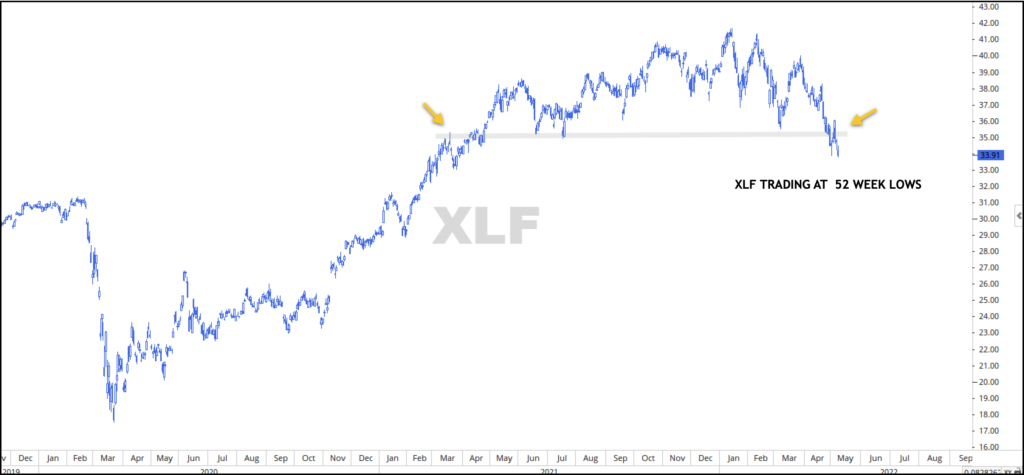
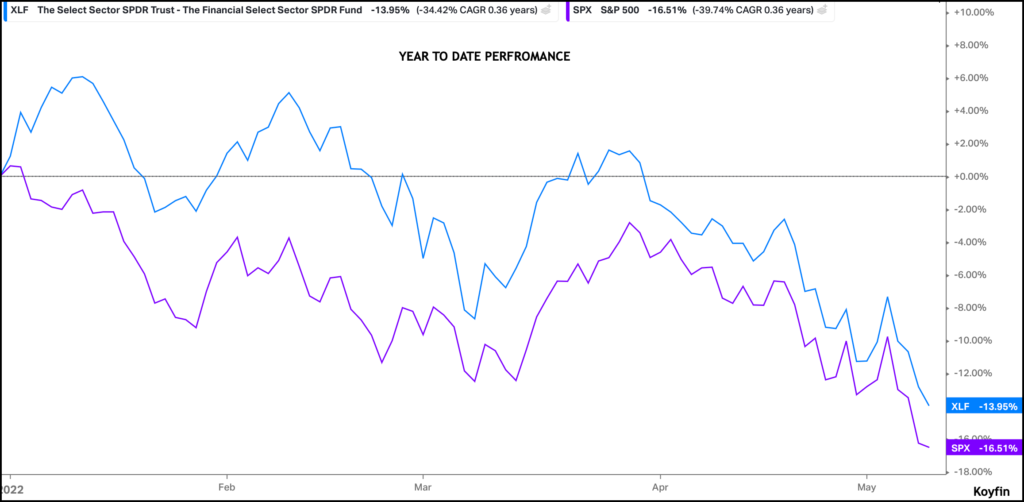
The SPDR Financial ETF XLF now sits at 52-week lows and its year-to-date performance is in line with the overall market – not with value stocks.
XLF has shed over 13% of its value this year, while the S&P 500 has a 16.51% drawdown.
And XLF would likely be enduring even larger drawdowns if it were not for its 15.22% stake in Berkshire Hathaway, Inc. (BRKB)
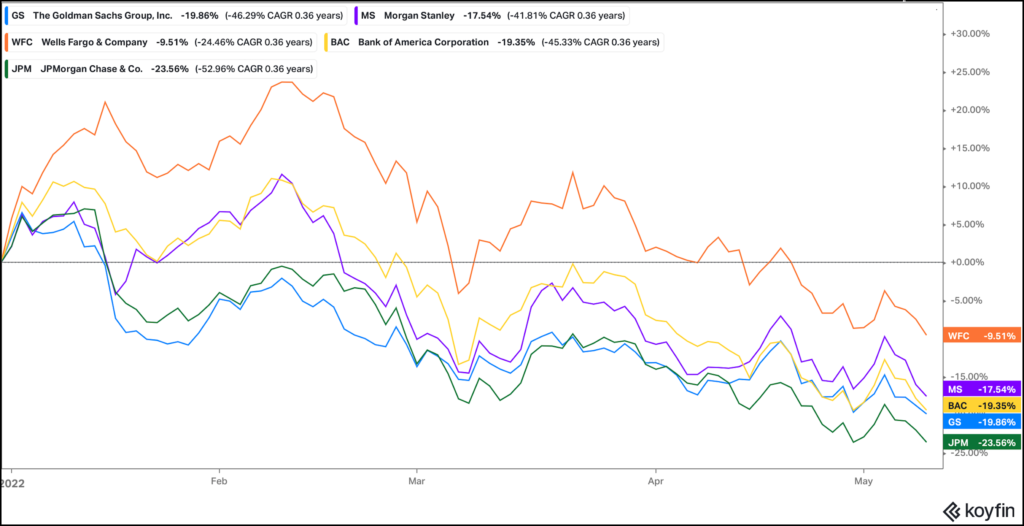
Some of XLFs biggest holdings (banks) are getting smoked in 2022.
We’re seeing real drawdowns in JP Morgan, Bank of America, Wells Fargo, Goldman Sachs, and Morgan Stanley – none of them have been immune to this year’s sell-off.
Here’s the thing… this isn’t just a story about a drawdown in Financials.
There are broader market implications when banks struggle.
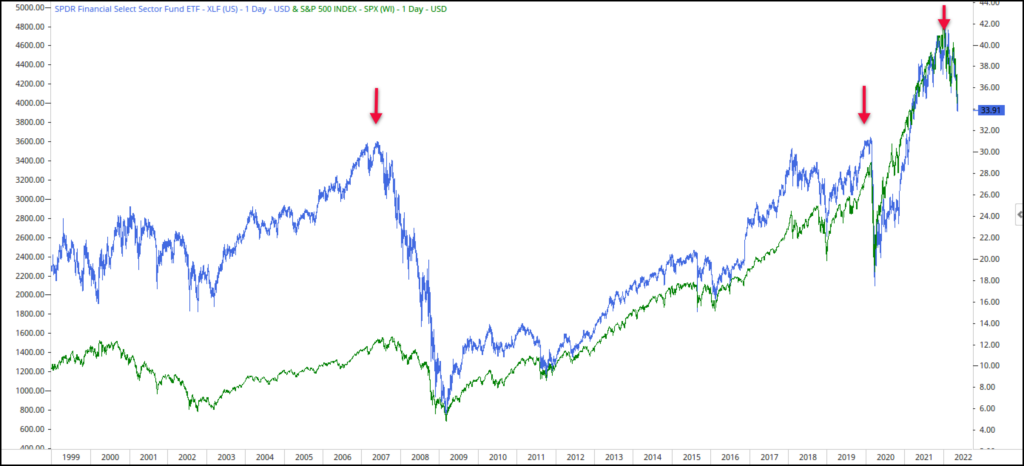
The price chart below tracks the performance of the Financial sector using XLF as its proxy and an overlay of the S&P 500 index.
I’ve outlined two historic market breakdowns below in 2008 and 2020 that proceeded or accompanied breakdowns in the S&P 500.
The question is, are Financials foreshadowing a more significant collapse in equity markets?
Where go banks, go the market…
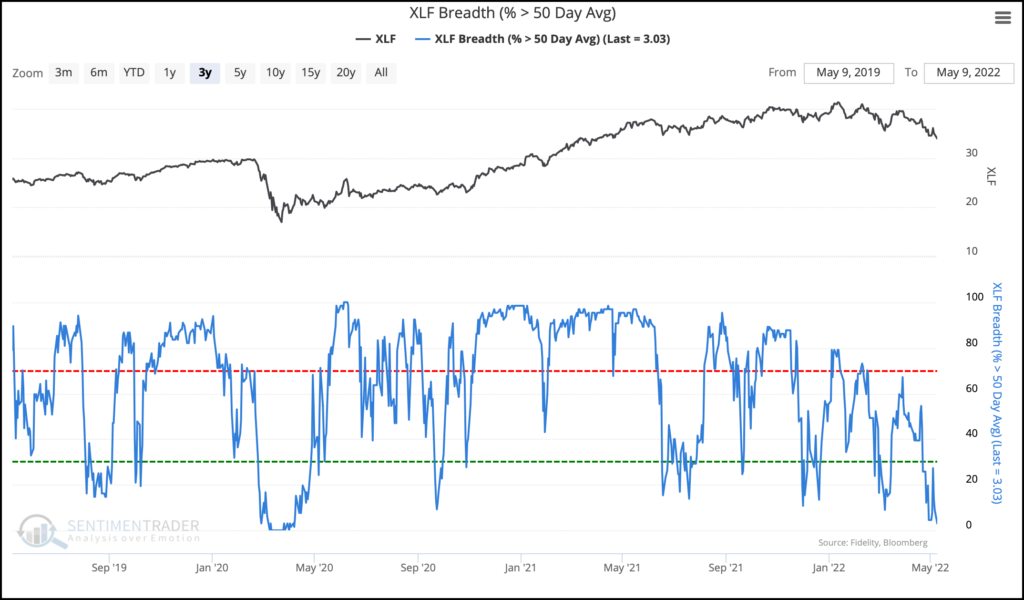
Digging deeper into breadth in Financials we can see the percentage of stocks in the sector trading above their 50-day moving average just fell below 5% after diverging from index prices for much of the past year.
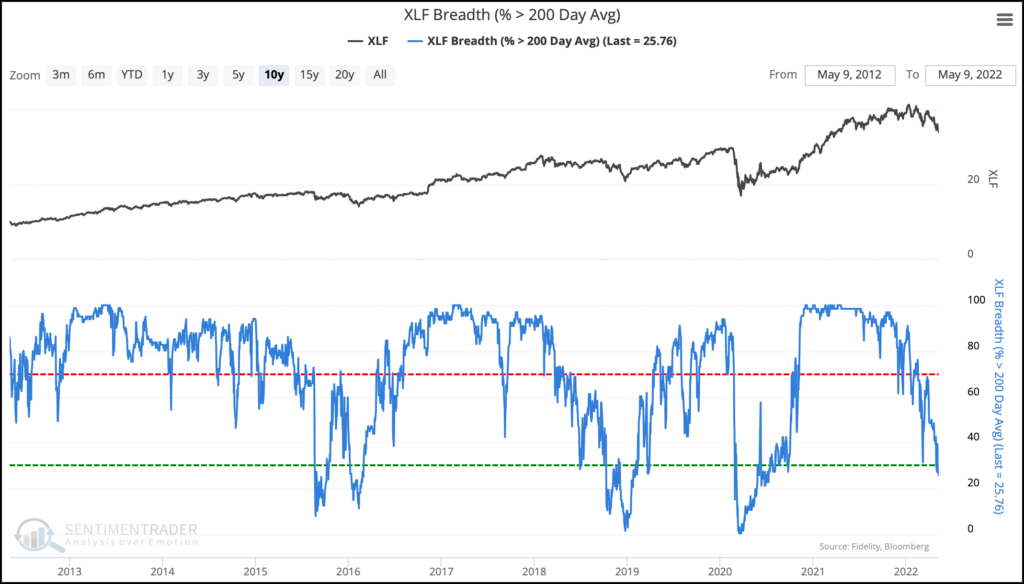
During healthy markets, the percentage of stocks in an index or sector that are trading above their long-term 200-day moving averages tends to stay above 60%.
During unhealthy markets, we usually see the opposite – fewer than 40% of stocks tend to hover above their averages.
For Financials, that’s what we’ve been seeing – the percentage of members above their 200-day average falling below 40%.
Key points:
- Fewer than 5% of Financials are trading above their 50-day averages.
- Fewer than 40% are holding above their 200-day averages, a worrying decline in long-term trends.
- Similar combinations have preceded poor returns in the sector and the broader market.
This vital sector is seeing souring trends.
For anyone other than the most current generation of investors, trouble in Financial sector stocks sends a shiver down the spine.
The meltdown in 2008 leaves the kind of scar that never fully heals. It seems hard for U.S. citizens to imagine now, but there was a daily worry about whether we would even be able to withdraw our own funds from banks the next day.
Equity investors do not want to see trouble in Financials. Traders tend to sell these stocks and ask questions later because a single over-leveraged client can bring down an entire institution.
With coincident and severe declines among a broad array of stocks and bonds, there is almost assuredly a large client somewhere that has blown up or is about to.
With investors avoiding stocks in this sector to the degree that they are now, it’s a worrying sign for all of us.
Financials remain an important key to the success of the broader market, so stay tuned for further follow-up.
If you have any questions or have been considering hiring an advisor, then schedule a free consultation with one of our advisors today. There’s no risk or obligation—let's just talk.
Tags

Free Guide: How to Find the Best Advisor for You
Get our absolutely free guide that covers different types of advisory services you'll encounter, differences between RIAs and broker-dealers, questions you’ll want to ask when interviewing advisors, and data any good financial advisor should know about you and your portfolio.


