
Related Blogs
May 3, 2023 | Avalon Team
Daily, I scan dozens of financial charts trying to fit the pieces of the economic puzzle. Recently, one chart really jumped out at me and I keep thinking about it. Here it is.
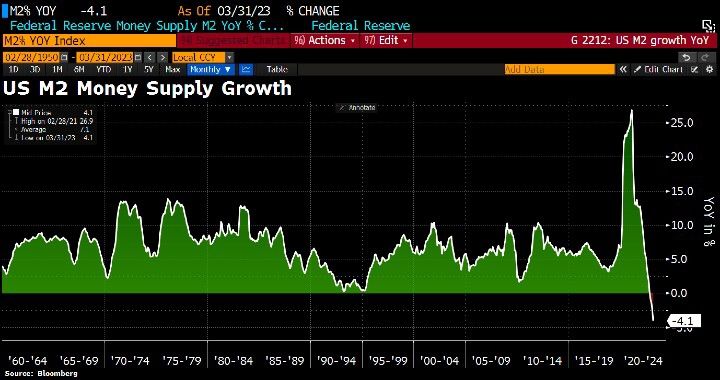
The chart above is of the U.S. Money Supply, or M2 as it is officially known.
You may be wondering why this chart is such a standout.
The reason is that the money supply has recently fallen 4.1% YOY which happens to be THE largest decline ever since the data was first introduced in 1959.
This is ringing alarm bells and suggests a decline in economic activity in the coming months.
Is this the canary in the coal mine?
Everyone knows that the Fed is fixated on inflation and in fact, is expected to raise rates again this week by another ¼ basis point.
It’s no secret that inflation has been hurting nearly everyone around the world and the central banks are now playing catch up.
But, is the Fed fighting the last war? Should we be more concerned about the other “flation” – Deflation?
Now, there can be benign deflation which is actually good. Back in the 1980s and 1990s in the thrust of globalization, jobs became outsourced to countries with lower labor costs, technology accelerated, and as a result, the cost of goods and services fell for decades.
And the U.S. consumer benefited, filling their homes with larger and larger big-screen TVs, faster computers, and gadgets of every type, and even managed to save a nickel or two which sent the stock market soaring.
In fact, this disinflationary trend was one of the major underpinnings of the rising stock market of the past several decades, along with falling interest rates, and favorable demographics.
But there can be another type of deflation that is far more destructive. And it is directly related to the boom-bust cycles that occur within the economy.
Let me explain.
The graph below shows Real Median Household Income which peaked in 2019. This means that income, after inflation, is lower than a few years ago.
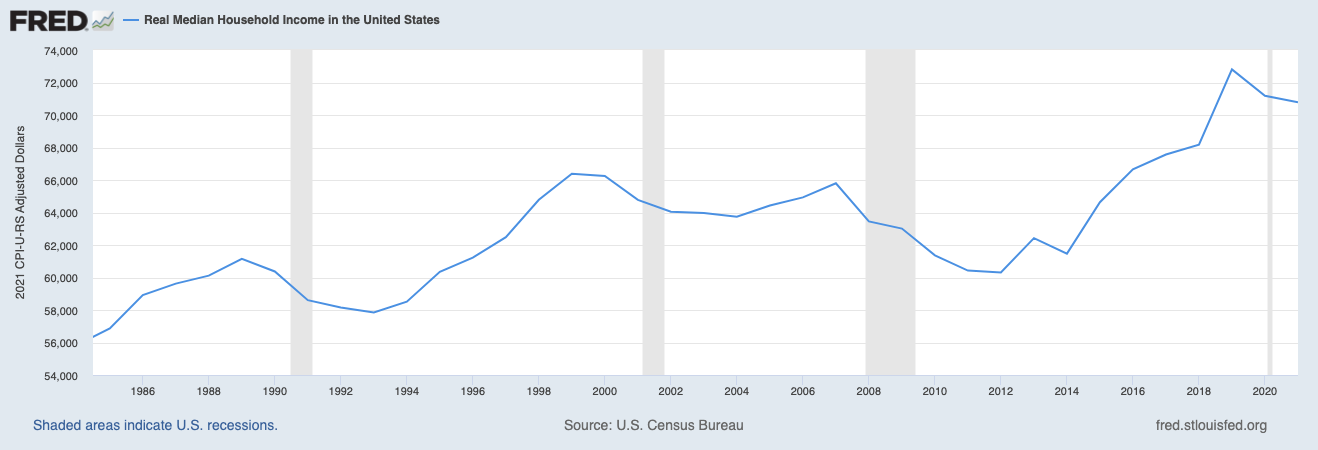
To continue to afford everything that they need and want, consumers have needed to rely more on debt, which is why consumer debt is at an all-time high.
In fact, it is becoming a massive problem.
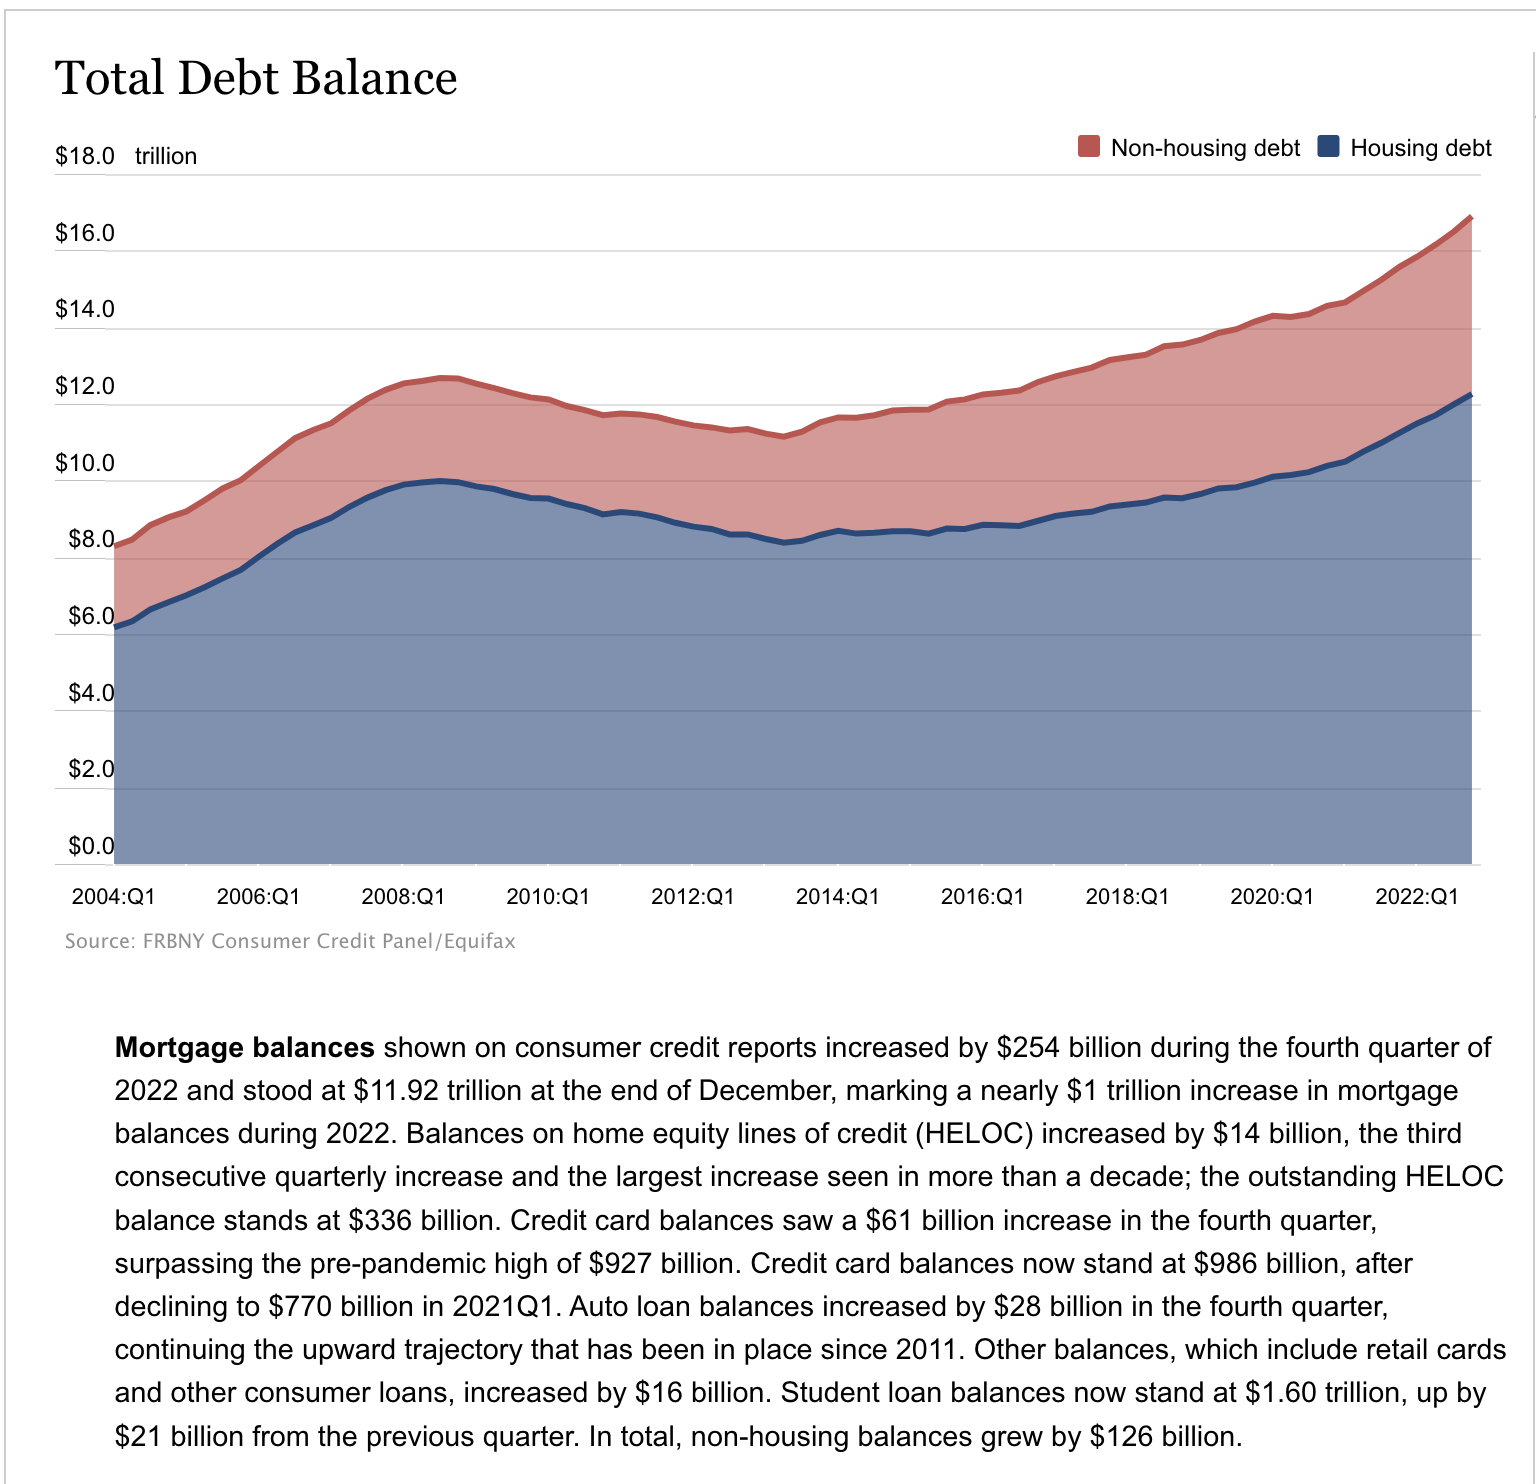
Credit Card debt alone in America is close to passing $1T dollars and the average rate on the debt is 24.24%!

Here are some more extremely worrying stats on credit card debt in the U.S:
- Among the 1.4 million Americans who are receiving benefits, 84% of them said they supplemented it by taking on more credit card debt.
- The national average of U.S. credit card balances has increased by more than $60 BILLION over the last 3 months, driven by the cost of living crisis.
- More than one-third of Americans now have MORE credit card debt than emergency savings, the HIGHEST on record.
- Gen-Z is racking up credit card debt faster than any other generation but Gen-X has the highest average amount of debt at $8,266 per person.
- In the next 10 years, Americans are on the hook for $10.5 TRILLION dollars in interest on the debt alone – that’s more than in the last 80 years.
- It’s not just credit card balances. Mortgages, auto loans, and student loans have all risen significantly over the past decade.
According to Austrian Business Cycle Theory, the business cycle unfolds in the following way: low-interest rates tend to stimulate borrowing, which leads to an increase in capital spending funded by newly issued bank credit. Proponents hold that a credit-sourced boom results in widespread malinvestment. A correction or credit crunch, commonly called a “recession” or “bust”, occurs when credit creation has run its course.
The money supply then contracts (or its growth slows), causing a curative recession.
To understand this more clearly, let’s take a closer look at the last several years.
In 2020, the Fed printed trillions of dollars that were introduced through the banking system. That is visible as the spike on the following graph.

At the same time, they brought interest rates to near 0%.
This led to a spike in lending, borrowing, and spending… and a spike in the stock market.
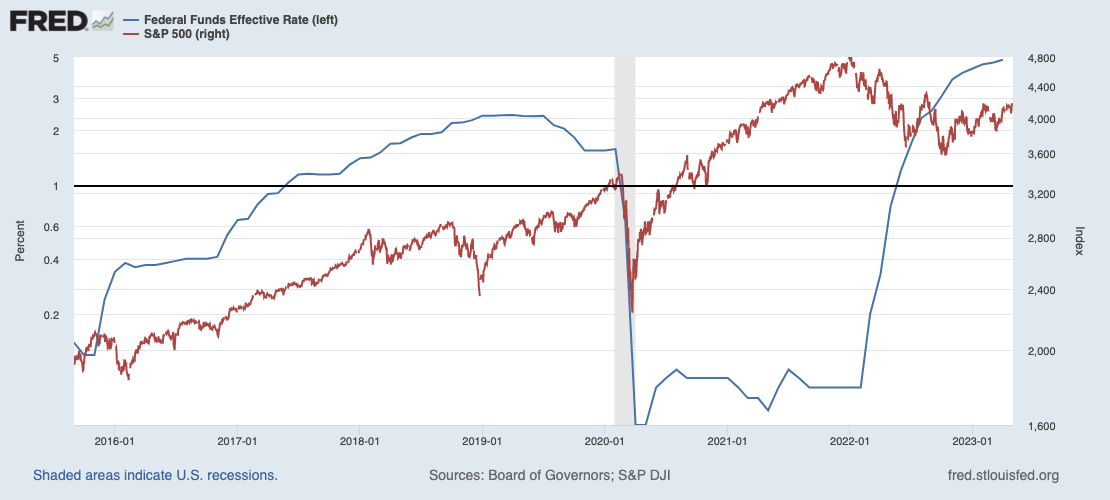
Effectively, financial asset prices began to spike the moment that the Fed turned on the printing press in early 2020, and financial asset prices stopped rising almost to the moment when the Fed turned off the printing press and began to increase rates at the beginning of 2022.
Now, it took a while for all of this newly printed money that was flooding the system to have an impact on the costs of goods and services. It would take over a year before inflation would reach its average of around 2.5% in March of 2022.

From there, it skyrocketed to over 9% by June of 2022.
So if it took a year for prices of goods and services to begin to rise after the printing press was turned on, does it make sense that there will be also a lag after the printing press is turned off?
Fast forward to today. Inflation is clearly falling and the month-over-month rate is also decelerating. For March that increase was just 0.1%.
Additionally, in March, the breadth of inflation declined to 54.3%
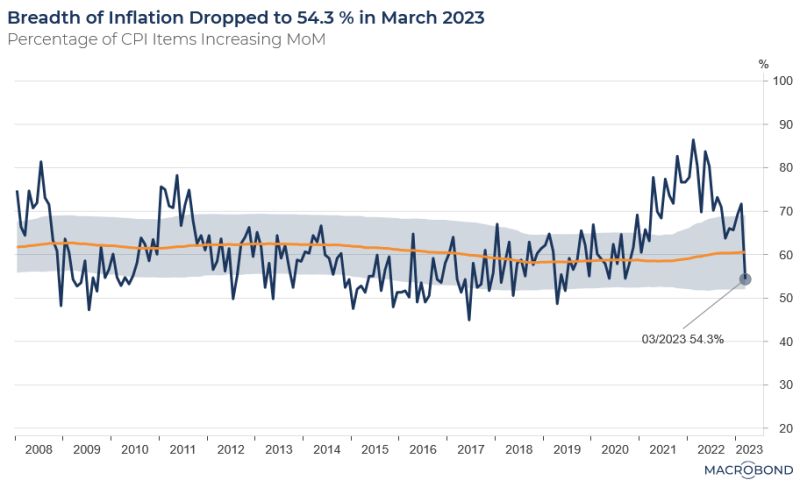
At the beginning of the year more than 85% of components were increasing – today it is just 54%.
This is a huge change since February when 70% of CPI items were increasing.
So all of this information does say that inflation is now heading back in the right direction.
Not only does higher inflation leads to higher prices but it also brings with it falling demand. And now we are beginning to see how inflation is a double-edged sword.
The issue becomes that prices reach such a point that consumers can no longer afford items and begin to forego purchases.
Here are some current examples.
While the U.S. export price index is up 5%, (reflecting inflated prices) the cargo volumes are down a staggering 30% in New York and New Jersey.

Even the semiconductor exports (nominal) are down 30% across Asia, indicating that global growth is undergoing a cyclical slowdown.
According to Bloomberg data, containers are stacking up in Shanghai even with China’s economy restarting.
This is due to the fact that exports have stalled, not imports. Demand from countries like U.S. & EU is slowing down.
Here is some further evidence.
The trucking industry is beginning to contract. Remember those reports about out-of-control diesel prices?
You will be stunned to know that diesel prices are down 50% in the last year as demand plummets from the biggest fuel guzzler: “The Freight Industry.”
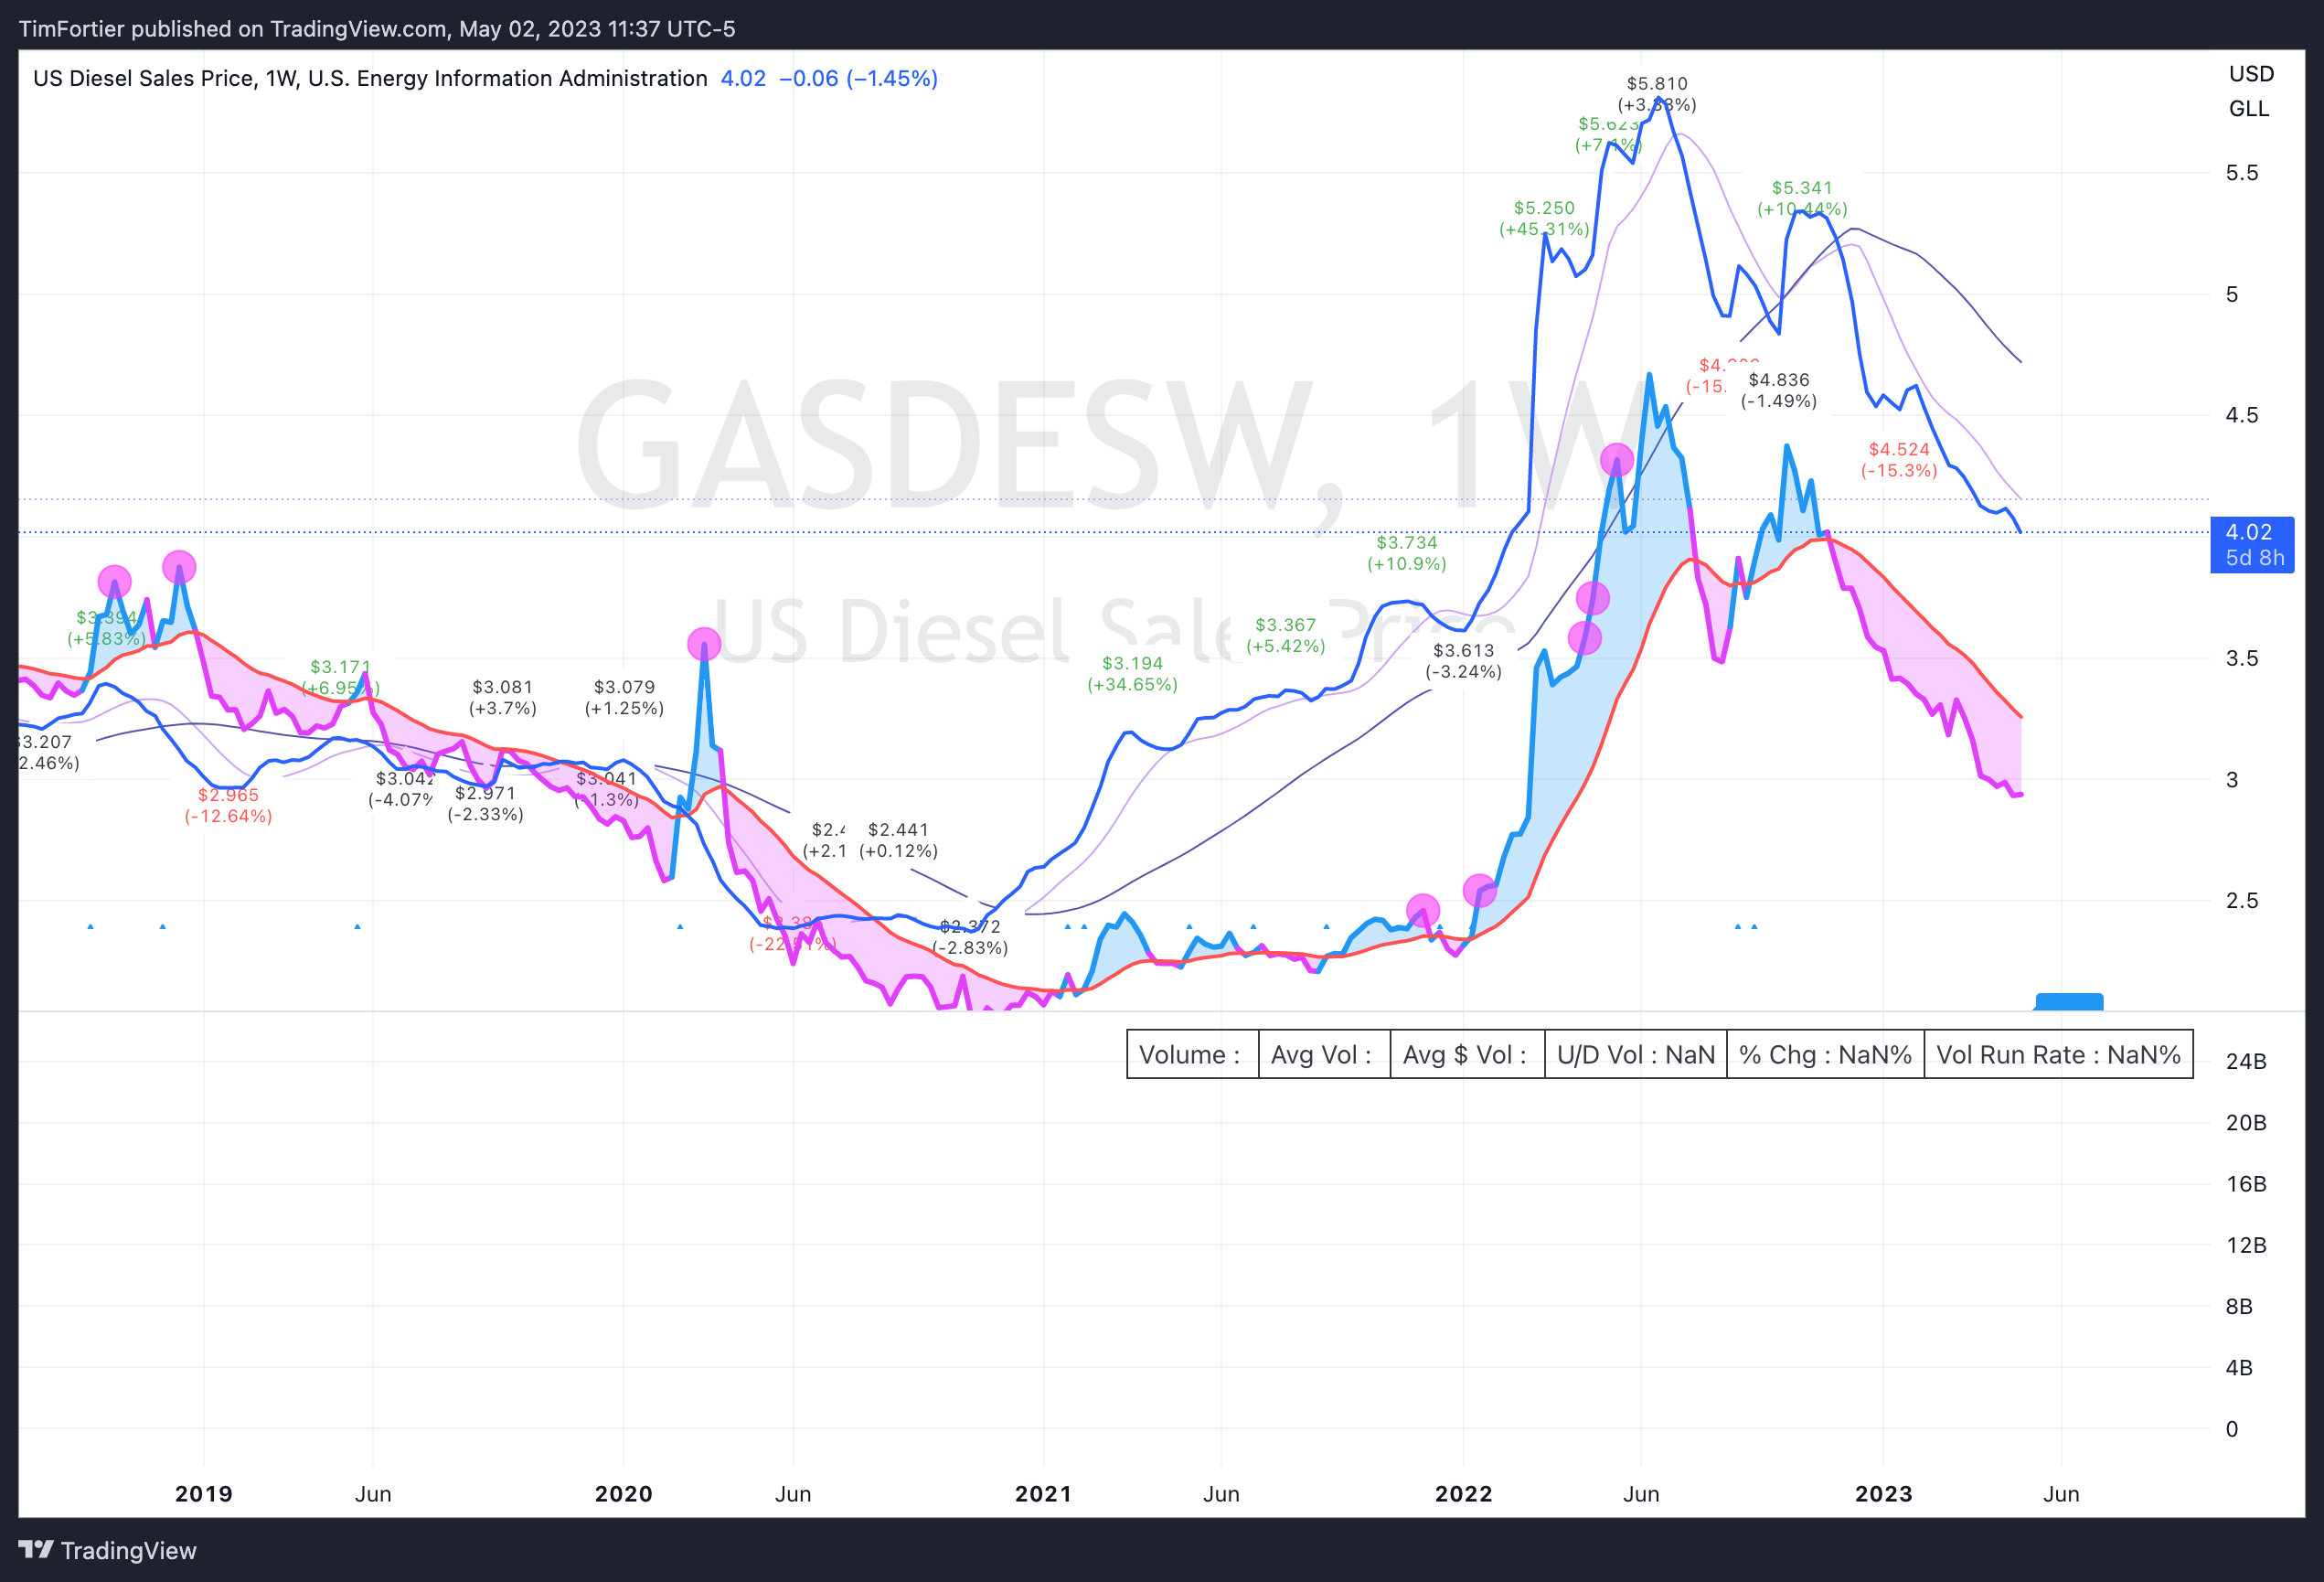
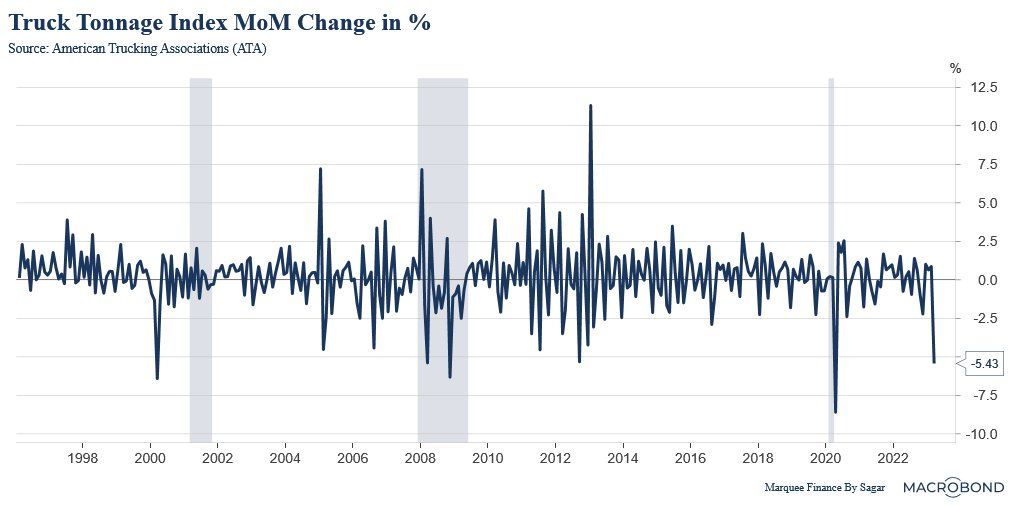
The situation is worrisome as reports from Wall Street Journal indicate that some truckers have begun to sell their trucks.
This is because demand for freight has already fallen to recession levels, as this graph shows.
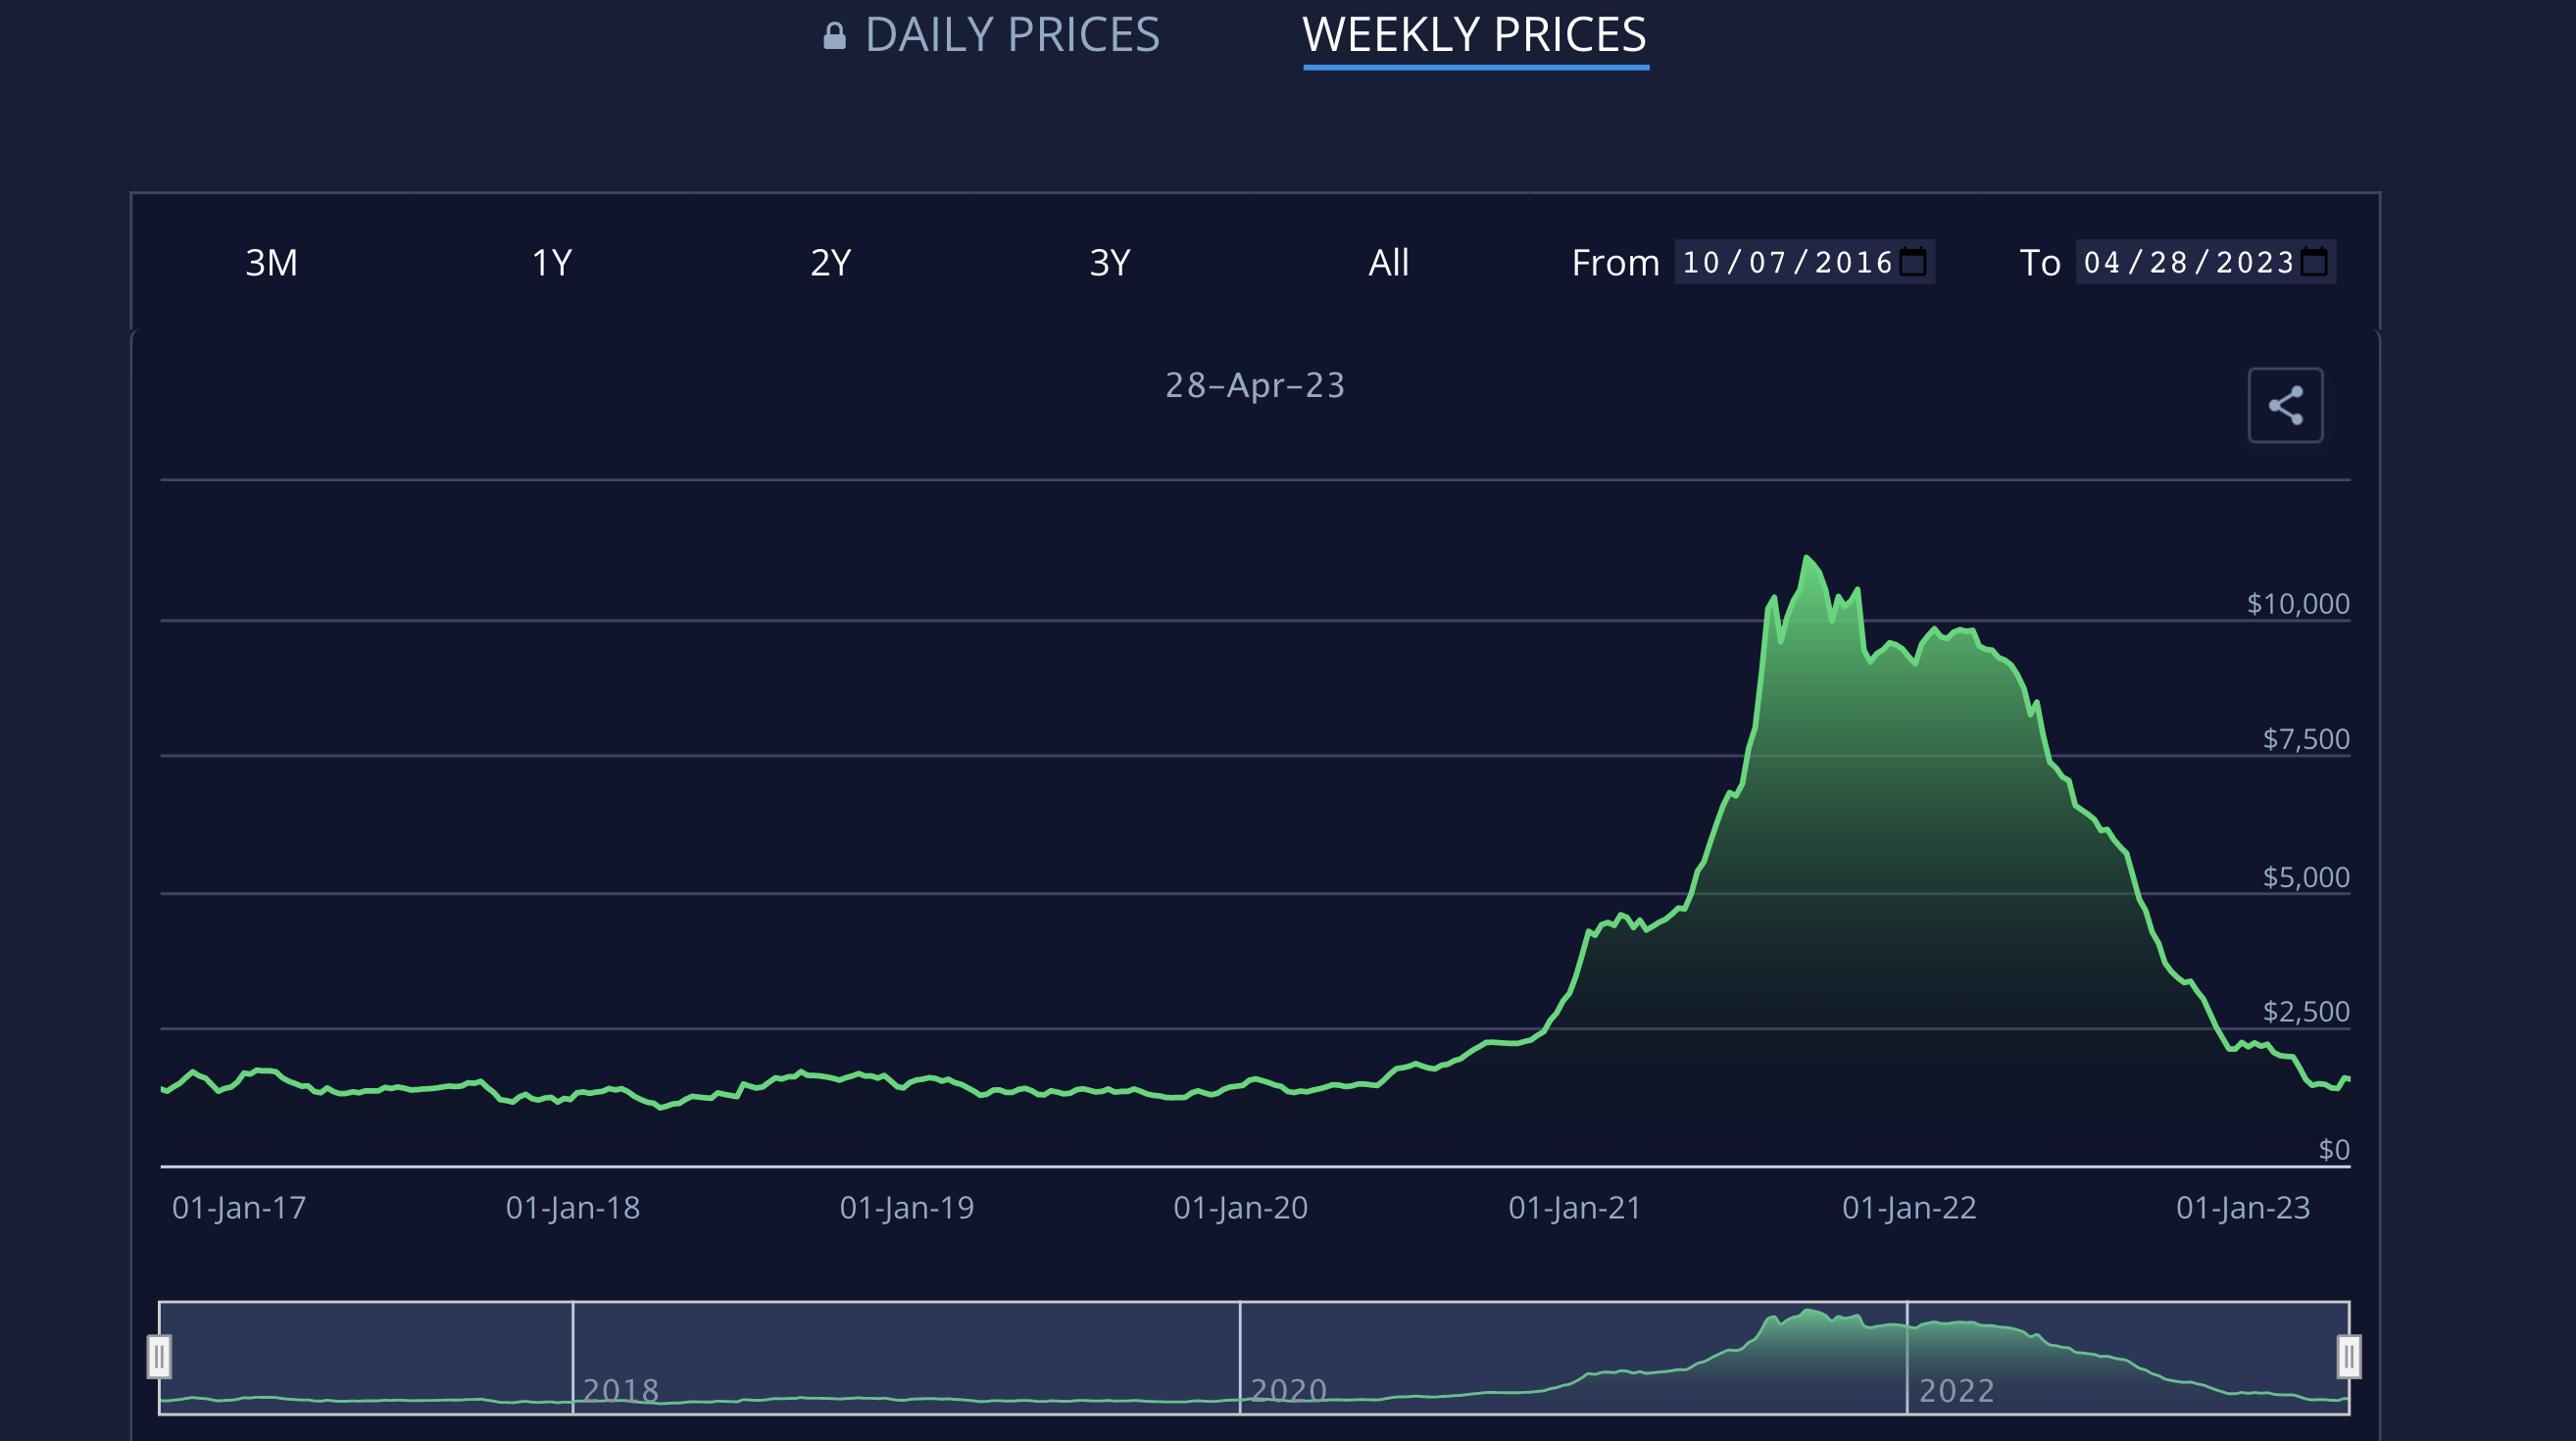
In fact globally, freight costs have fallen below the previous level that occurred during “normal” business activity as this chart of the Baltic Index displays.
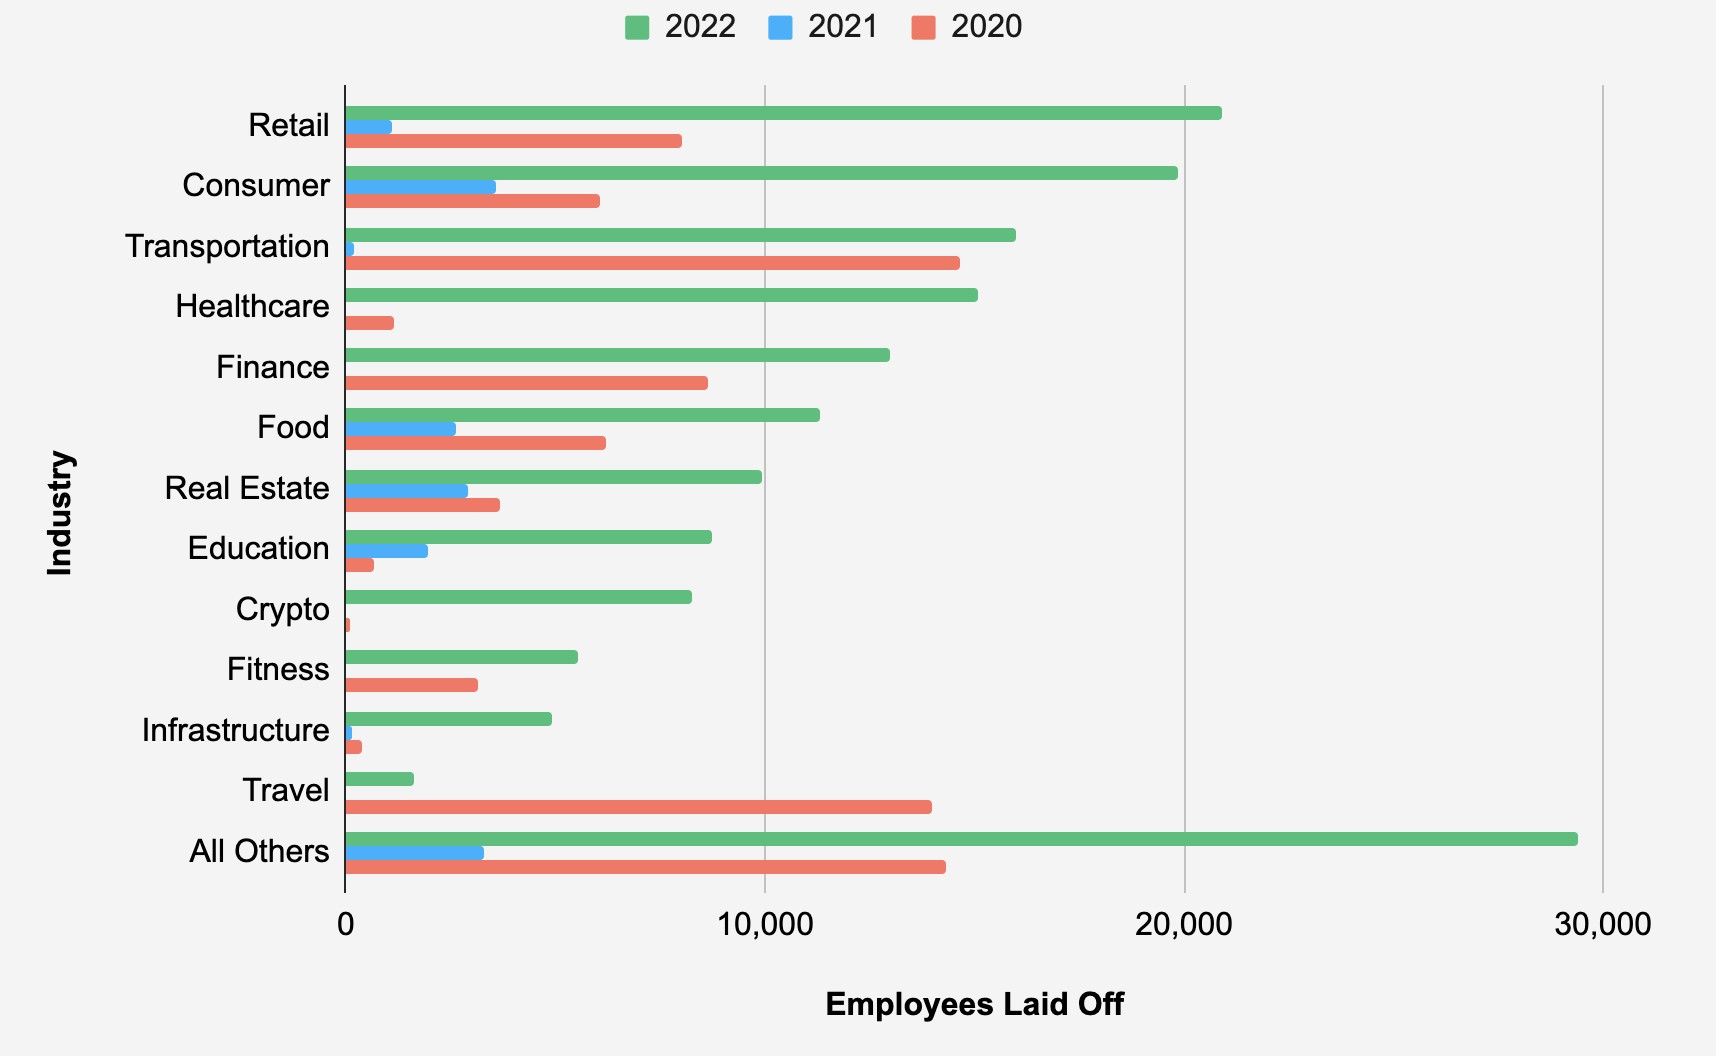
Also, let’s not forget the layoffs. While the layoffs in the tech industry have gotten a lot of attention, layoffs are increasing across all industries.
The data is suggesting that the economy is beginning to slow down in a big way.
Deflationary forces are kicking into motion – lending standards rising, credit growth slowing, layoffs, etc.
This leads to less money in circulation… and a falling money supply.
The issue with the “bust” side of the cycle is that it can gain momentum just as the increase in inflation did. Given how leveraged the global economy is, the unwind could be historic.
This is why deflation may become our biggest financial threat.
If you have any questions or have been considering hiring an advisor, then schedule a free consultation with one of our advisors today. There’s no risk or obligation—let's just talk.
Tags

Free Guide: How to Find the Best Advisor for You
Get our absolutely free guide that covers different types of advisory services you'll encounter, differences between RIAs and broker-dealers, questions you’ll want to ask when interviewing advisors, and data any good financial advisor should know about you and your portfolio.
