
Related Blogs
November 7, 2023 | Avalon Team
Last week, the S&P 500 put in the biggest green week since the market bottomed last October.
Interestingly, the largest green week prior to that happened to be the exact same week last year – the first week of November.
The catalyst for the “risk on” trade was twofold.
First, the Fed paused rate hikes for the second consecutive time as the committee unanimously agreed to keep rates on hold.
The U.S. Treasury yields fell sharply following the decision, with the 10-year bond yield dropping by 14 basis points and the 2-year yield slipping by 12 basis points, falling below 5% for the first time since October 10.
The second catalyst was the announcement from the Treasury that the amount of anticipated borrowings was to come in a little less than what had been estimated.
Additionally, Secretary Yellen chose to have the Treasury shift its issuance from its traditional breakdown of 15%-20% short-term debt / 80%-85% long-term debt, to favor issuing more short-term debt for the foreseeable future.
Doing this alleviates some pressure on long-term Treasuries and stocks, which are priced based on the former’s yields.
As readers may recall, the previous auction of long-term bonds went off poorly, causing volatility in the bond market and rates to increase sharply.
Technically, interest rates on the Ten-Year have broken the bottom of the trend channel that rates have followed since May.

While this may alleviate some pressure on stocks in the short term, investors would be wise to consider the longer-term view on rates. which is that rates are rising from a multi-decade channel.
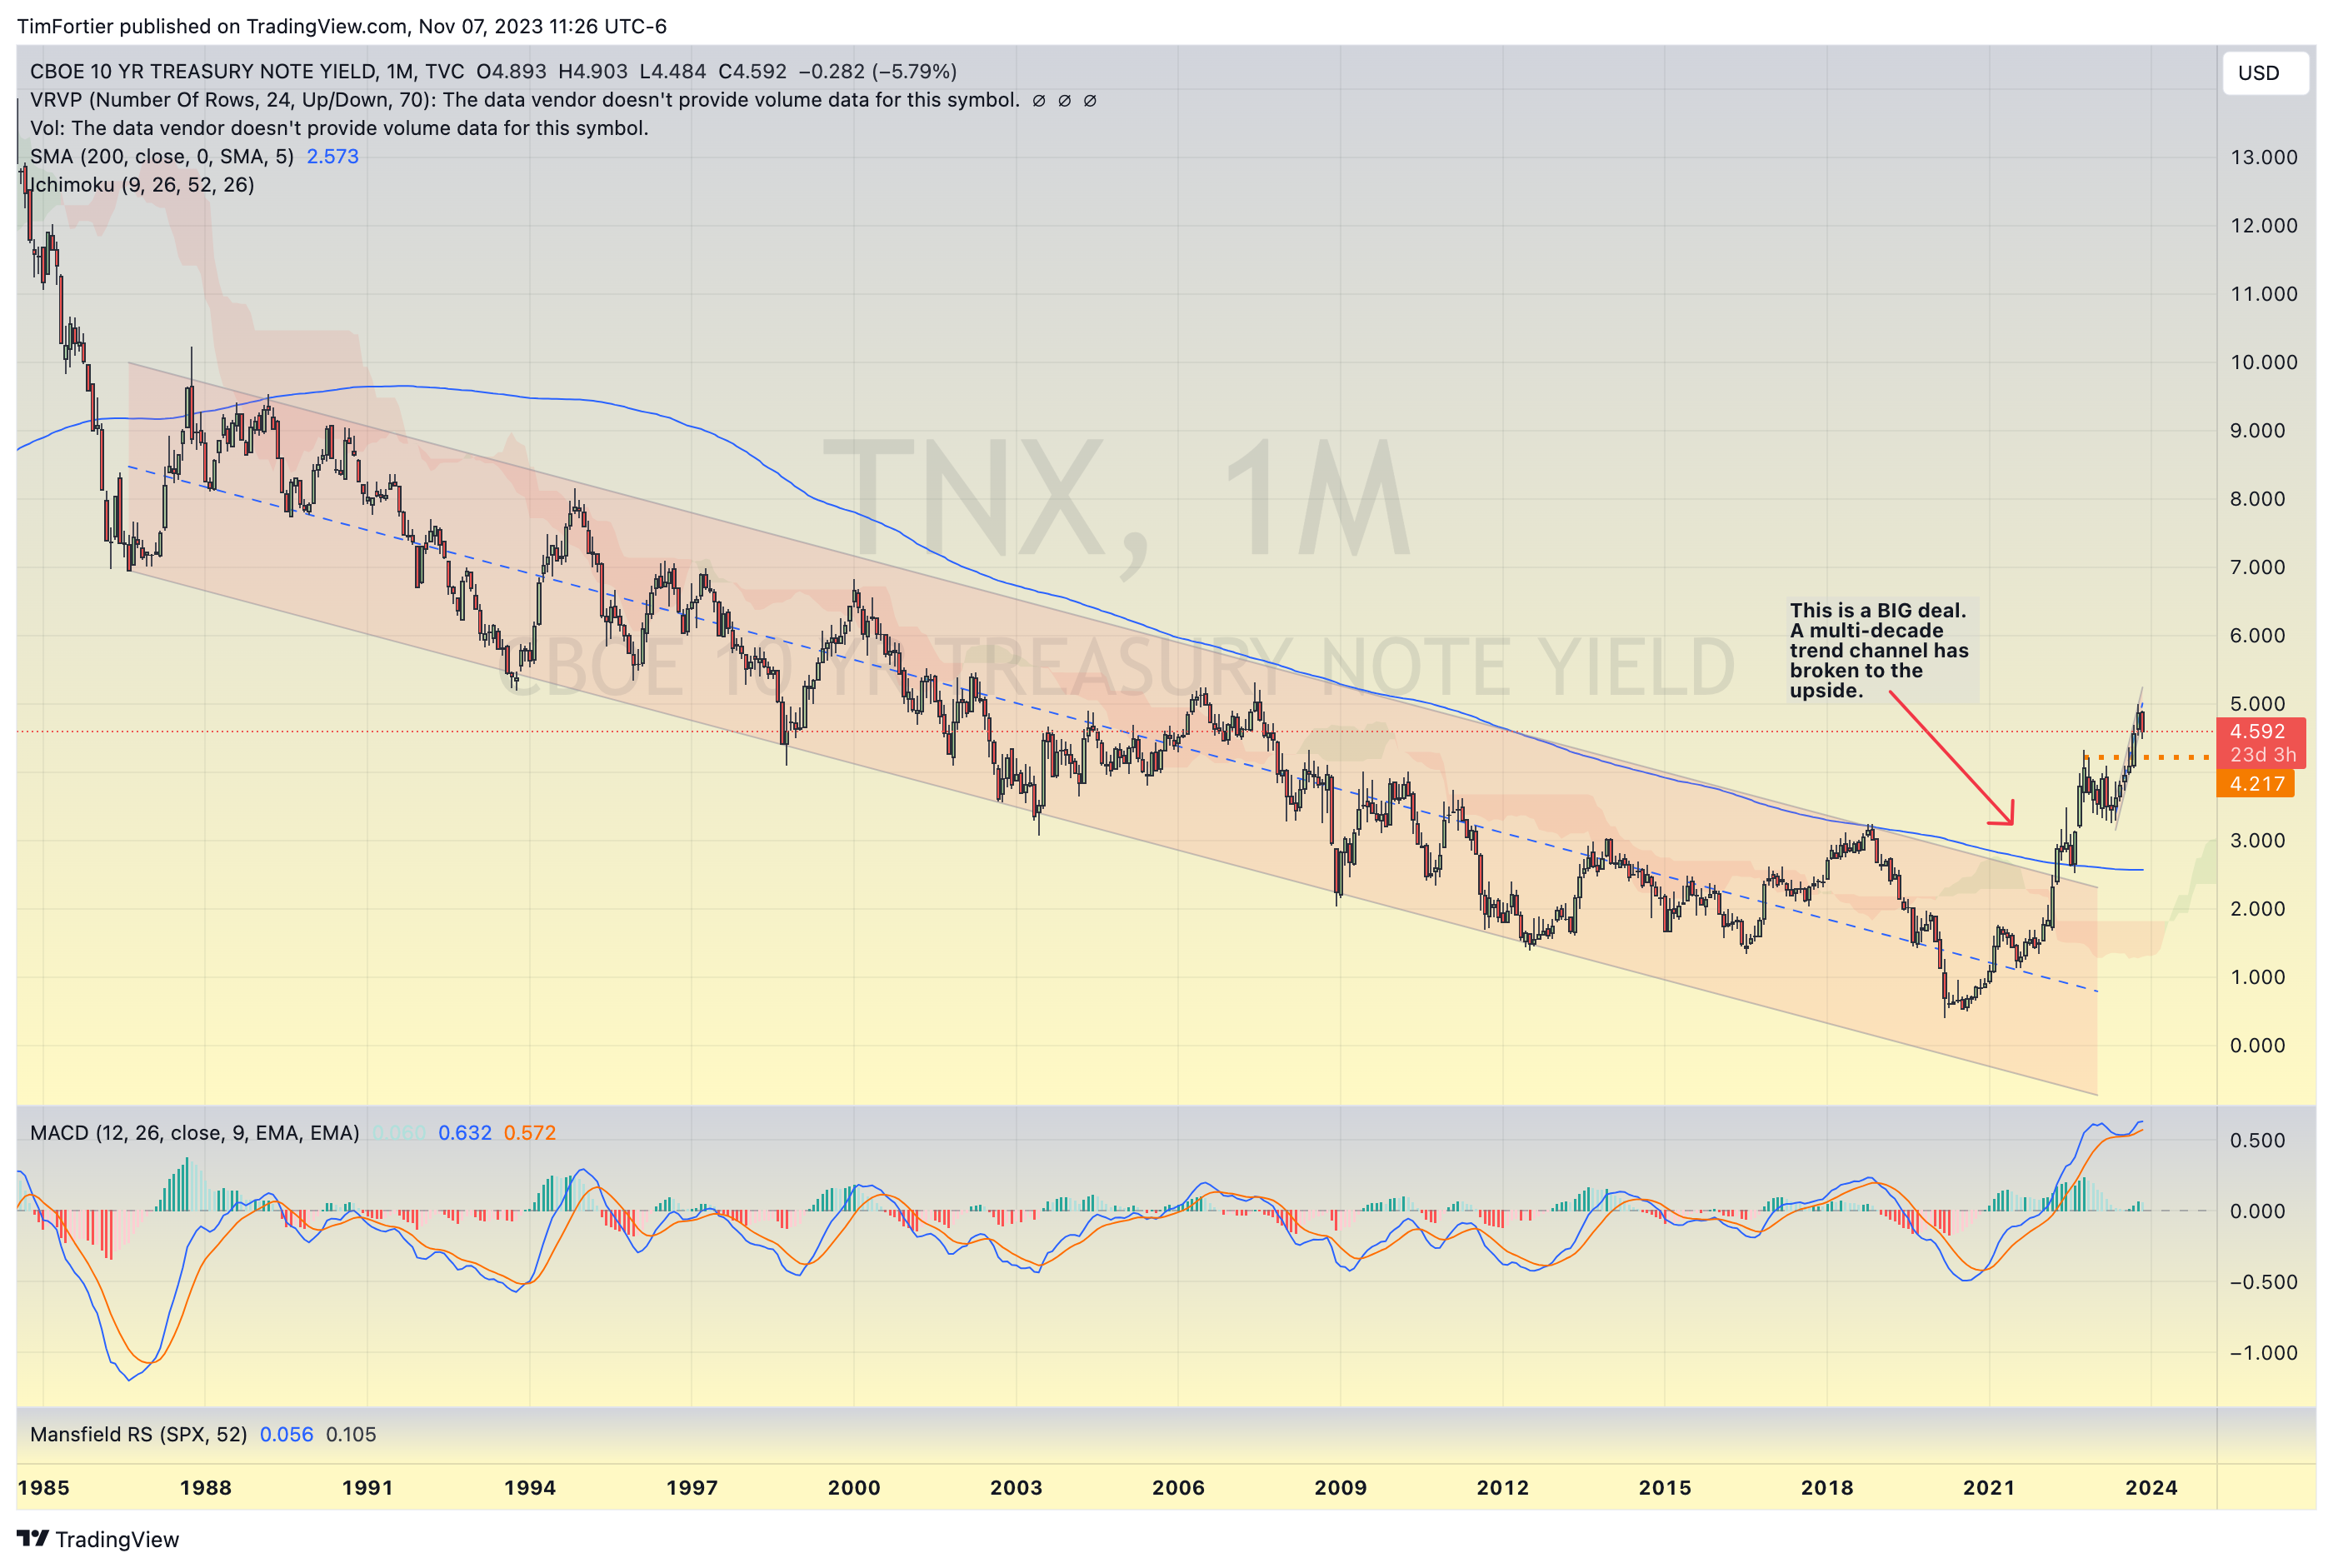
And given the rate of increase in debt with the inability to limit spending, I have difficulty seeing how this genie is going back into the bottle.
Based on last week’s announcement, the Treasury will add $2.5T in debt by the end of Q1 24, compared to the beginning of this year.
By late 2024, the U.S. will have nearly $35 trillion in debt.
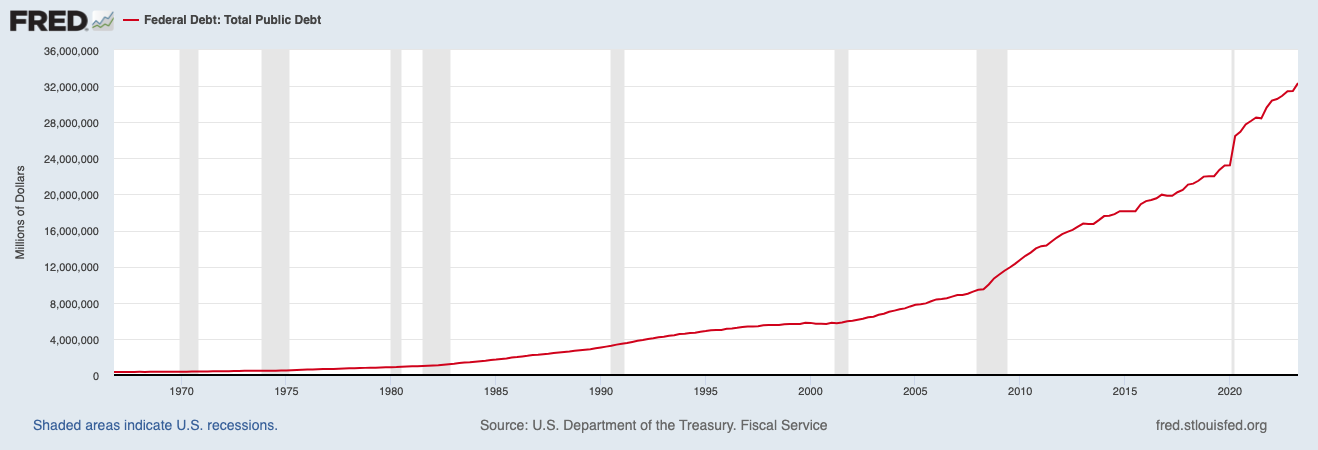
And unless rates fall drastically (not expected), as more debt rolls over, the interest payments, currently around $900 billion, will also increase.
If the debt were to be refinanced today, the interest cost would increase to $1.6 trillion.
Market Internals Turn Bullish
Last week’s buying was enough to turn my bullish percent timing indicators bullish.
Shown below is the indicator for the NYSE, but note that both the SPX and NDX are also confirmed.
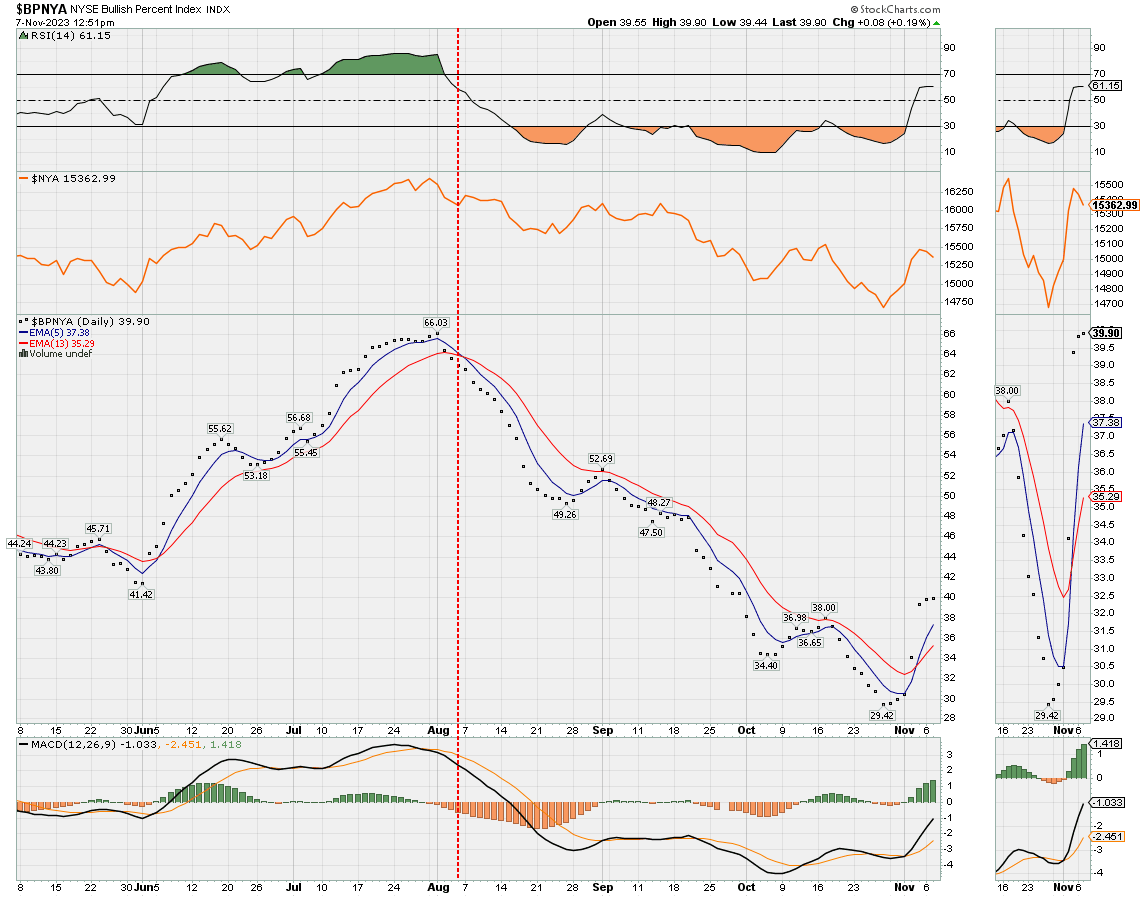
This was also confirmed with the Nasdaq McClellan Summation Index also triggering a buy signal.

As I noted last week, the percentage of stocks below their 50-day moving average had reached a deeply oversold level from where contrarian buying opportunities normally exist.
It would be good now to see this indicator advance over 50%, indicating a healthier market where more stocks are technically sound.

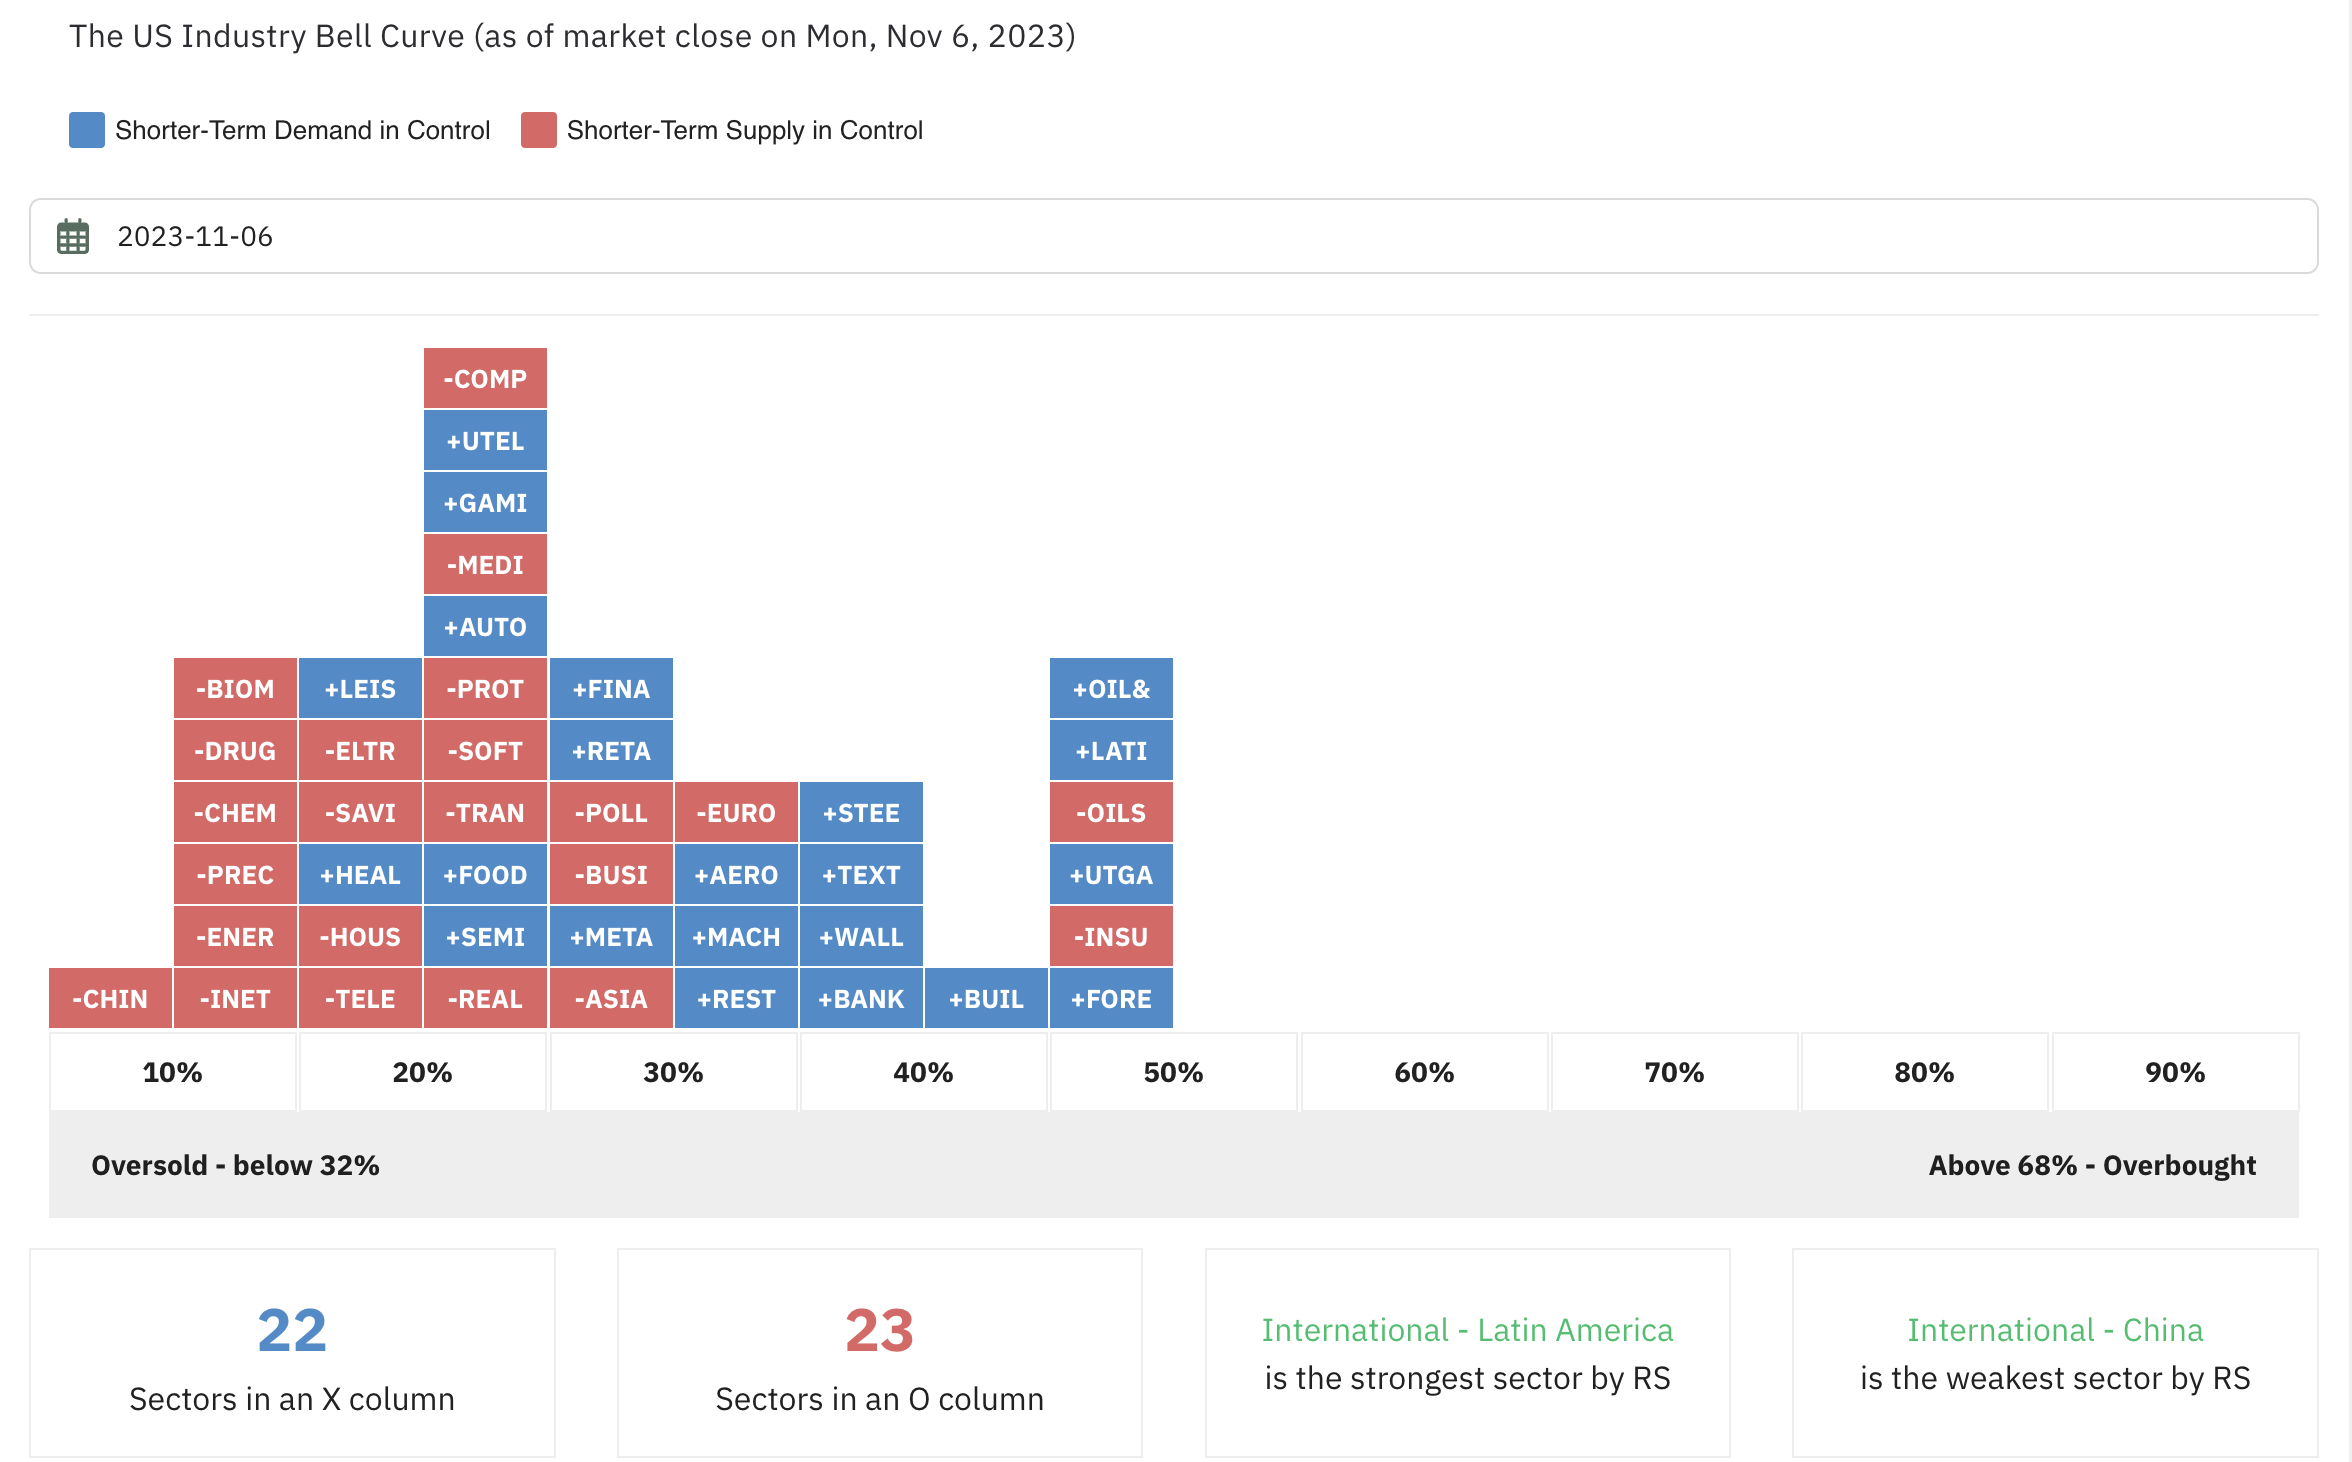
The U.S. Sector Bell Curve shows a significant improvement from the end of October when only five sectors were bullish.
Today, nearly half of the sectors are controlled by demand.
The U.S. Stock Market
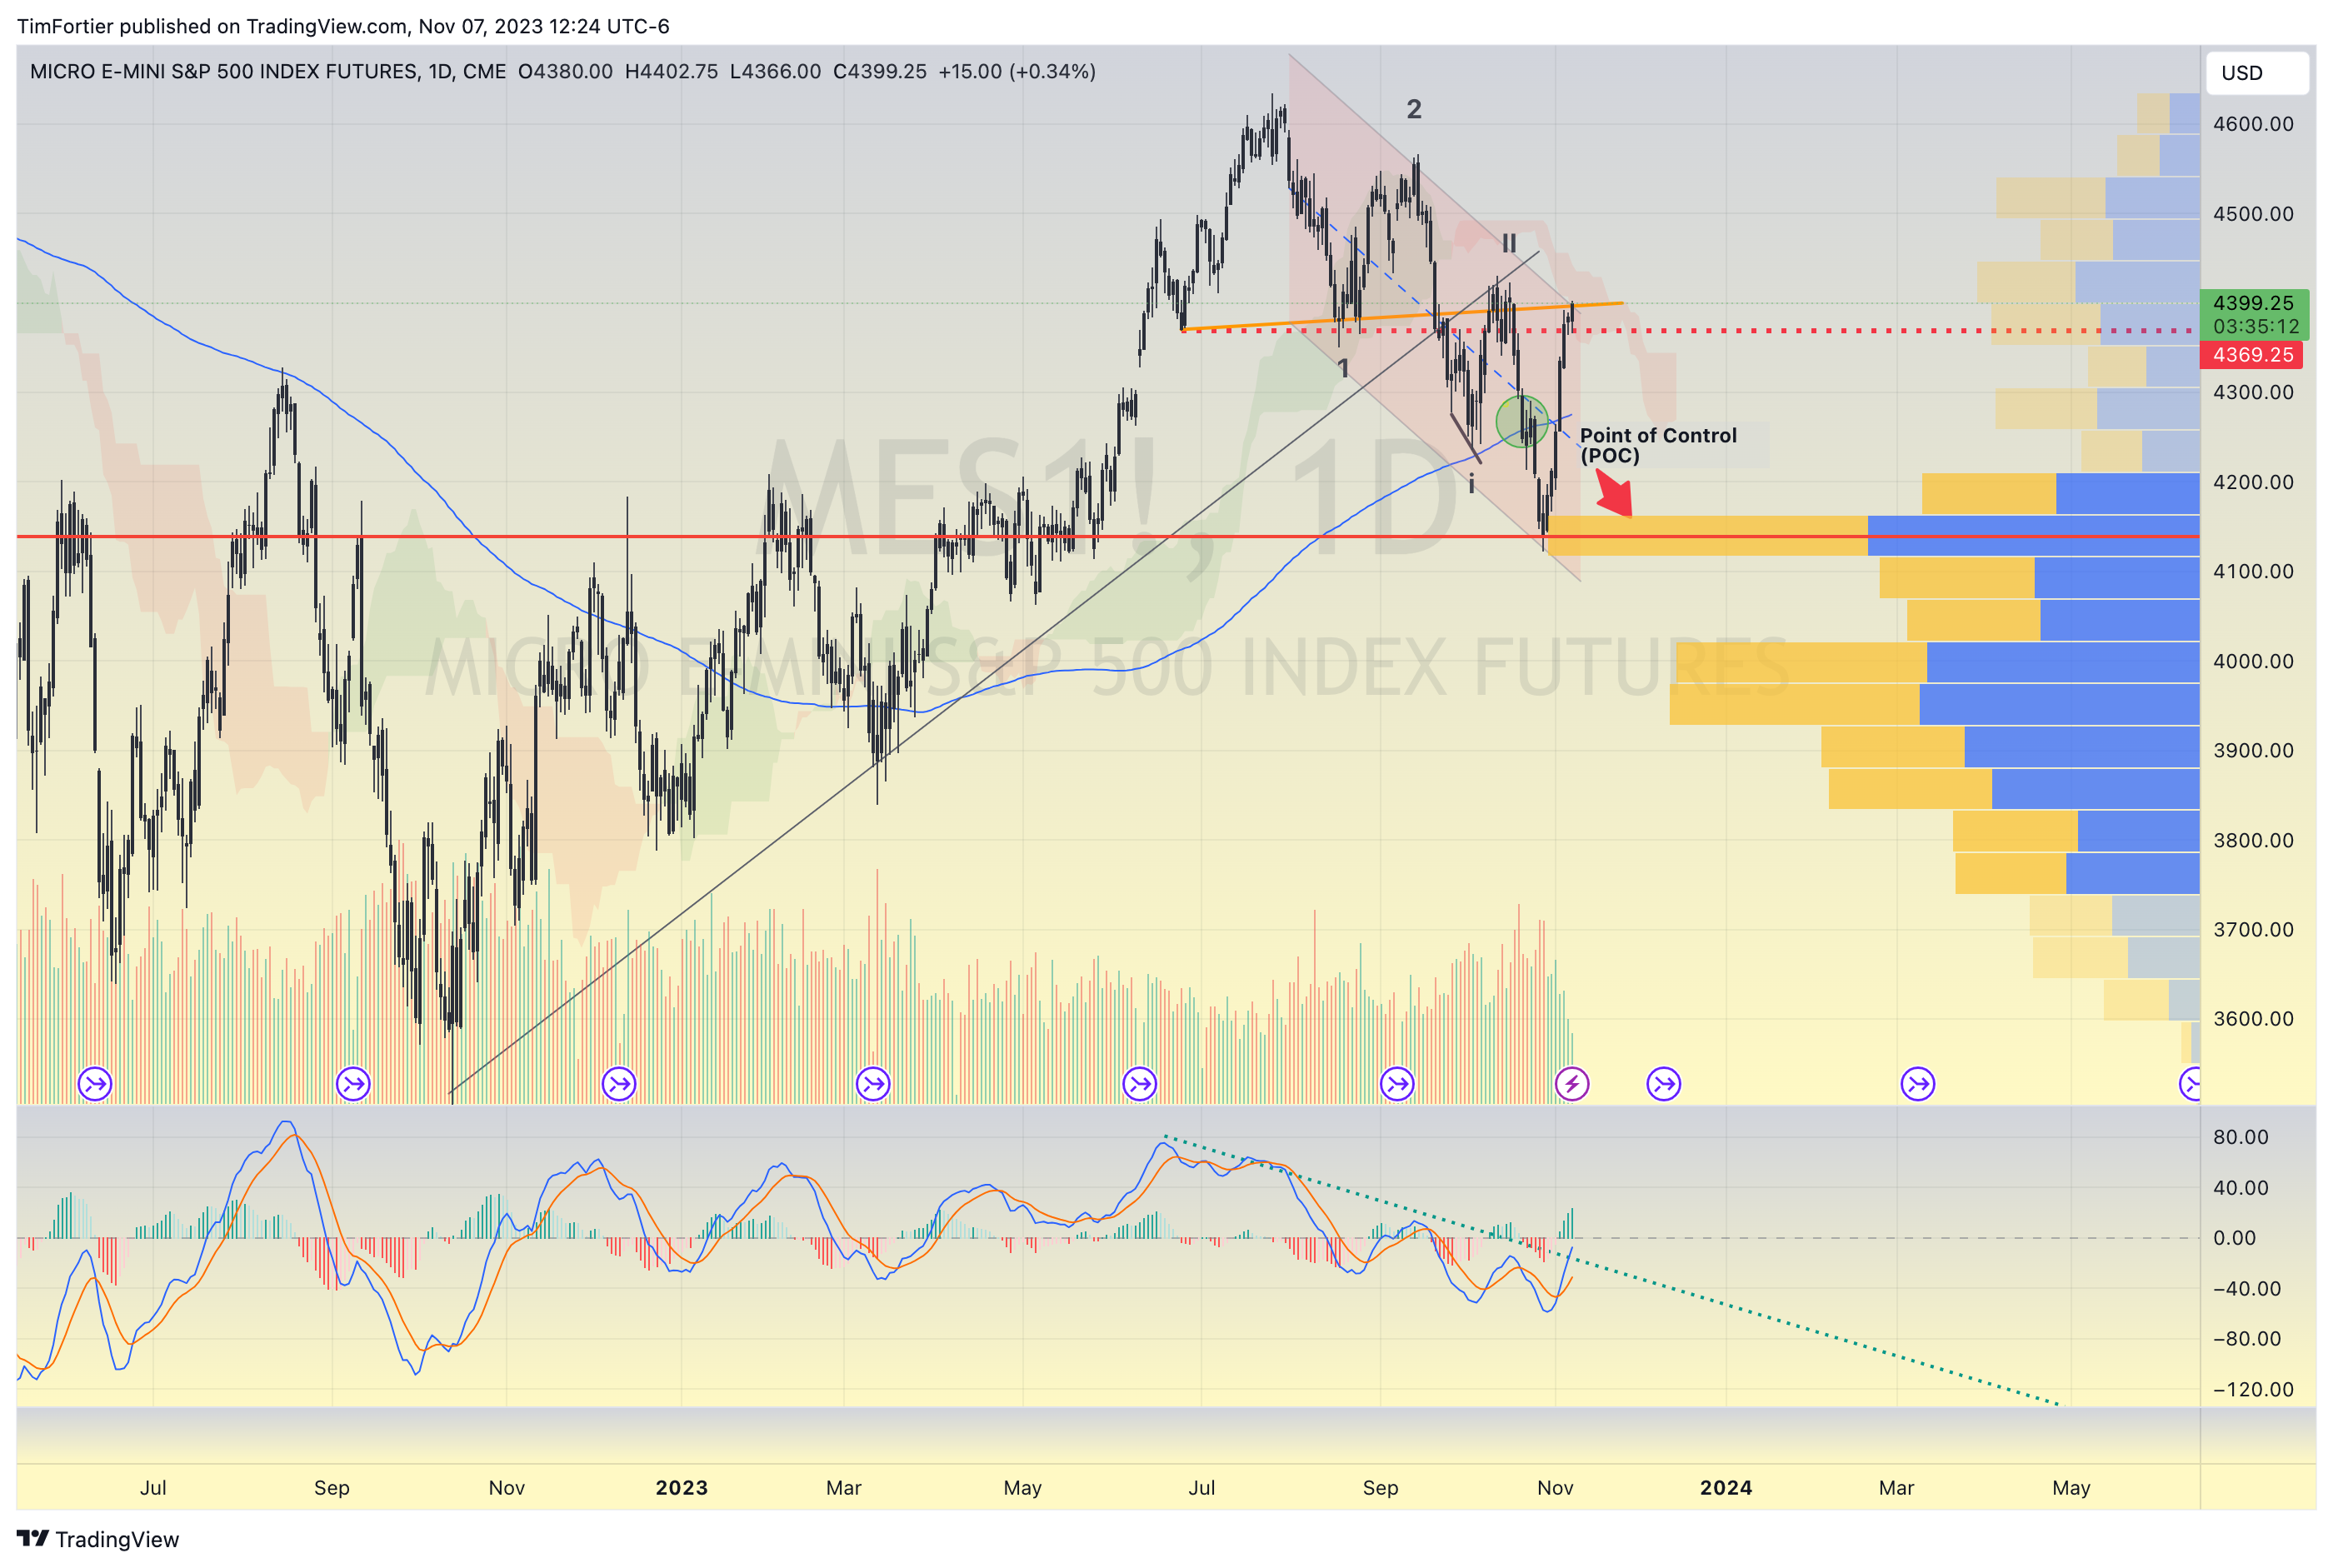
The S&P 500 (shown below are the S&P 500 futures) has been in a defined trend channel lower since topping out in July.
Price did a near-perfect pivot from the first major point of control (POC), as displayed with the volume profile.
Today, the price is challenging the top-of-the-trend channel and, if cleared, will likely find some resistance around the 4424 level.
The Nasdaq 100 (as shown by the NDX futures) is currently above the declining trend channel and a close above would be another positive indication for market bulls.
Its next hurdle will likely be around 15,700.

Despite the improvements in the market, I still have some caution.
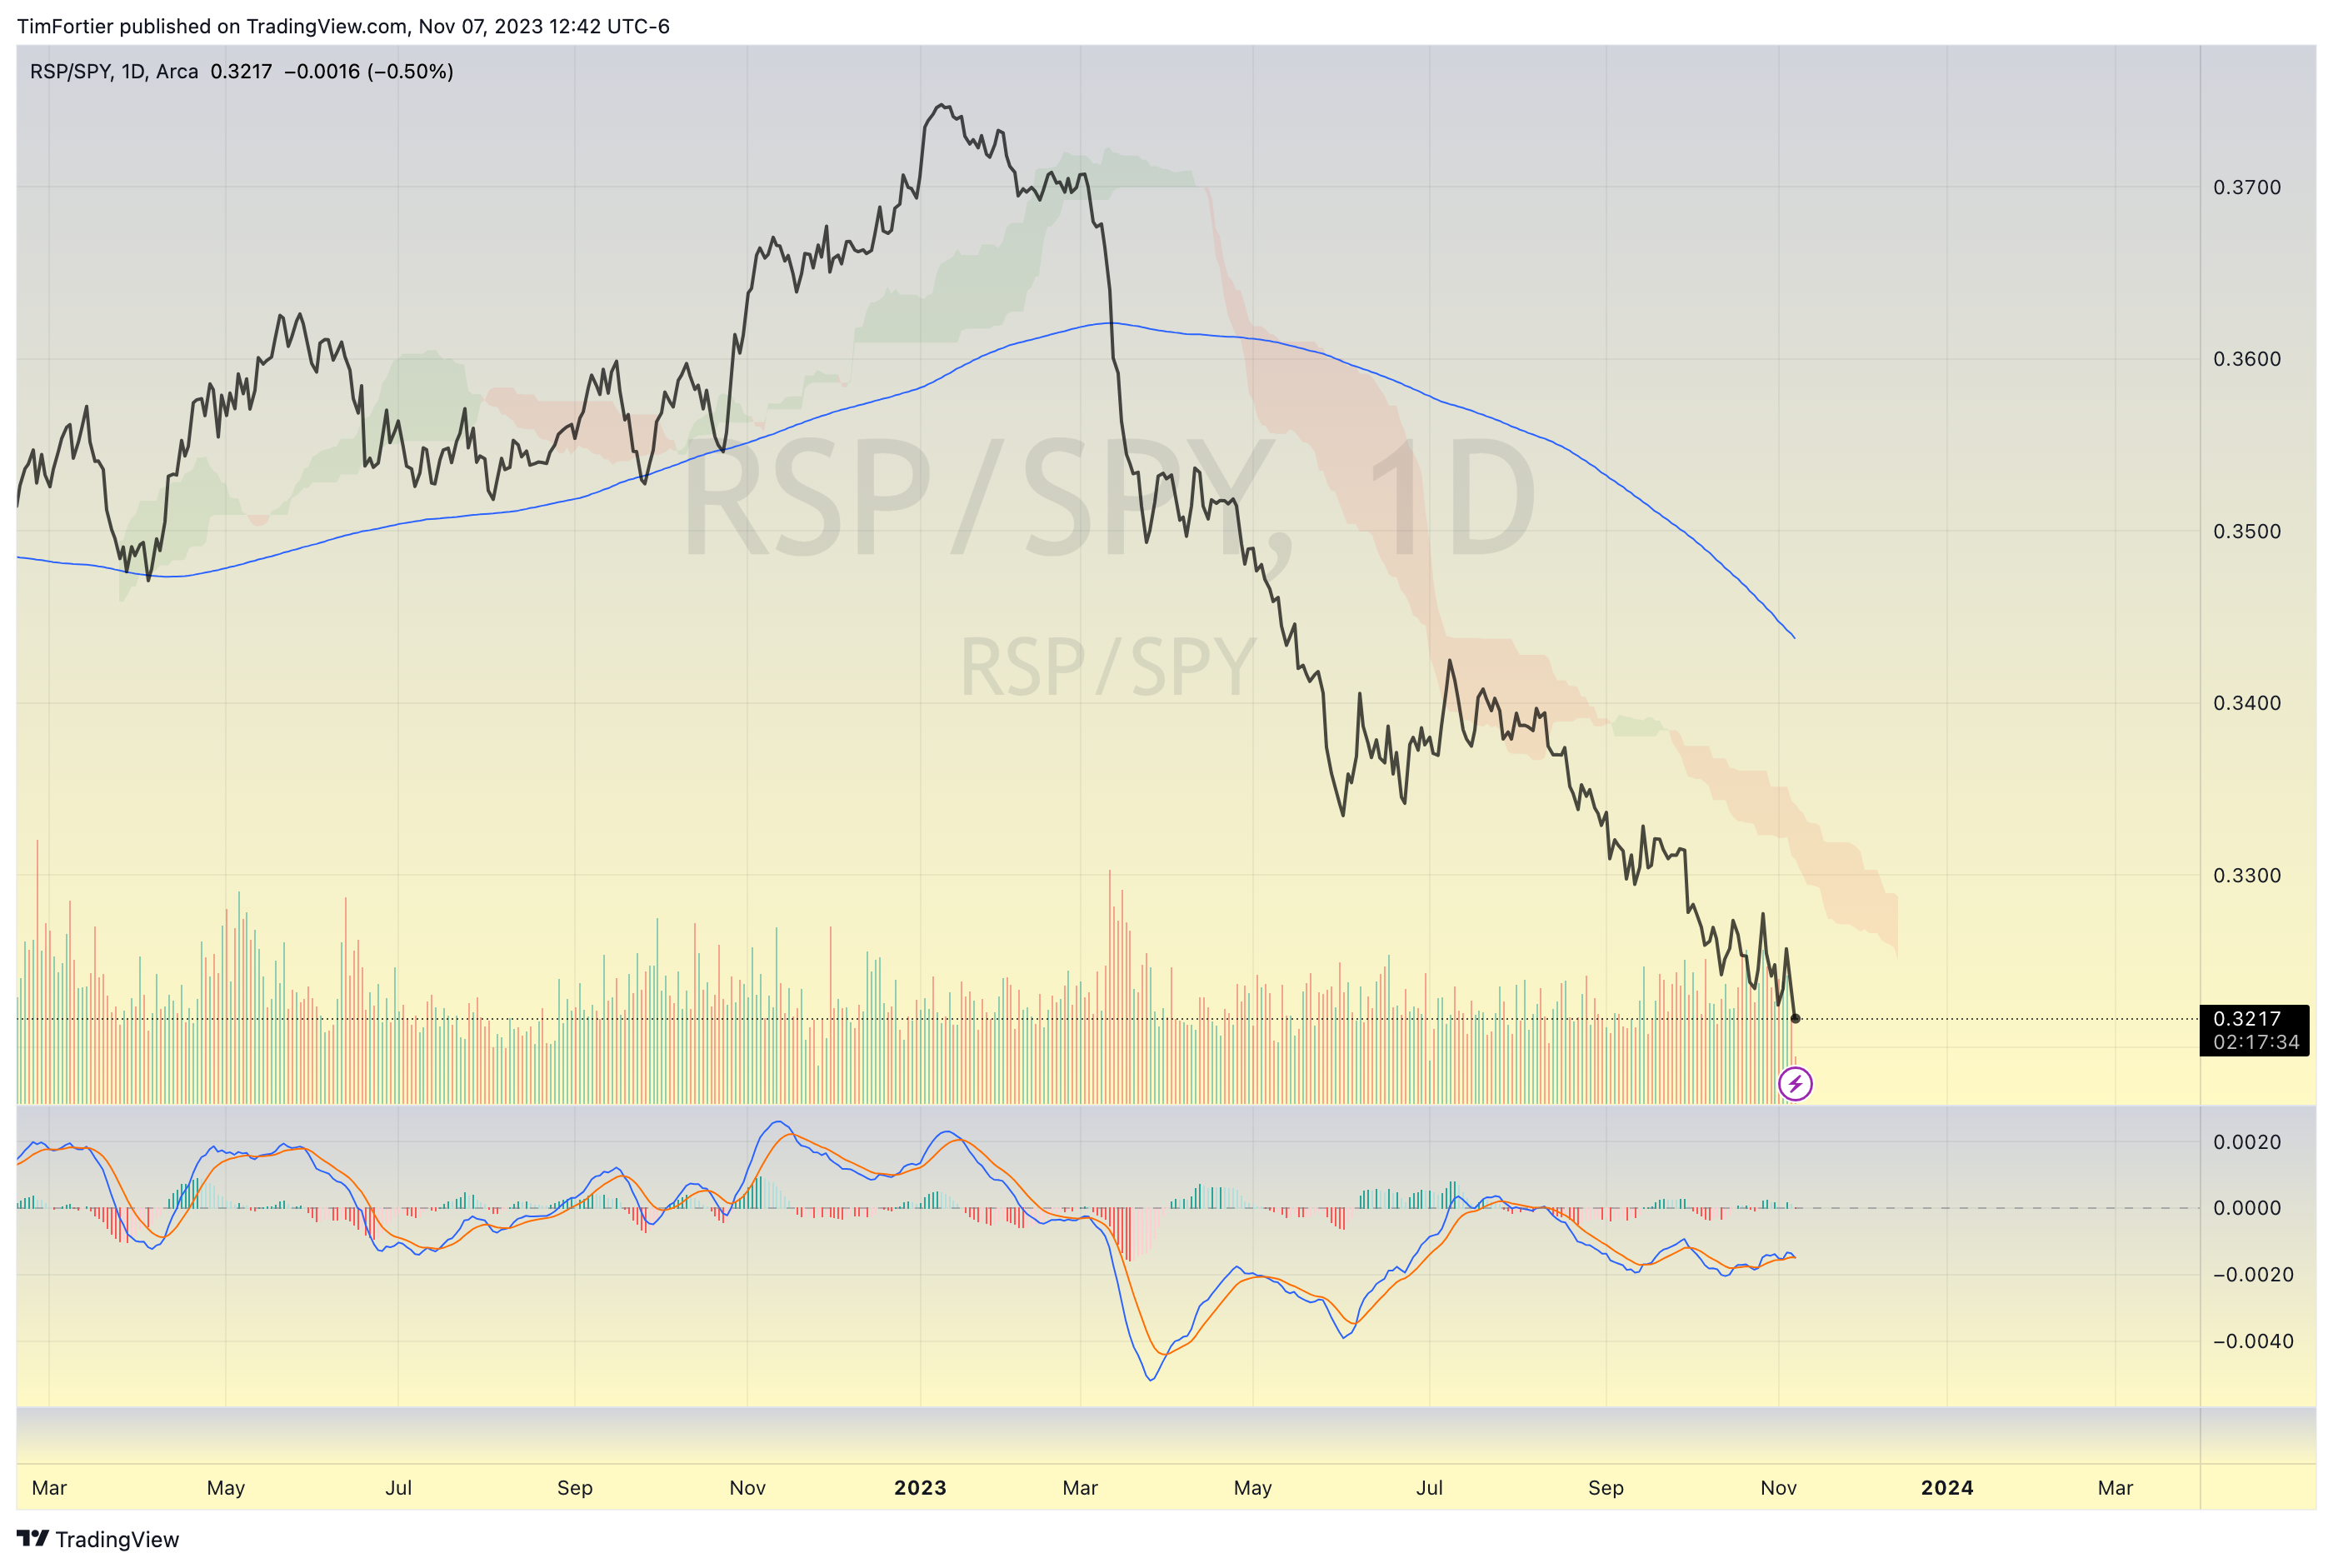
When looking at the equal-weight S&P 500 to the market-cap weight S&P 500, the equal weight continues to perform miserably.
The relative comparison chart below shows how the equal weight is making a new low.
And small caps continue to get no respect as they, too, are performing poorly.
This suggests that, as has been the case all year, a number of mega caps are doing most of the heavy lifting.
And to no surprise, we can see that the same stocks are indeed being played hard.
My big concern last week was the breakdown in the FAANG index, but that proved to be nothing more than a shakeout as the index has quickly reversed higher.

Attention will now turn to NVIDIA’s earnings to be reported on 11/21.
Seasonality also favors the market bulls, as over the last ten years, the market has tended to be higher 90% of the time.

While there is no guarantee that the market will rally into year-end, the combination of sentiment, improving technicals, and seasonality certainly tilts the odds in favor of being long.
If you have any questions or have been considering hiring an advisor, then schedule a free consultation with one of our advisors today. There’s no risk or obligation—let's just talk.
Tags

Free Guide: How to Find the Best Advisor for You
Get our absolutely free guide that covers different types of advisory services you'll encounter, differences between RIAs and broker-dealers, questions you’ll want to ask when interviewing advisors, and data any good financial advisor should know about you and your portfolio.
