
Related Blogs
May 15, 2023 | Avalon Team
The S&P 500 is 7.56% higher than it started the year and the NASDAQ is ripping it up, gaining over 22% YTD.
So shouldn’t we be happy? Well, there’s more going on here than meets the eye…
During strong or healthy markets, we expect to see more stocks advancing in price than declining in price.
In weak markets, we tend to see the opposite – more stocks declining in price than advancing.
What’s tripping up a lot of investors is that they’re unwittingly relying on external markets as their guide to the strength of the current market.
This can be a huge mistake.
If you’re relying on a bunch of cap-weighted or dollar-weighted indexes for direction, you could be setting yourself up for disaster because these indexes only tell you what’s happening on the surface.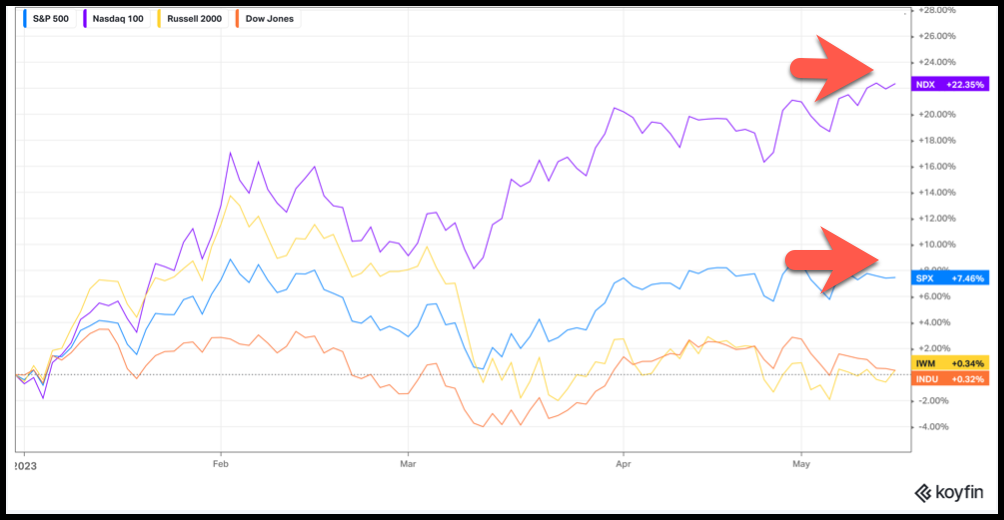
Take a look at the image above. What do you see?
The S&P 500 is up about 7.5% this year while the tech-heavy NASDAQ has gains over 22% YTD.
So what’s the problem?
Well, have you ever been in the ocean with the sun glistening off the water? The waves are gently rolling by, it’s all very pretty and tranquil…
But what about what’s under the water that we can’t see?
And that’s the problem with indexes…
They can’t tell you what’s lurking beneath the surface.
Maybe it’s nothing or maybe it’s Jaws!
If you’re afraid of the ocean you can swim in a pool, but you have no such luxury when it comes to investing.
But, what you do have is technical analysis.
In technical analysis, we like to use resources that provide a visual representation of what stocks are doing, especially under the surface.
This is what we refer to as market internals.
Where the novice investor relies on market externals, seasoned investors like you will rely on market internals.
So let’s dig into the talk about the lack of stock participation you may have been hearing about and why it matters.
Take a look at the chart below. The top pane of this chart is a price chart of the S&P 500 index.
It peaked in February, fell in March, and is now back testing its February highs. Testing previous highs is positive.
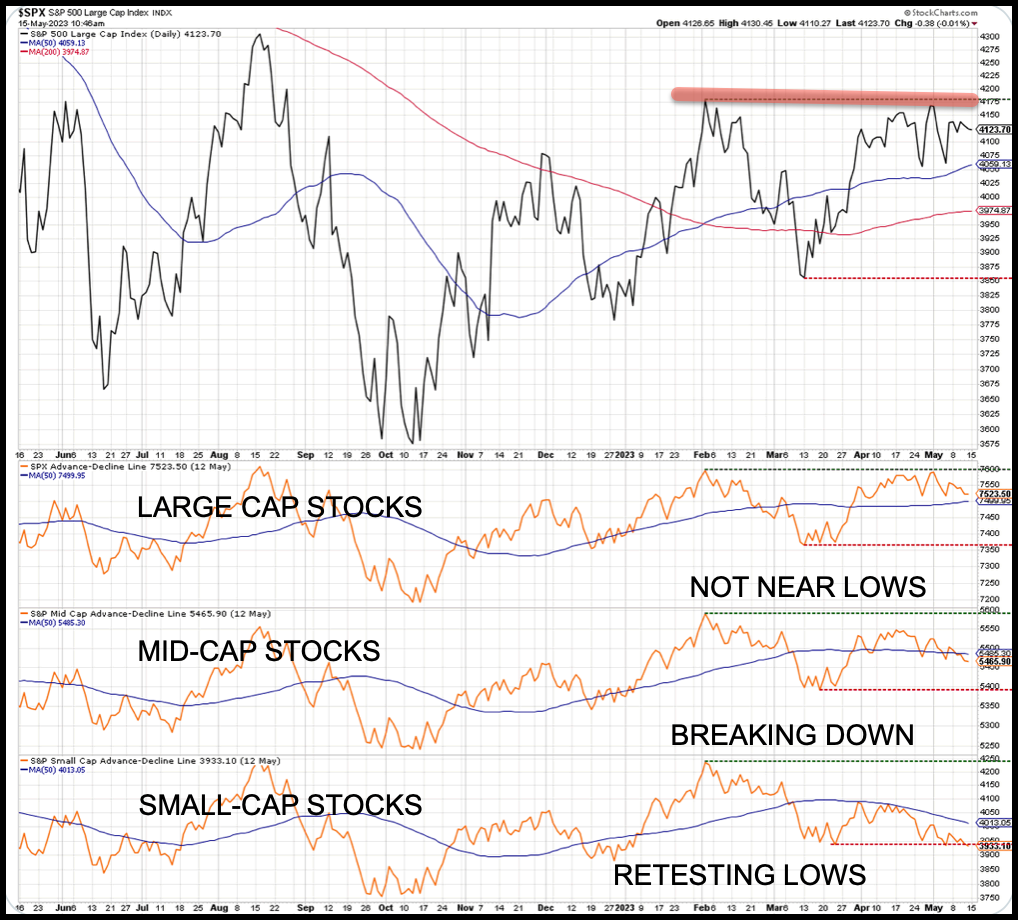
The lower pane of the chart above is the Advance-Decline lines of Large-Cap Stocks, Mid-Cap stocks, and Small-Cap Stocks.
The “A/D Line” of Large-Caps (S&P500) is hovering around its February and early May highs. This looks okay.
But take a look at the A/D Line for the Mid-Caps and Small-Cap Stocks. The A/D lines of both are well off their respective February peaks.
That means instead of more Small- and Mid-Cap Stocks advancing in price, more of them are declining in price.
That is not a sign of a healthy strong market. That is the sign of a market that is being led by a few Large-Cap and Mega-Cap stocks.
Take a look at the image below. The stocks in the box have the biggest impact on the direction of the index.
They are also all up significantly on the year, pushing the S&P index higher.
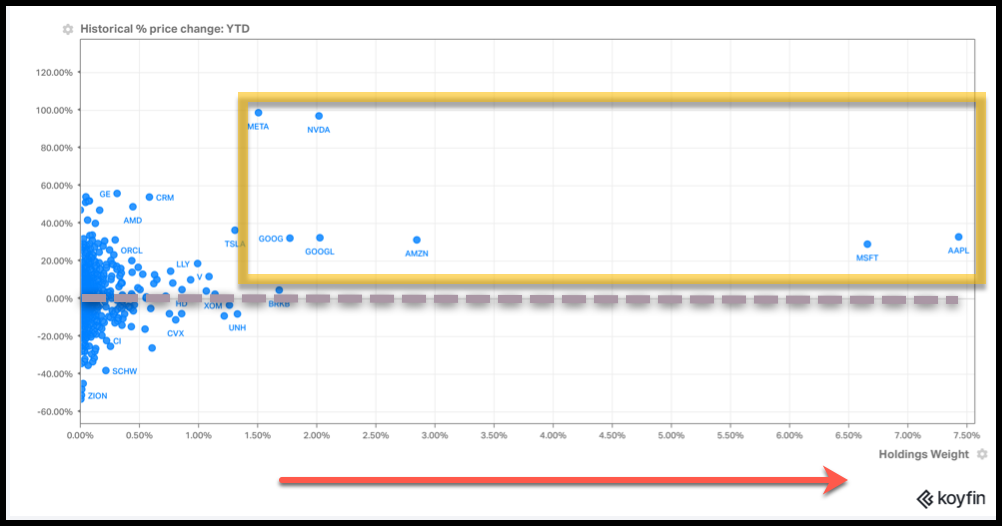
The zero line is the gray line – any blue dot below that is a stock with negative returns in 2023.
There are a bunch of them, but they have very little weight on the direction of the index so for index watchers. They go unnoticed.
Because I’m not a fan of tracking one large-cap index (SPX), I prefer to look at the 2400 stocks that trade on the New York Stock Exchange. It’s larger and tech stocks do not make up nearly 30% of its holdings.
The upper pane of the image below is the Advance-Decline of the NYSE, and the lower pane is the price chart of the S&P 500 index.
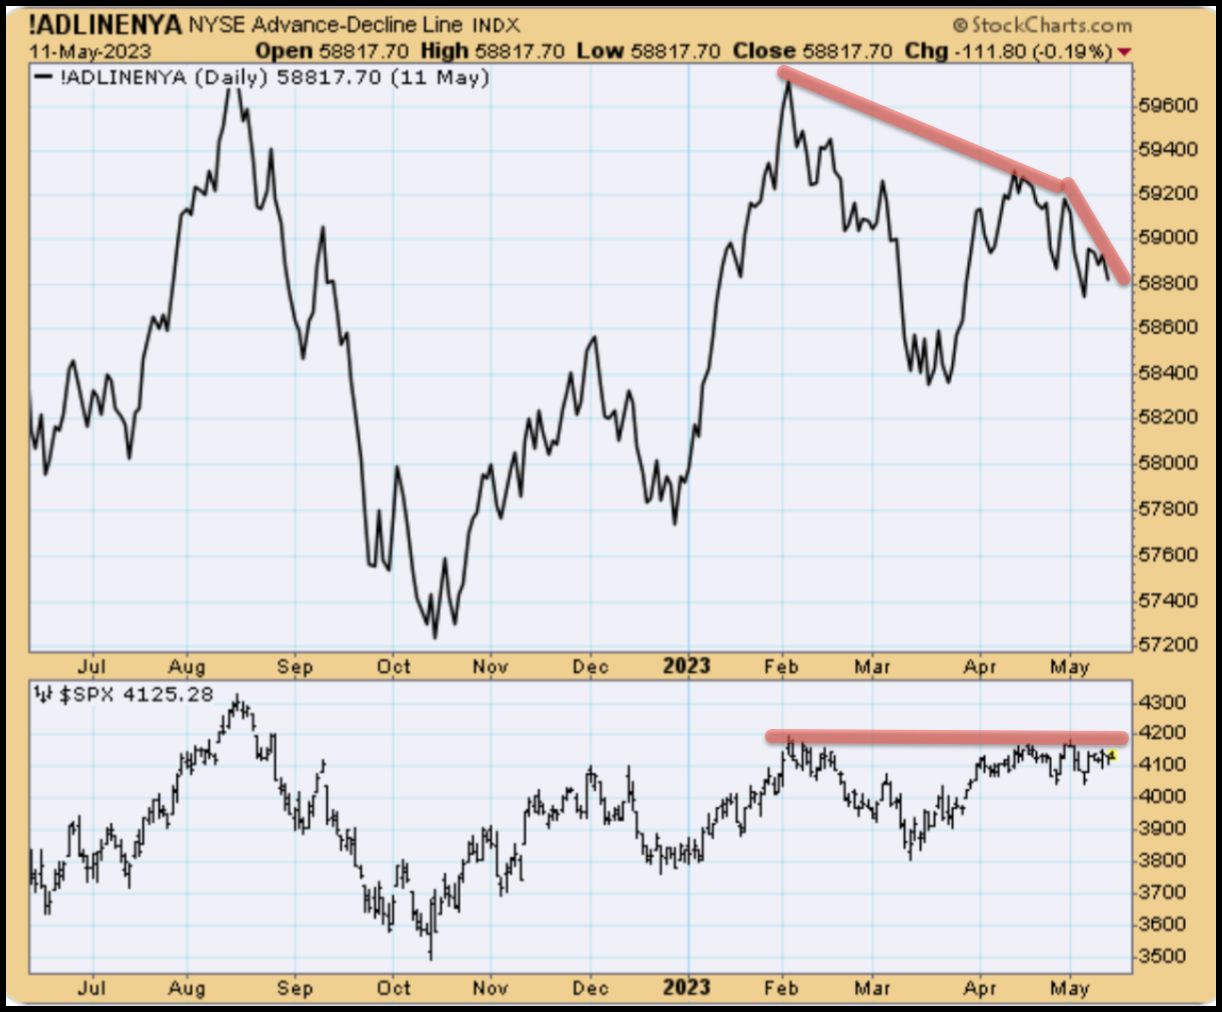
The S&P 500 index appears to be in good shape, as it retests its February highs, but the A/D Line for all the stocks trading on the New York Stock Exchange is telling us something very different.
We have a negative divergence in the NYSE A/D Line vs the SPX.
In other words, stock prices from all the stocks that trade on New York Stock Exchange (2400 of them) are not confirming the highs in the 500 large-cap stocks that trade on the S&P 500.
If you’re only watching the external markets, you’d never know about the weakness of stocks lurking right under your feet.
Since peaking in February more and more stocks have been declining in price, not rising in price. That’s not what bullish investors want to see!
We don’t have sustained bull markets unless more stocks are moving higher in price than are moving lower in price.
If our U.S. market of stocks was indeed strong, you would see more stocks moving higher in price than moving lower in price, and you would see that not just in Large-Cap Stocks, but in Small- and Mid-Cap Stocks as well.
So, my advice is to proceed with caution and look below the surface to understand the market climate better.
If you have any questions or have been considering hiring an advisor, then schedule a free consultation with one of our advisors today. There’s no risk or obligation—let's just talk.
Tags

Free Guide: How to Find the Best Advisor for You
Get our absolutely free guide that covers different types of advisory services you'll encounter, differences between RIAs and broker-dealers, questions you’ll want to ask when interviewing advisors, and data any good financial advisor should know about you and your portfolio.
