
Related Blogs
December 15, 2021 | Michael Reilly
A week ago, I warned investors that the week ahead would be an important one for stocks and risk assets in general. And therefore an important week for investors.
The direction stocks turned would tell us a lot about what to expect in the coming weeks and possibly spell the end of the current bull market.
This morning, during our team meeting, it was suggested I put out a quick summary of any new developments that investors should be aware of.
So let’s revisit a few important stats from a week ago and compare them to today, to see if we’ve had any meaningful improvement or further breakdown.
Last week I pointed to price levels on both the S&P 500 and the DJIA as important lines in the sand. The message was that stocks had to hold their first-half highs.
I said we wanted to see the S&P 500 hold above 4500 and the September highs. If 4500 didn’t hold, it looked bad for stocks.
I also pointed out the 34500 level on the Dow Jones Industrial Average and its springtime highs as an important line. A meaningful and sustained breakdown would be damaging to some of the biggest stocks in the market.
I then commented about the importance of Treasury yields and reminded investors to watch them. If yields in the 30-Year and 10-Year fell dramatically it was likely happening in an environment where stocks were under a lot of selling pressure.
Investors didn’t want to see the 30-Year yield fall below 1.75% and the 10 Year fall below 1.40%.
We didn’t want to see yields break below their respective trend lines.
So, what’s changed? Has anything changed? What does it mean to investors?
The short answer is yes, we’ve seen some changes and some improvements in these key levels.
Let’s start with the S&P 500 Index:
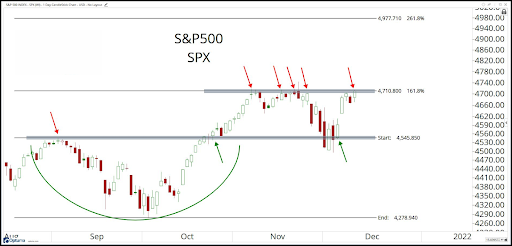
Not only did the 4500 level hold, but the S&P 500 rebounded to reach an all-time high.
But as a caveat, and a word of caution, I will remind investors, these new highs in the index are happening while we continue to see weakening support from stocks under the surface, meaning fewer stocks are participating in the index’s rise to all-time highs.
Either stocks get it in gear and start to move higher or the index catches down to what the majority of stocks are doing.
You can see the weakness in the chart below showing the Large-Cap S&P 500 index compared to the percentage of stocks making new 52-week highs down the cap scale.
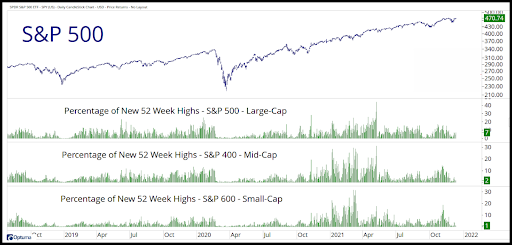
The bottom line is that we haven’t seen such weak breadth since COVID showed up a year ago.
Next up is the Dow Jones Industrial Average:
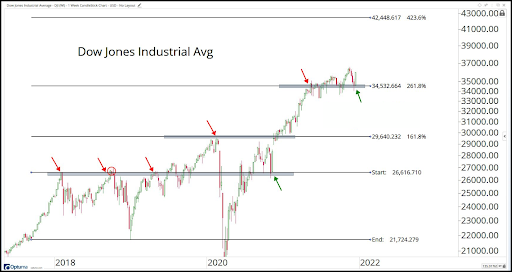
In a week’s time, the DJIA held and advanced 1000 points, back to 35500.
The DJIA found support at a very logical level, at a key technical level – kudos to the Dow!
We can summarize equities by saying that buyers stepped in and defended some very important price levels.
However, everywhere we look, it’s messy.
Now for Treasury Yields…
We’ve seen some dramatic improvement with yields running back above our key levels.
The 30-year yield is back above 1.75%, sitting at 1.88% today. The 10-year yield is back above its key 1.40% mark and is at 1.49% today.
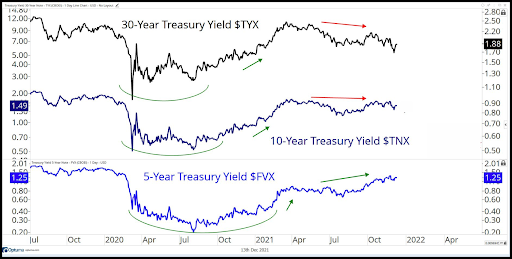
That’s important information and a sigh of relief for many investors – or I should say, bullish investors…
Because if yields continue to falter, that’s happening when market bulls are heading for the exits and looking for someplace safe to put their investment capital.
And what would that mean for this bull market?
There are many, many other indicators we’re watching closely throughout the week, but the equity indexes and bond yields are as important as any of them.
I’d like to sit here and tell everyone the clouds are parting and it’s all systems go for stocks. But we’re just not there – yet.
It’s too early for the bulls to either claim victory or concede defeat…
So we’ll have to wait, watch and adjust to whatever the markets send our way.
It’s always a matter of weighing the evidence – and that means tracking data over time looking for emerging trends.
I will say that if a few of our key indicators continue to show improvement over the next few weeks, it could signal a strong opportunity on the horizon, but for now, it looks more like what we saw all summer….
Until next week, invest wisely…

PS: Want these kinds of insights applied directly to your portfolio as we see them? To make the whole investment process easier, give us a call. We’re opening our doors to new investors who have portfolios valued over $500,000. If you’d like to schedule a free 1-hour consultation to review your portfolio, click here.
Tags

Get Our FREE Guide
How to Find the Best Advisor for You
Learn how to choose an advisor that has your best interests in mind. You'll also be subscribed to ADAPT, Avalon’s free newsletter with updates on our strongest performing investment models and market insights from a responsible money management perspective.
